Friday, April 29, 2022

Price Action: 5 Best SELL Positions (Part 10)

Commitment: If you do it right and master what I write in this article, you will make money in the market.

To write this one, I have prepared an account with 6 weeks of trading to summarize examples as evidence for the knowledge below. Hope this will be the article you are looking for.

It includes the following parts.

– Remind knowledge about Downtrend and levels (Key level and Fibonacci)

– 5 best confluence Sell trading positions.

– Signal candles and how to set SL accordingly.

Register an Exness account NowGet $1,000 Free for beginners

Basic setups

H4 candlestick chart + view more candlestick signals at H1. Especially for Gold, I usually watch candles at H1 (but only for Gold). Do not view candles on small timeframes (M30, M15…). If you are a beginner, you should use the daily chart + H4.

Basic setups
Basic setups

Some major currency pairs include XAU/USD, USD family (GBP/USD, EUR/USD, NZD/USD, USD/CHF) and 2 JPY family (EUR/JPY, GBP/JPY). Just list what I understand and trade a lot every day. For example, I would never touch USD/JPY or CAD families.

Downtrend

Read these 2 articles again to understand Downtrend.

What Is A Downtrend In Forex? How To Trade Forex With A Downtrend.

Dow Theory – Downtrend and 3 phases.

For me, a downtrend starts from a broken uptrend candle + Breaks out of the support zone and goes down. The candle marked on the picture I will call the Master Candle (Very important).

For example, USD/CHF – The master candle fell sharply, broke the uptrend and broke out of the support zone.

The master candle confirms the downtrend of USD/CHF

Or like GBP/JPY

GBP/JPY master candle

Experience: The master candle is an extremely important signal. Because to reverse the trend (breaking trend and the support level), a strong bearish force is needed for confirmation. After the master candle is the time to work – Find SELL opportunities.

Levels

Resistance/Support, Key Level or Supply/Demand zone I will refer to as levels. Note: The levels are zones, not 1 point. In addition, in this Price Action series, I have added Fibonacci levels with 3 zones (0.382 – 0.5 – 0.618)

Levels
Levels

Must-read articles:

What Are Support And Resistance? How To Trade Forex Effectively.

What are Supply and Demand? All about them.

Price Action: Fibonacci Retracement.

Experience: Downtrend is the first factor and level is the second one. You can combine more indicators. The more factors, the lower the probability of your entry => The death rate is also lower.

4 Best Sell positions

Confluence of Trend, levels and SELL positions

We will talk about confluence first, then candle signals.

There are many confluence positions. I will list 4 positions with a high probability of winning (verified by me).

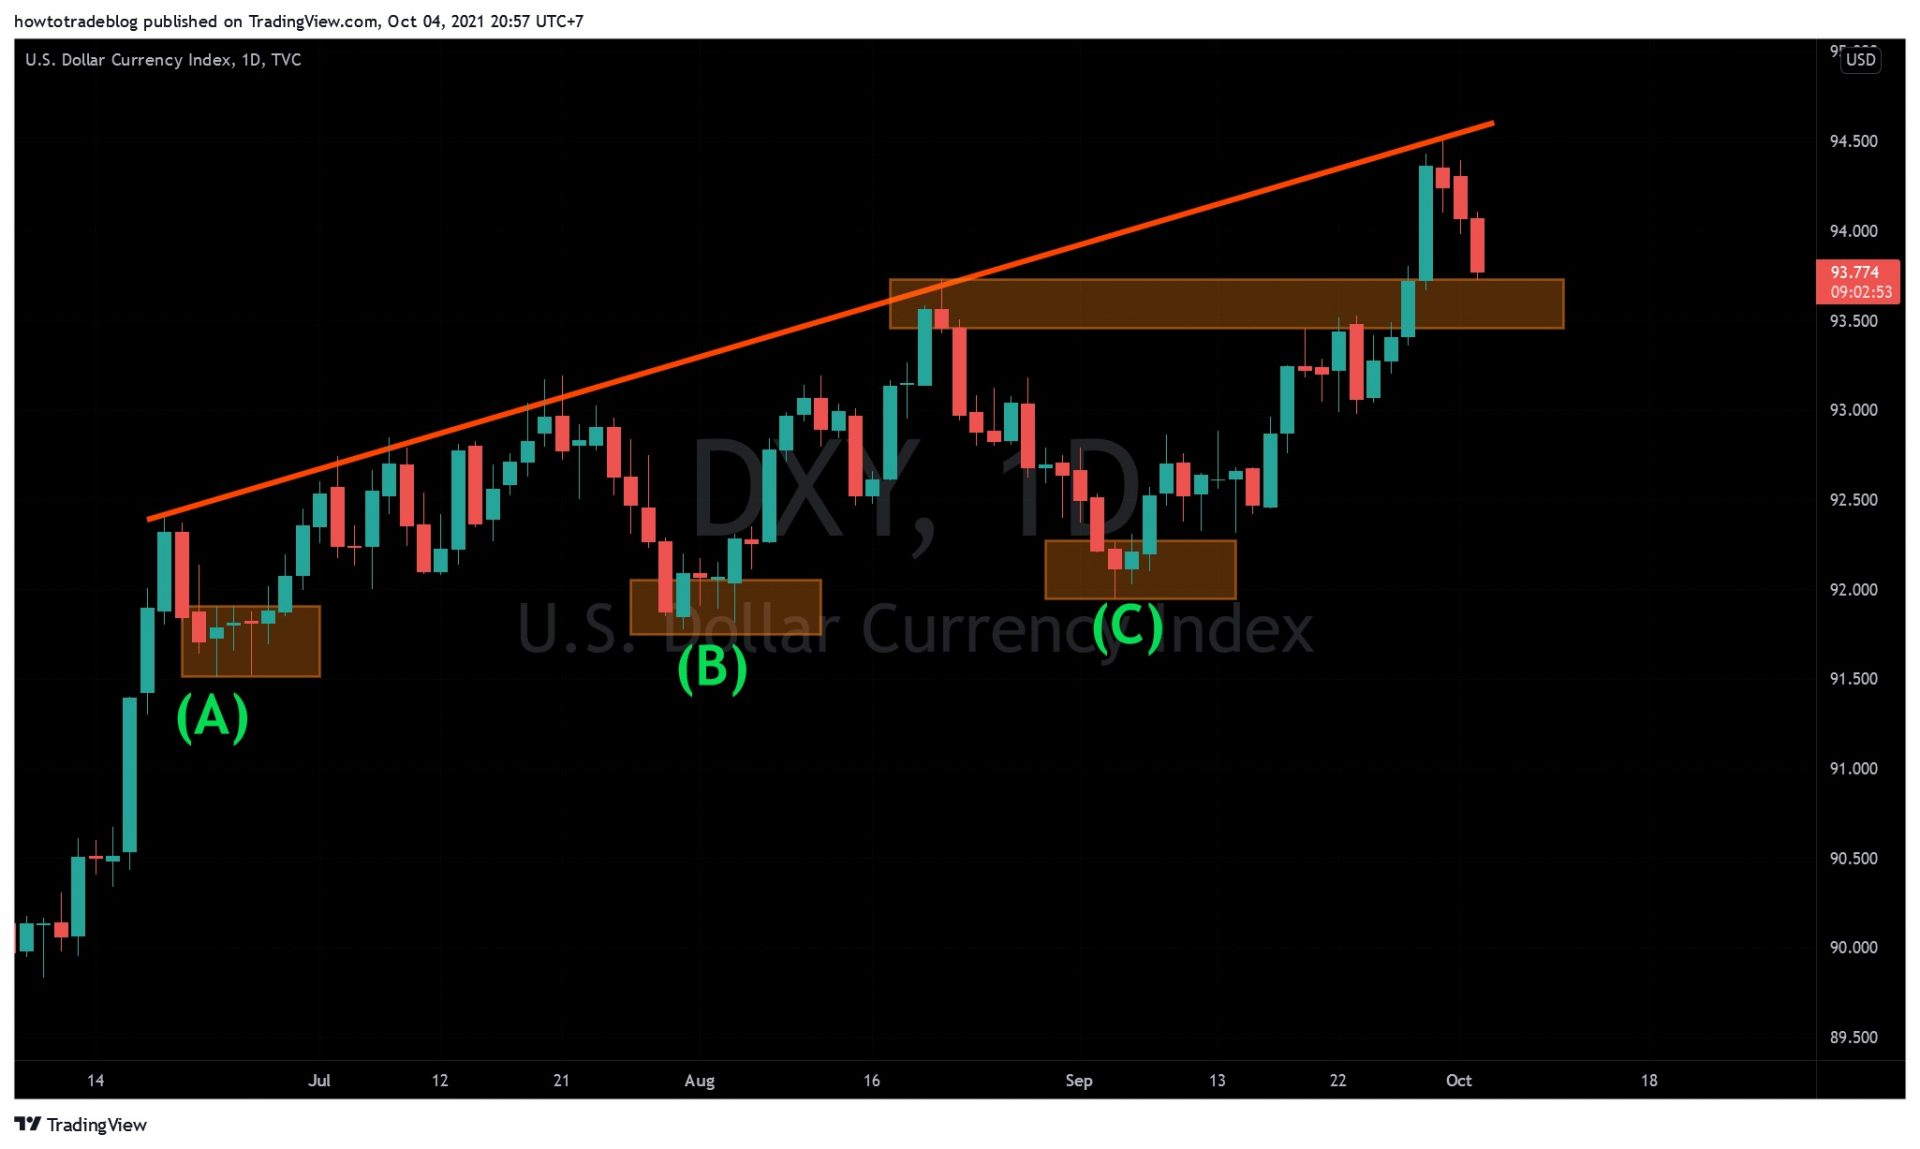
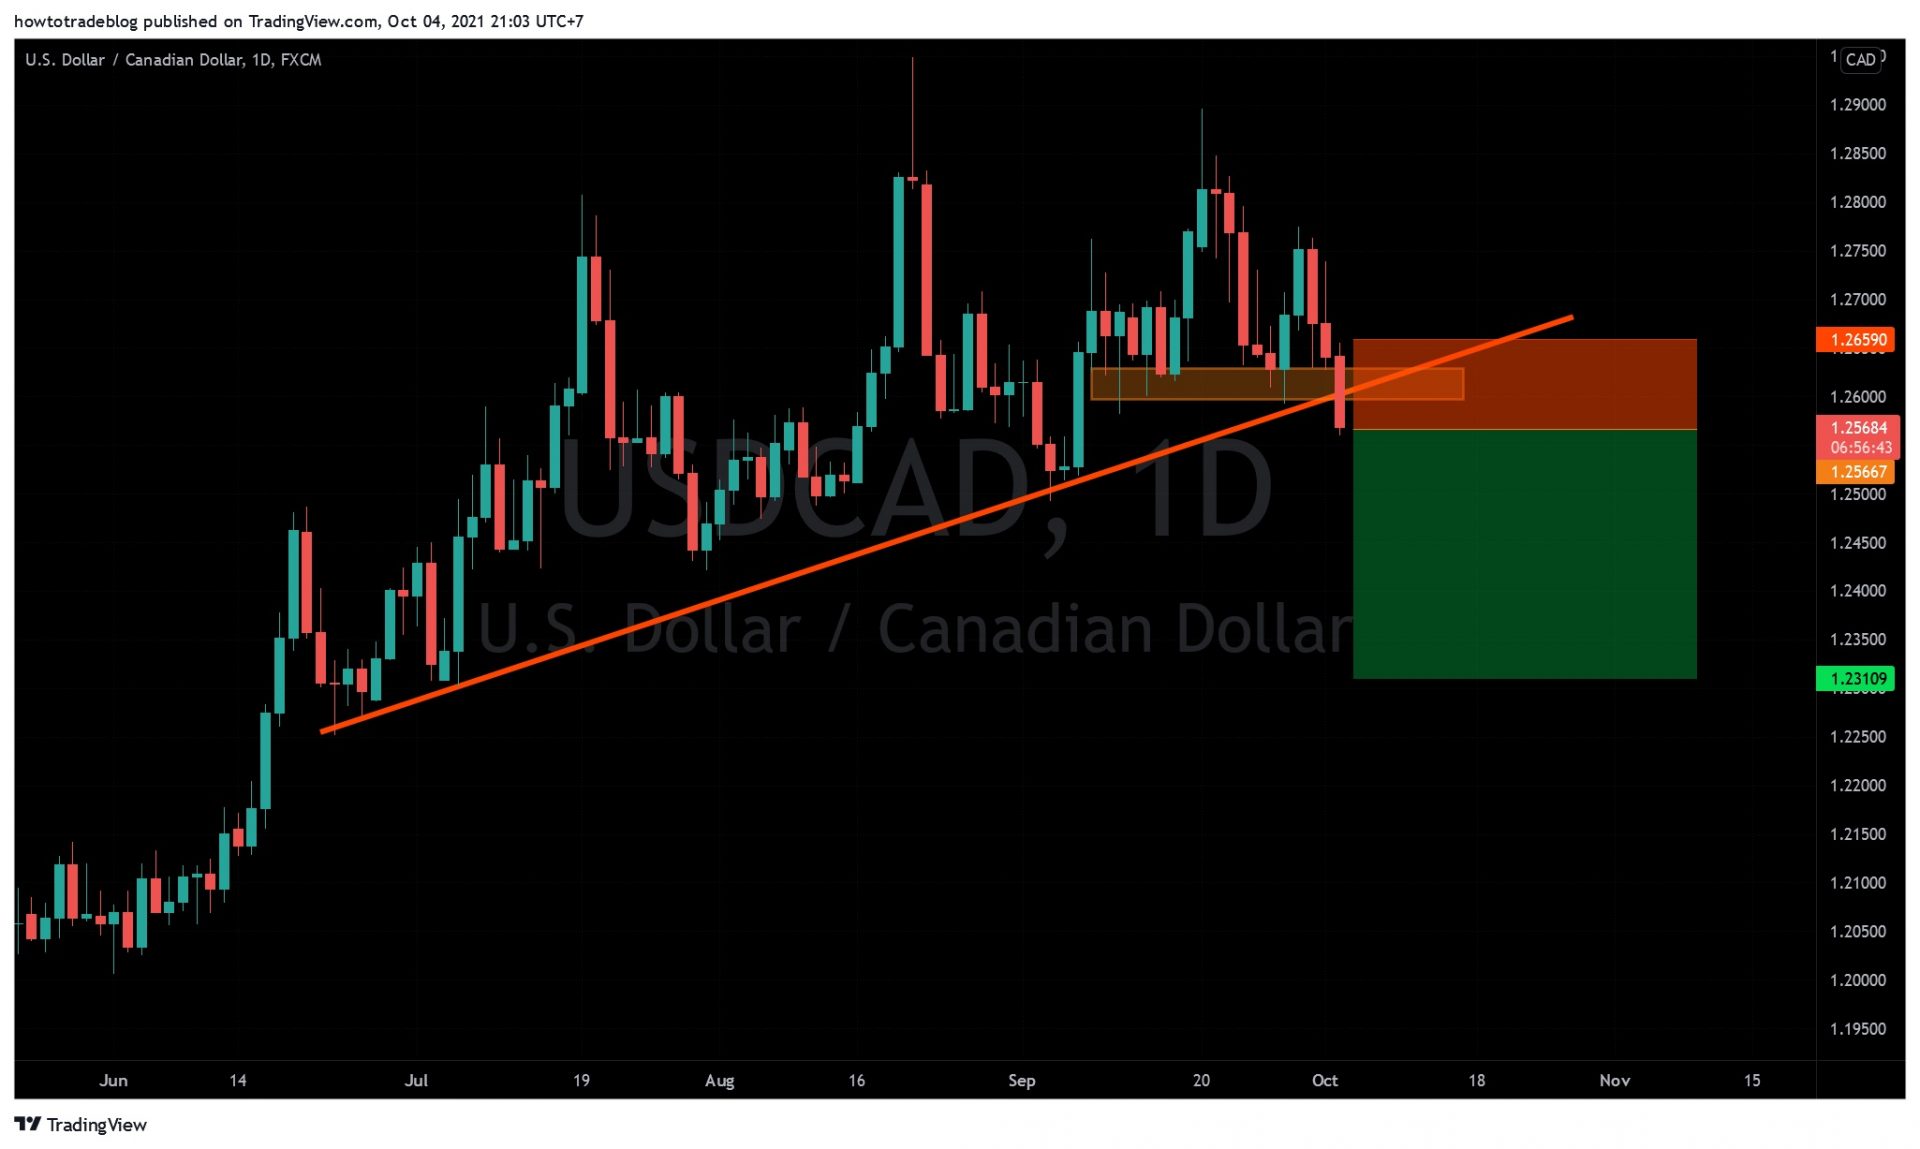
Position 1: Confluence of uptrend + retest + level

Gold usually has this type of position a lot. A sharp drop + test the uptrend + level, then continue to fall deeper.

Confluence of uptrend + retest + level

Experience: Only enter the first order when the price returns to retest the uptrend + level.

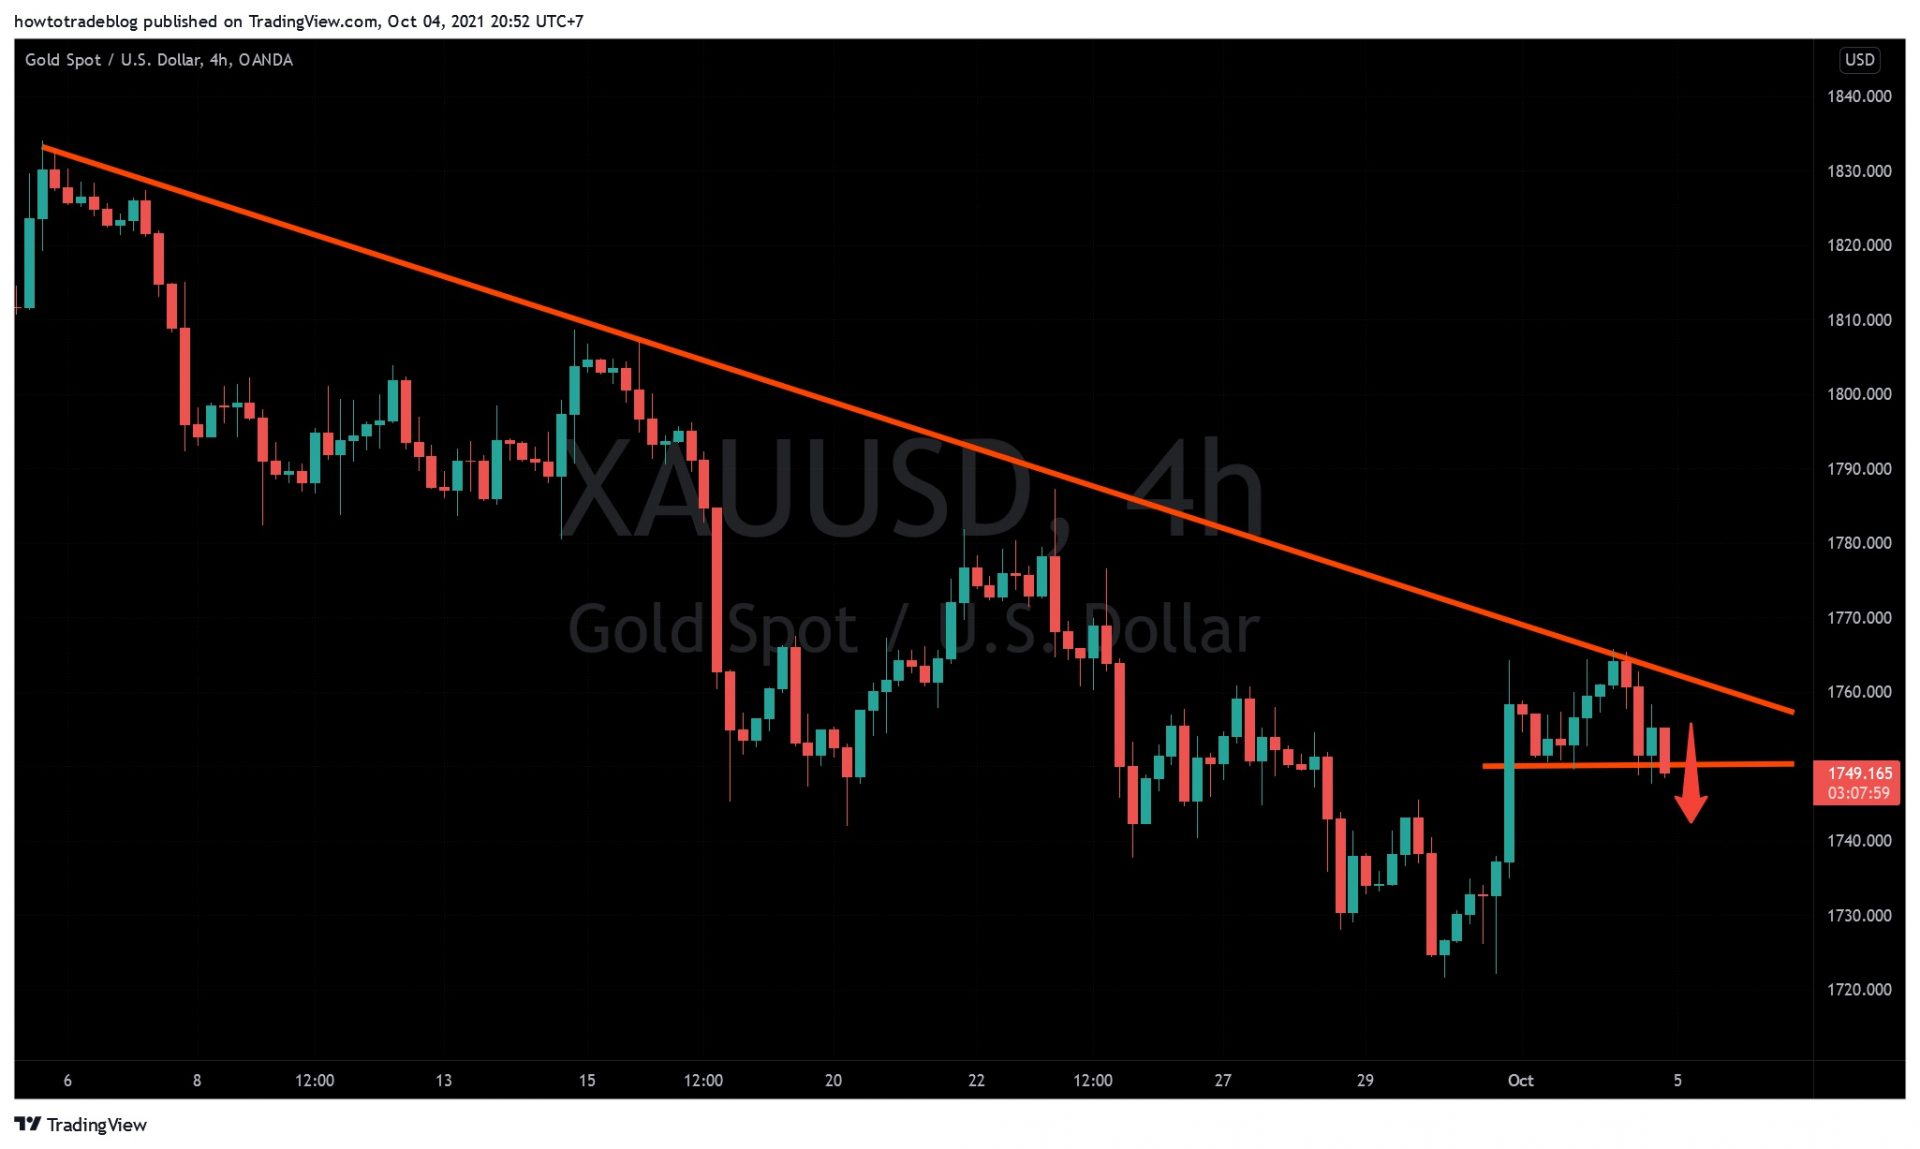
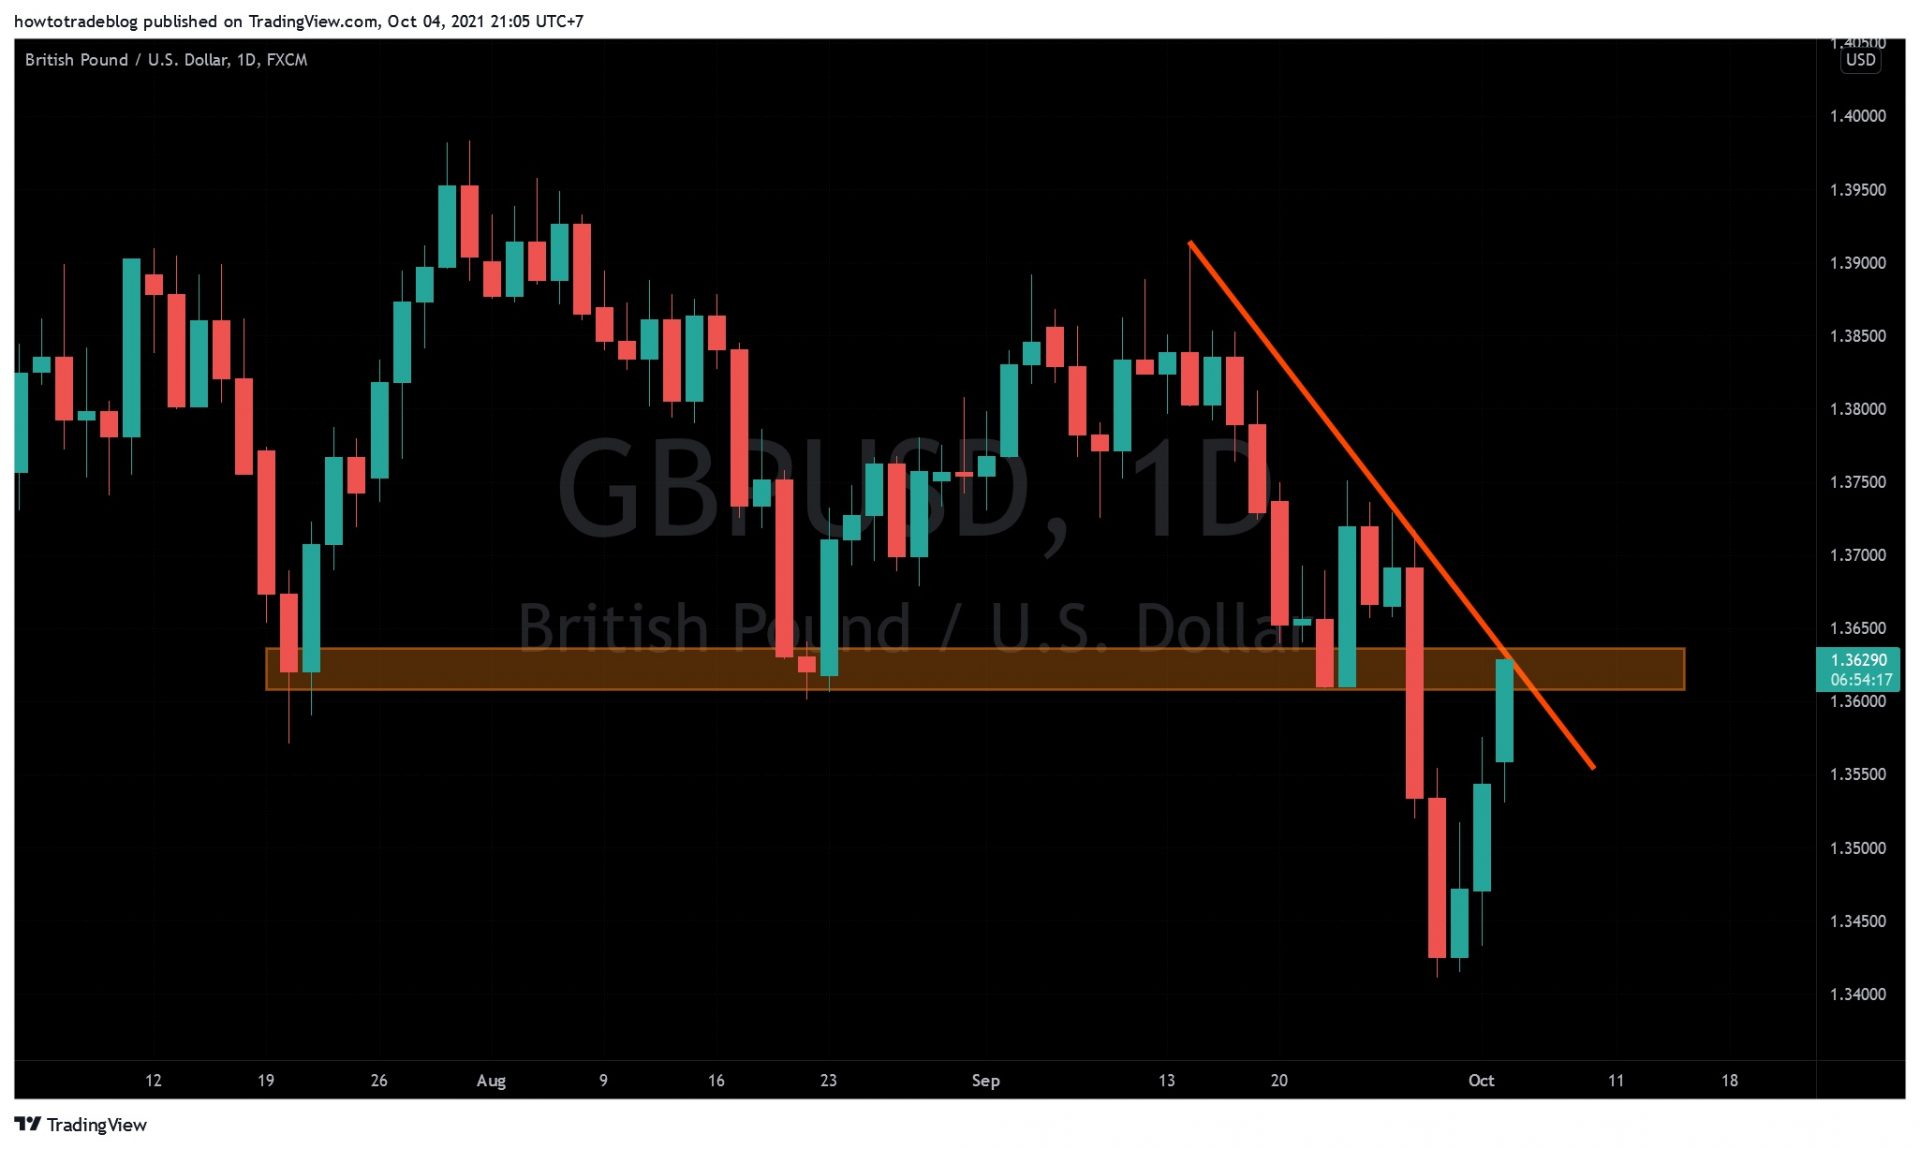
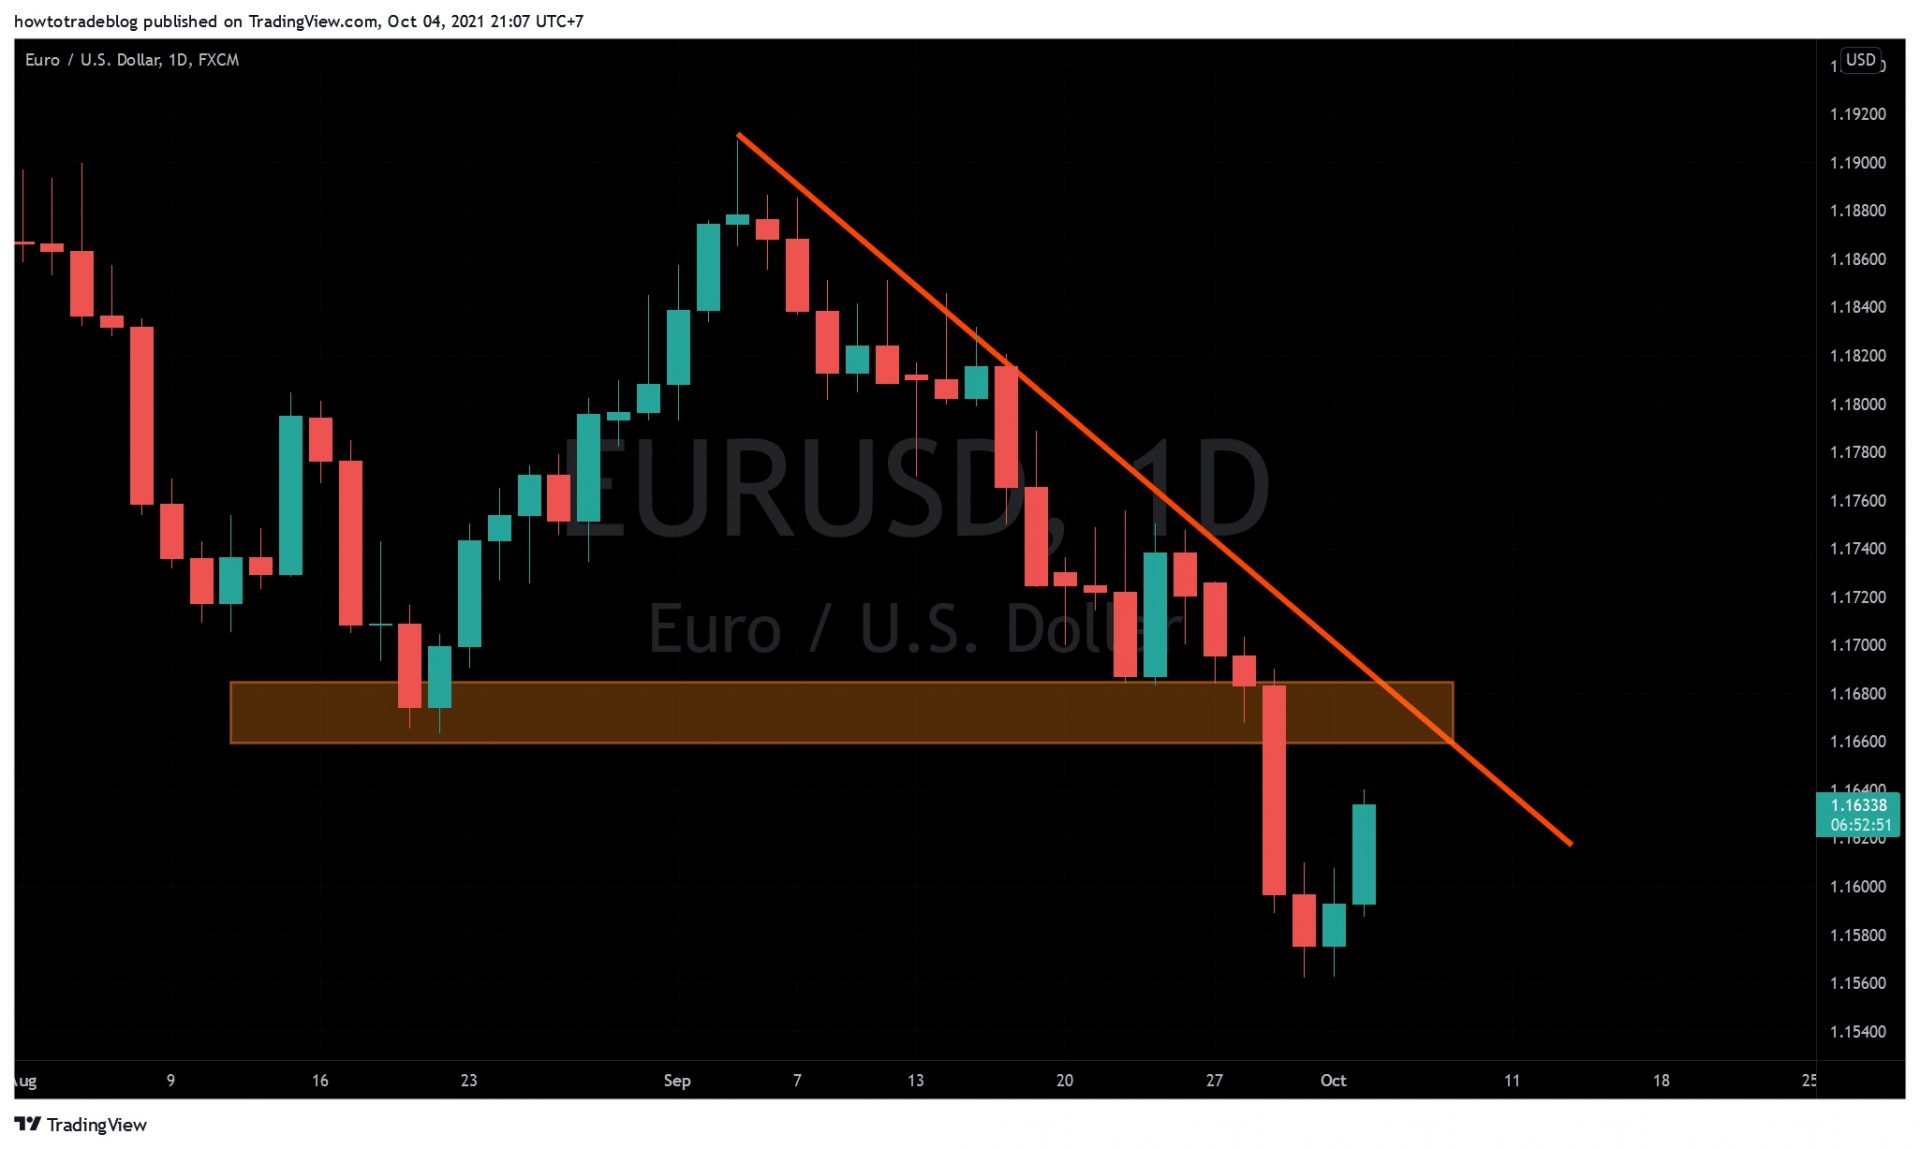
Position 2: Confluence of downtrend + level

This is known by everyone because it’s very easy to trade. The winning probability of this position is relatively high. Reason: The market has entered a downtrend. The story is just waiting to sell. I used to meet a continuous SELL segment of EUR/JPY.

Continuous SELL segment of EUR/JPY

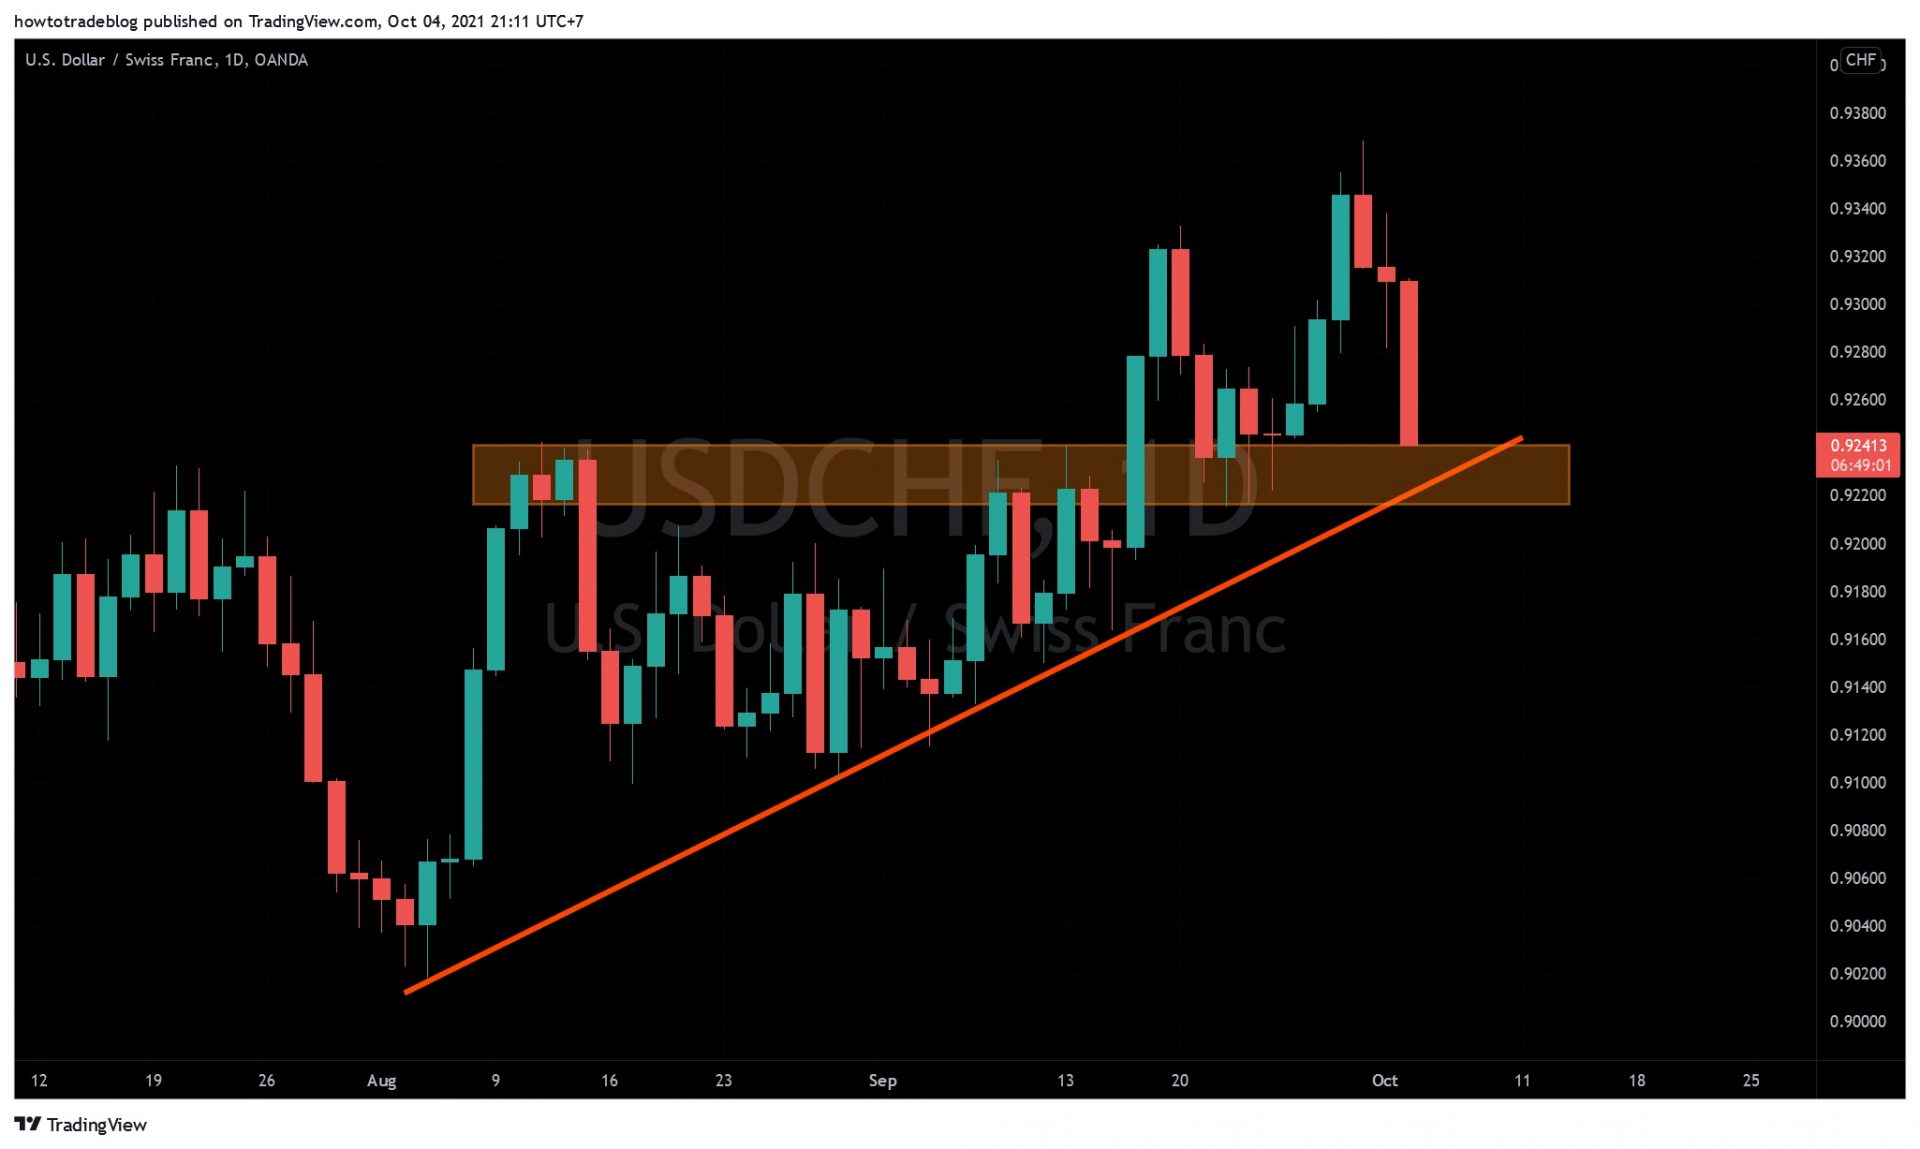
Or USD/CHF. Confluence of level + bearish trendline = SELL

SELL USD/CHF with the confluence of level and a bearish trendline

Experience: This is a position that you must learn and practice fluently in a downtrend. Sometimes you just need to catch exactly one trend like that. Trading the same position over and over is enough for a month’s profit.

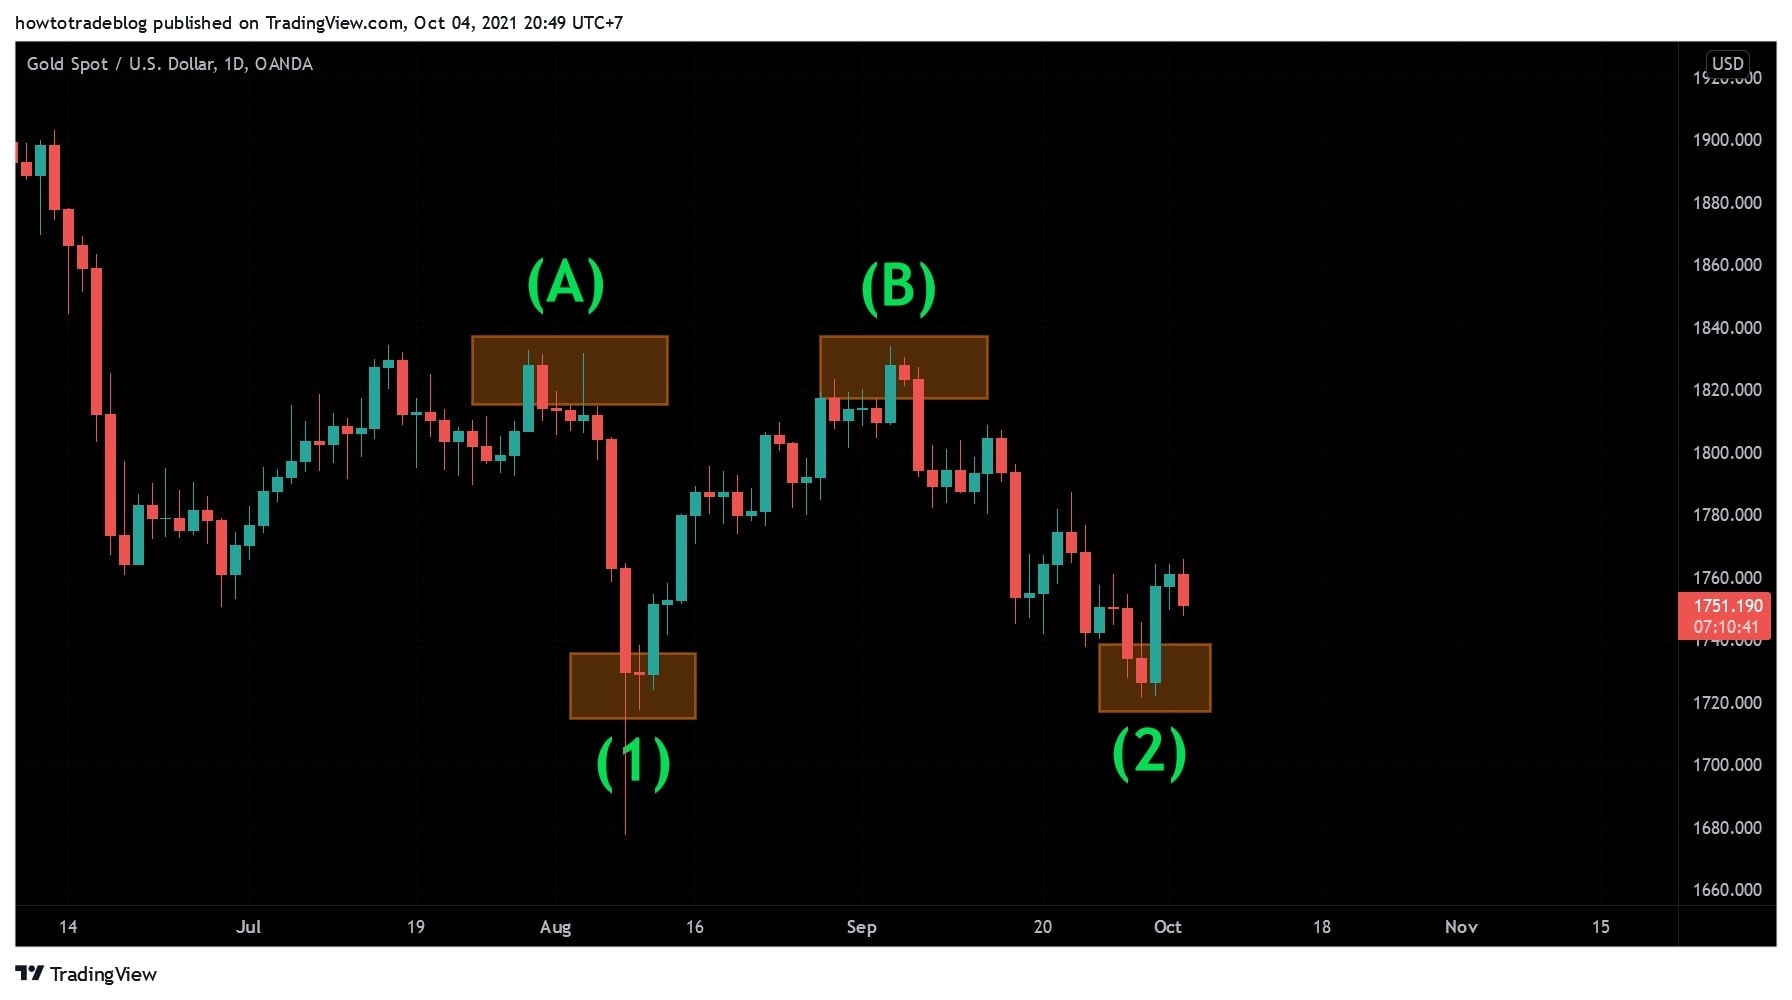
Position 3: Confluence of level + Fibonacci

Necessary condition for this position: the price moves after the master candle. The confluence of level + Fibonacci (Fibo) is also strong enough for me to enter SELL orders. Continuous SELL Gold continuously at confluence zones. The image below is an example.

SELL Gold continuously at the confluence of level and Fibo

Or like this, the best SELL Gold shot in the Academy account. After the master candle fell sharply => wait for Sell. Plan: Wait for the price to return to the confluence of level + Fibo = SELL. This is a very easy position to make money with Gold (XAU/USD): Strong crash > bounce (retracement) > wait for the confluence > SELL.

SELL Gold at the confluence of level and Fibo

Experience: Only enter an order for the first time. Don’t do it the next time. That means if the price returns to test again, then skip.

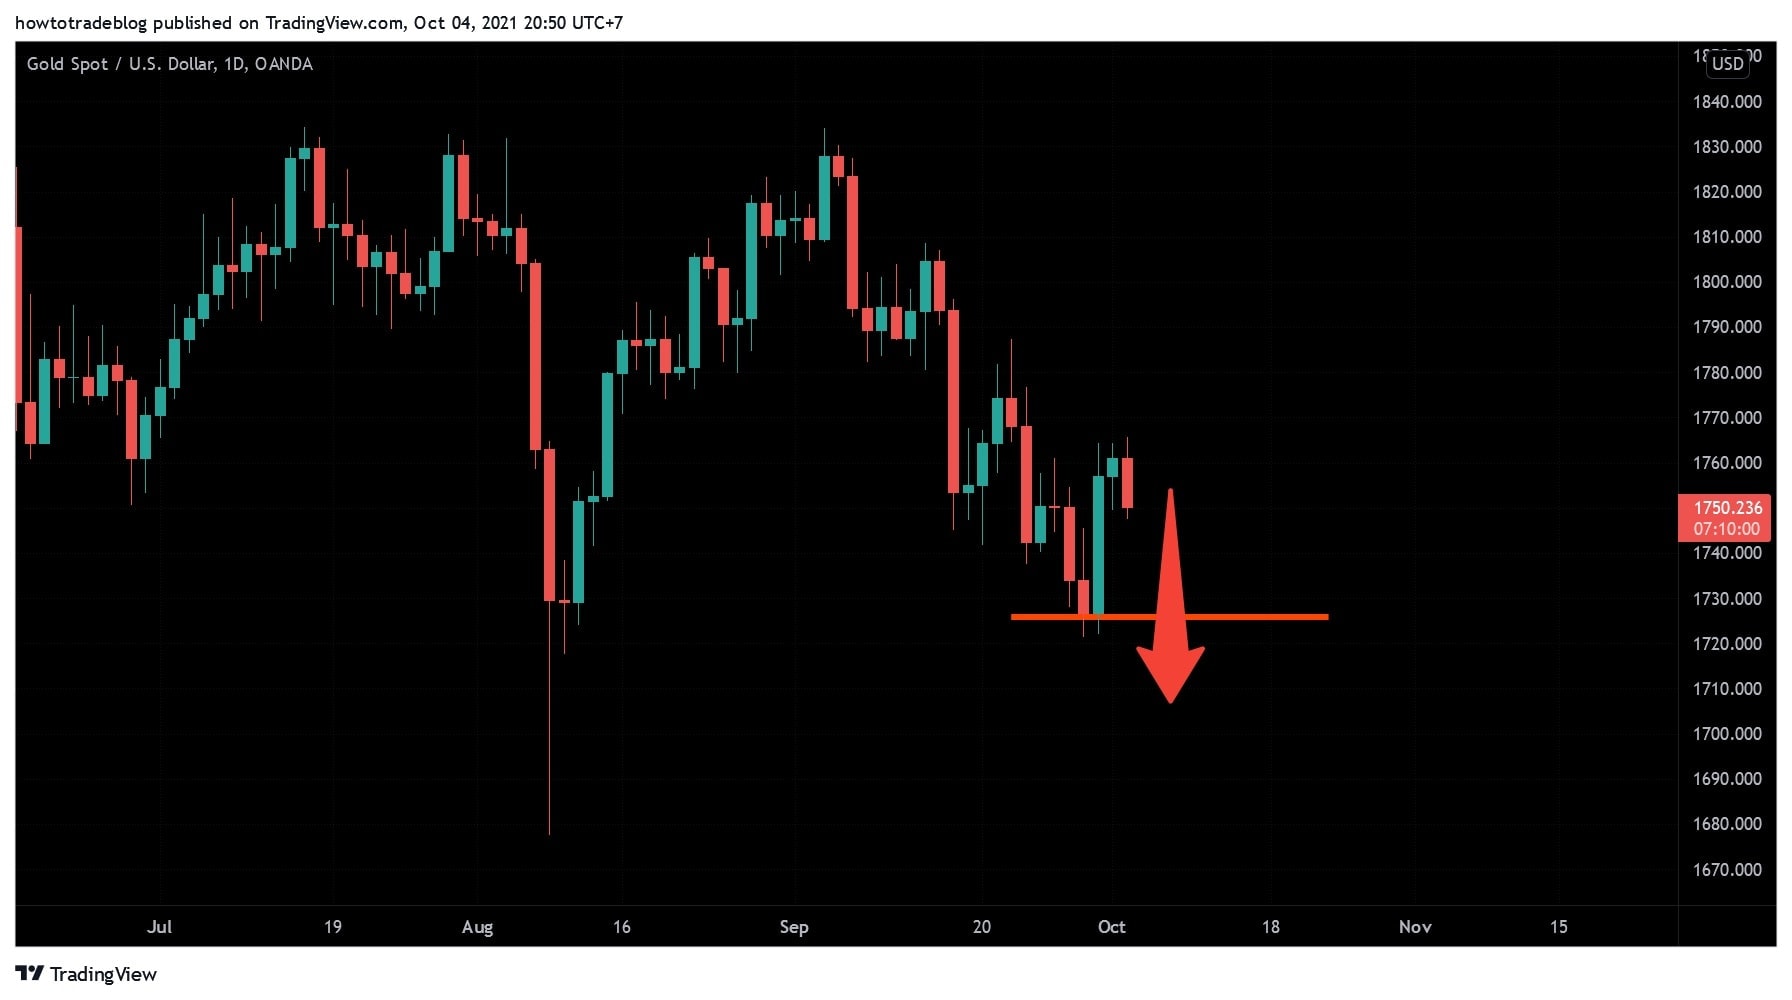
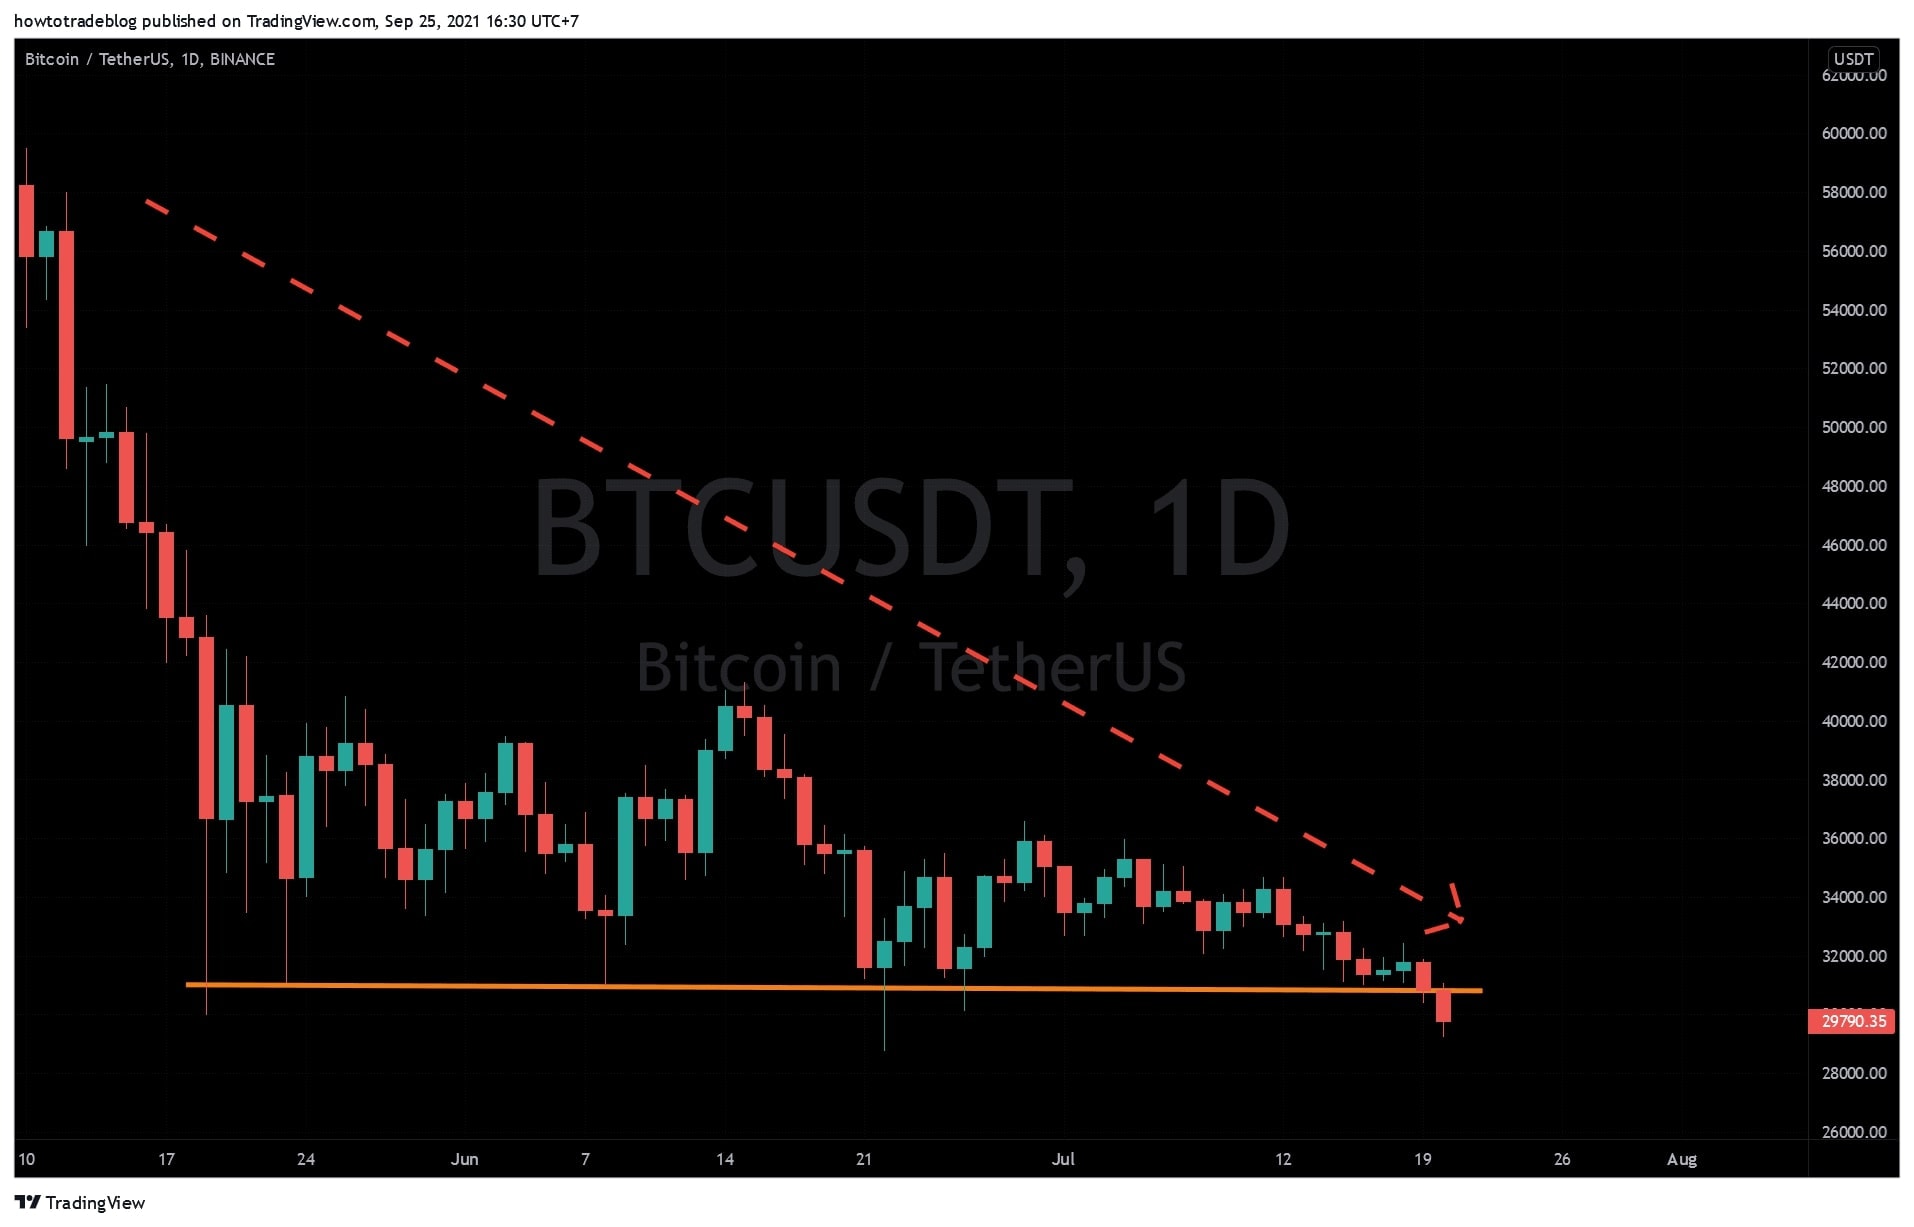
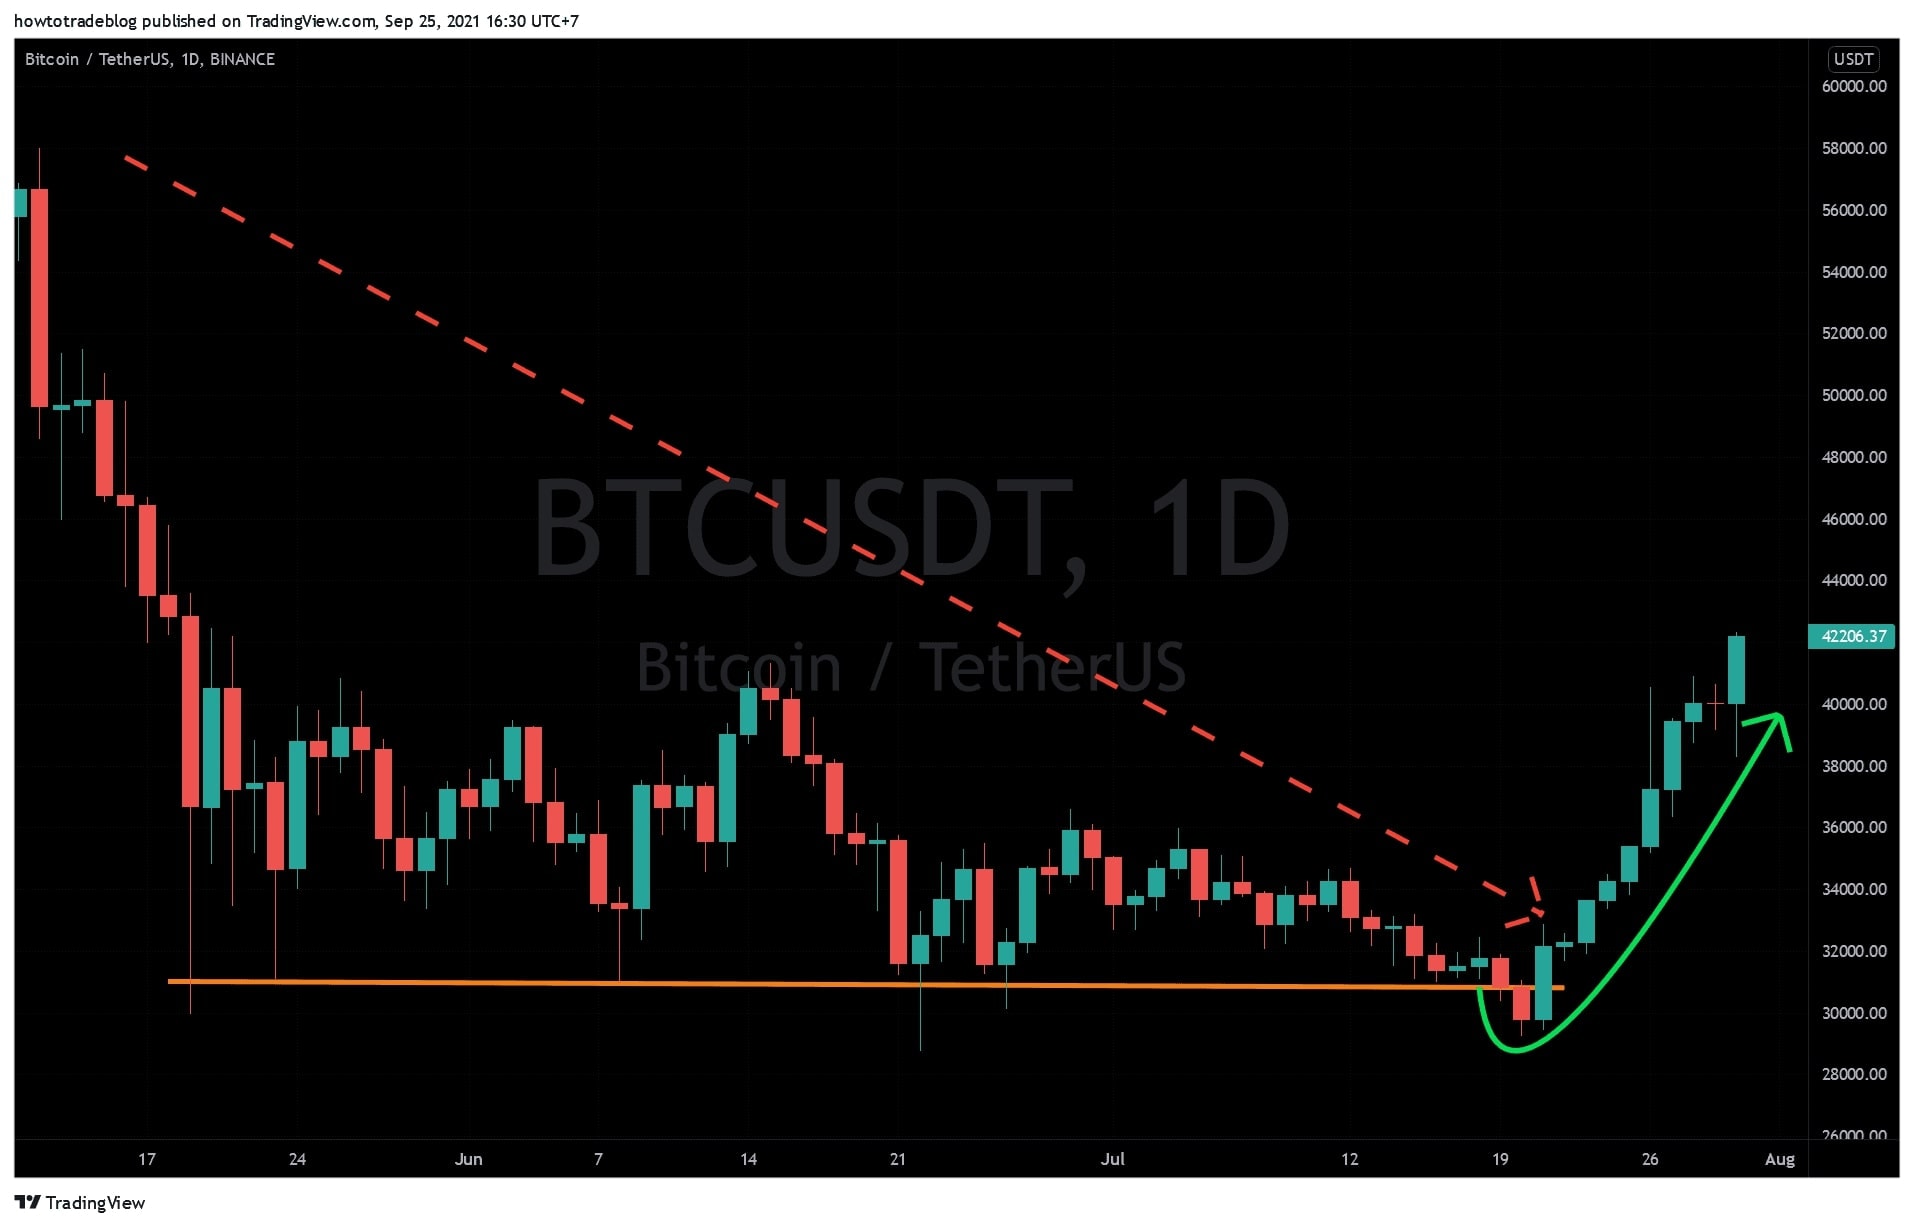
Position 4: Breakout Sell

Simply put: The market has entered a downtrend. The price continues to break the support level and go down. Breakout SELL is chasing the market in this case.

Looks like my Academy account has never traded this type of position. To put it bluntly, my personality doesn’t like chasing the market. If today I can’t sell, I can do it tomorrow. If tomorrow is not a good day, no problem. Just wait for next week.

Breakout Sell
Breakout Sell

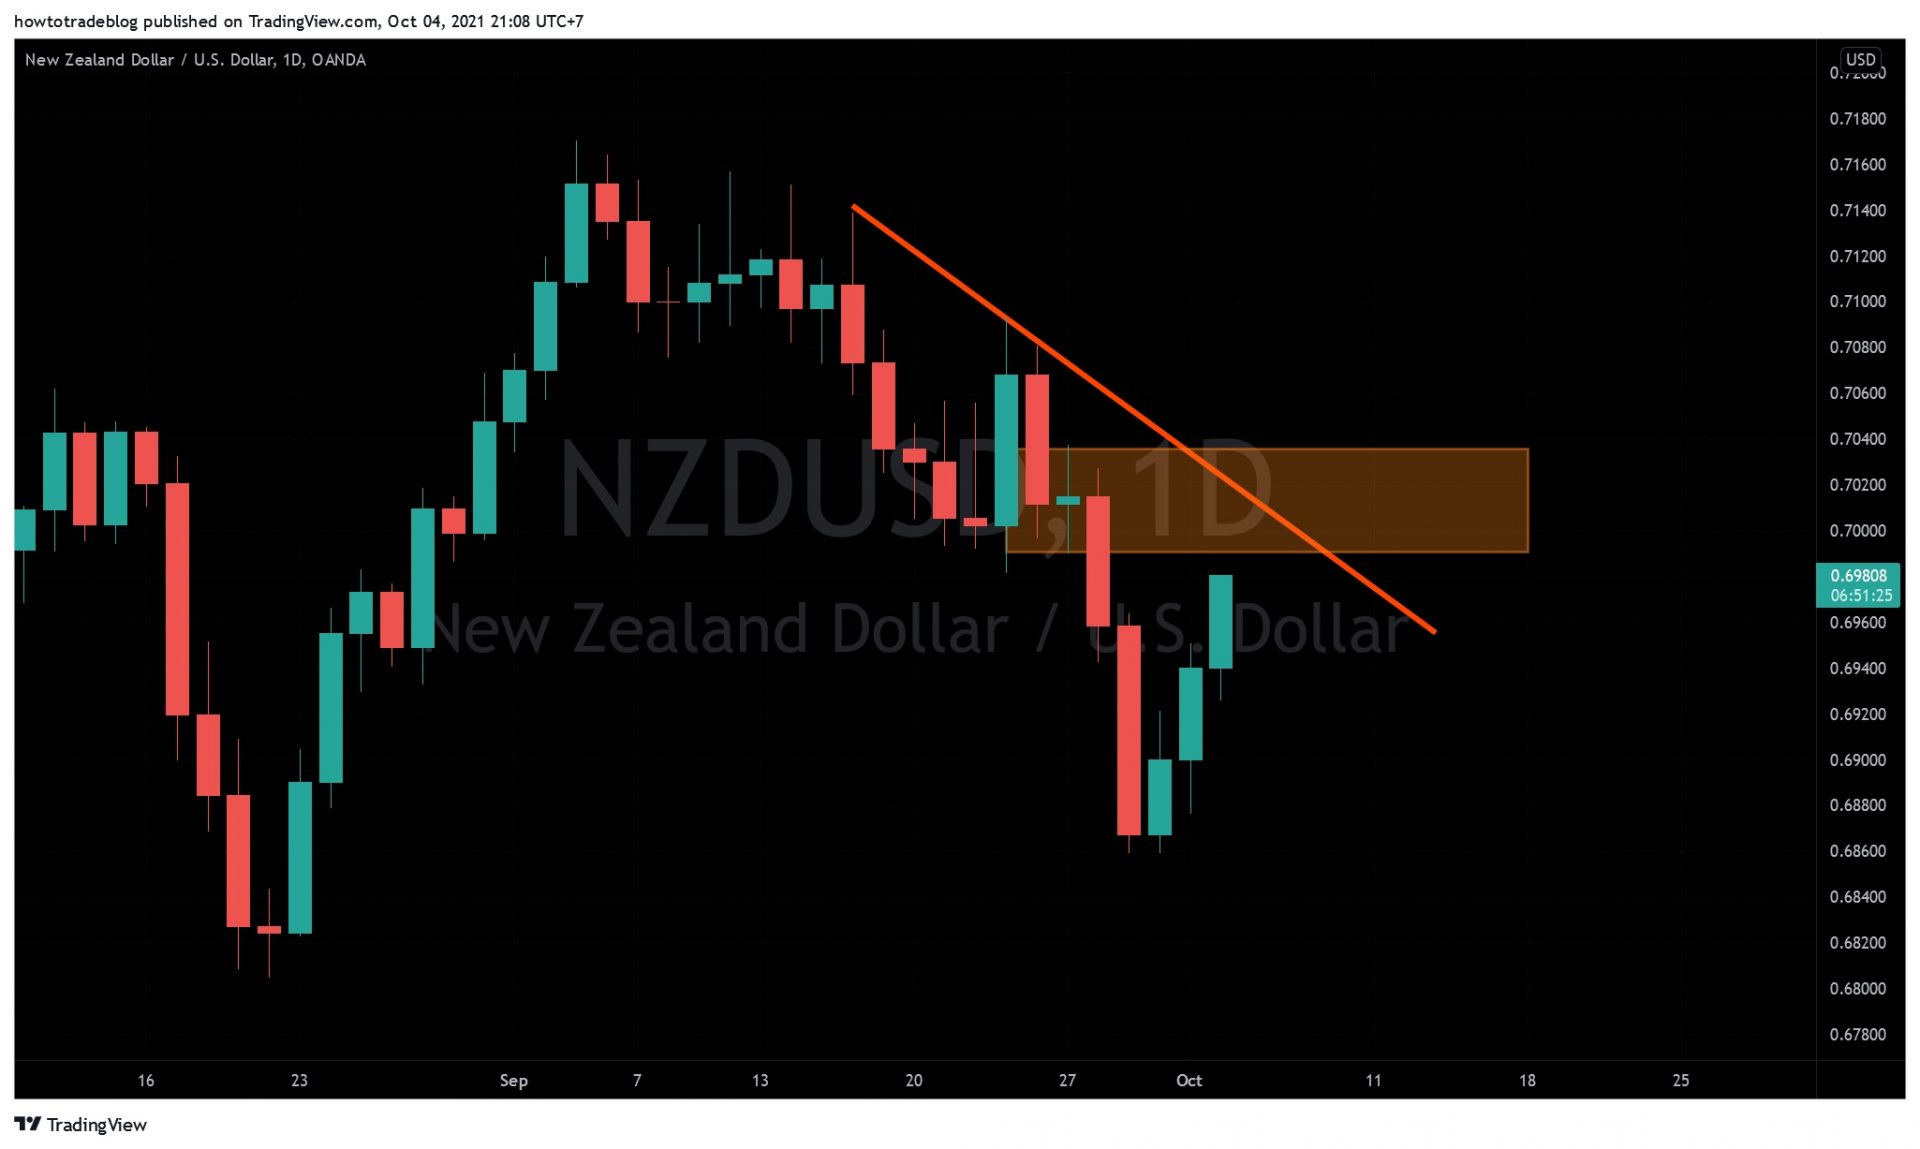
Position 5: Sell at the top

Meaning: I predict the price will reverse (from bullish to bearish) and break out of the support zone and go down. NZD/USD – this shot is considered a lucky top catch. Of course, it can be explained by the distribution zone, overbought zone, candlestick signal, etc. But it is just luck after all.

Sell at the top of NZD/USD

Experience: Most of the top and bottom catchers I know are armless. Don’t do that often!

So I’ve already gone through all the SELL positions. Everything is very simple, easy to grasp and practice. Now is the hard part, candles and how to set Stop Loss properly.

Signal candle

Candles only have meaning when they appear at a confluence zone. For the rest, don’t worry about it.

Signal candle
Signal candle

There are 3 candlestick patterns that I really like.

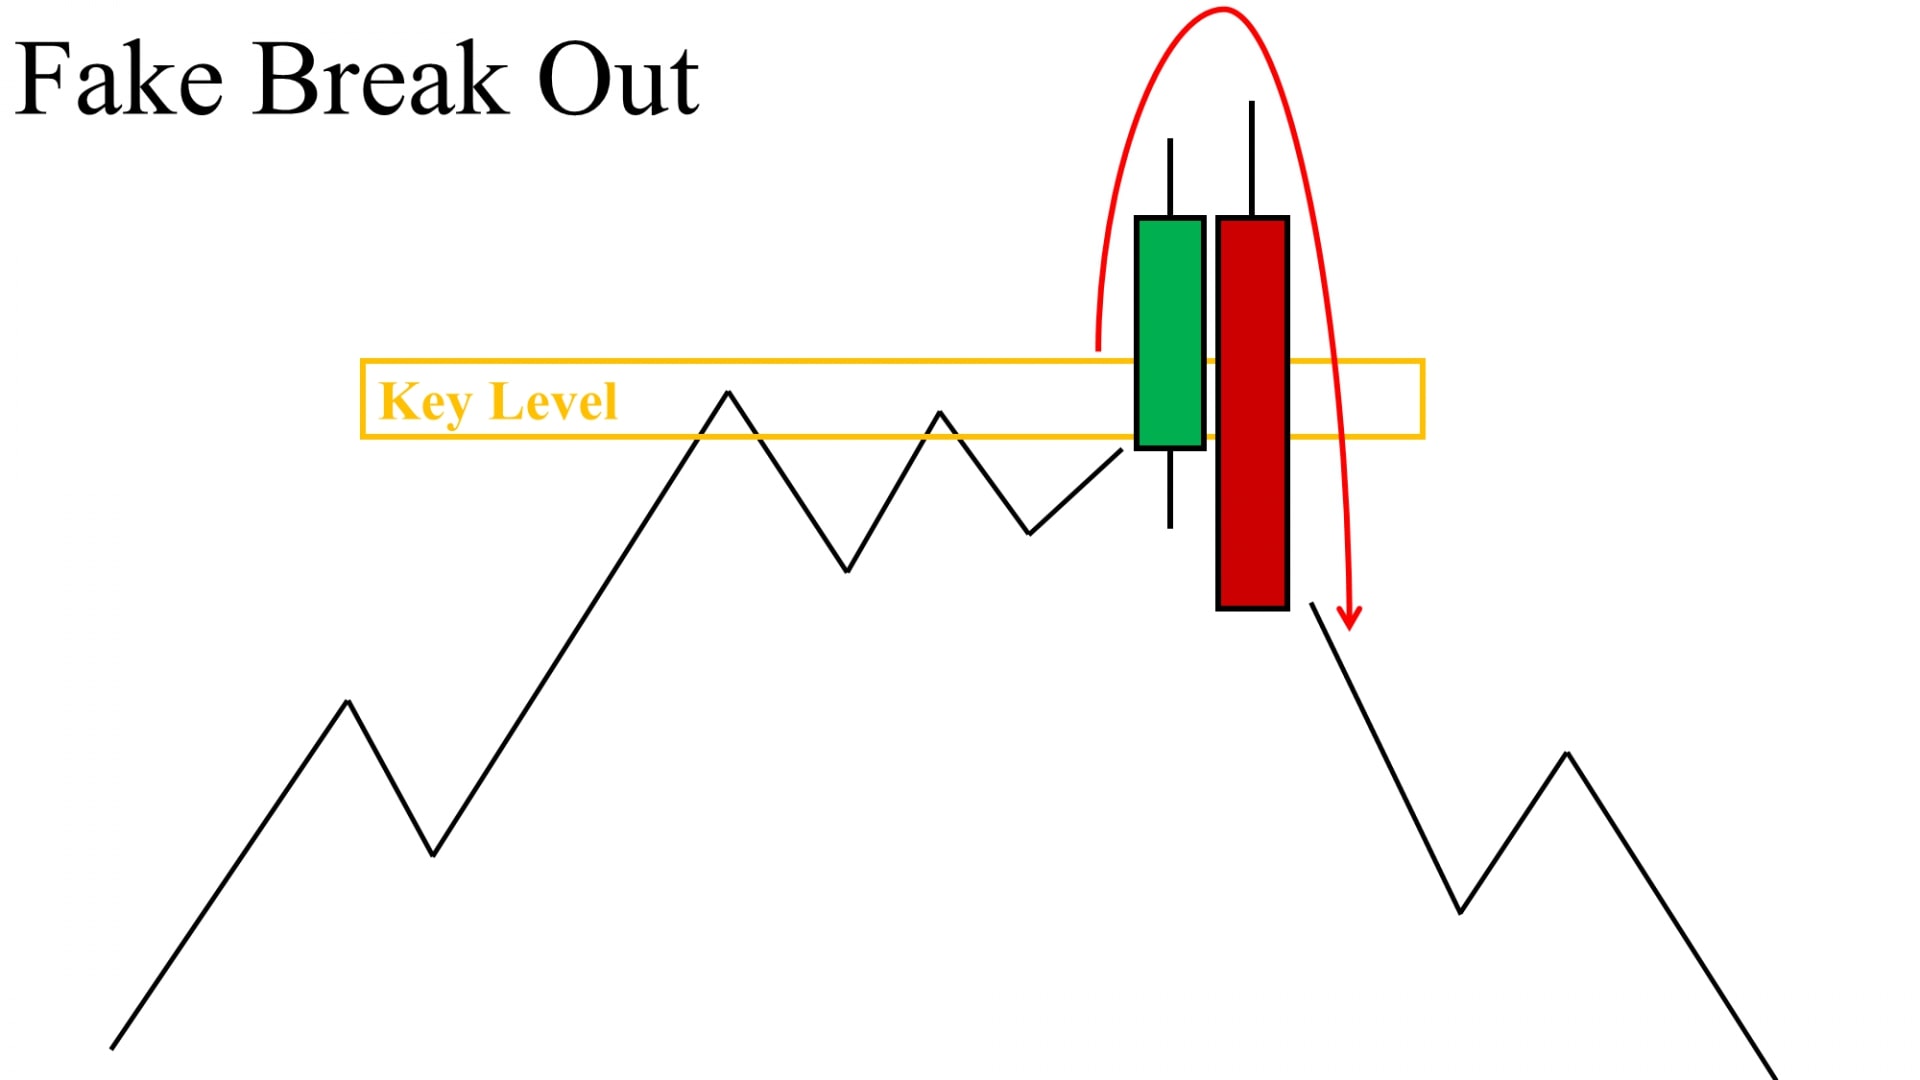
(i) Bear candle – take a close look at this article: Fakey candles and tricks.

It appears at the levels and creates Fakey – False breakout (pull the upper wick long then plummet really hard). This feature belongs to the specialty of Gold and GBP/USD – pops up to hunt and sweep the stop losses of sellers, pulls the buyers in and then reverses sharply. Finally, gently RIP both sides – Extremely prestigious!

Bear candle
Bear candle

(ii) A set of strong bearish candles (Double pattern) – Professionals call it EG (Engulfing). This set of candles is only reliable when candle (1) is small and candle (2) is a strong bearish one.

The market story is when the price enters the level (disputed area), the BUY and the SELL side will continuously act. So the movement of the candle (1) will be smaller. DANG! The SELL side wins and the price collapses sharply, creating a strong bearish candle (2).

Bearish Engulfing pattern

(iii) Bearish Pin Bar

Candlestick pattern with the head pointing down and the foot pointing up. In terms of “delicious”, it is not equal to the two candles above.

Bearish Pin Bar candlestick

How to set Stop Loss

(i) Active SL

My SL level is usually: Never lose a trade more than $400 with a capital of $18,000 (~2.2%/order).

Setting an Active Stop Loss means: When I enter a Gold order of 0.5 lots I will place an SL maximum of about 80 pips. Other currency pairs I will enter 0.8 lot/order => SL max 50 pips.

Active SL
Active SL

Link to calculate lots on orders: https://howtotradeblog.com/lot-size-calculator/

(ii) Place SL above the master candle

If you SELL actively, it means there are full signal candles. So SL just needs to be placed above the master candle and that’s OK. For example, USD/CHF, previous master bearish candle, strong force => Place SL above that candle.

Place SL above the master candle

Experience: You can place SL anywhere you want. Far or near SL is both fine. But if you don’t have SL, don’t read anymore. Because the more you read, the more you lose.

Winning and losing are common things in this market. But to lose everything, you are exactly an idiot. If that’s the case, don’t waste time in this market to save your money.

Summary

If you are a beginner, you should only practice 1 type of position. Focus on some currency pairs, eat and sleep with them and wait for the SELL position. If it’s wrong, you have SL. If it’s right, use partial profit-taking. Do it over and over again to become a master.

The point of trading is survival – Do whatever it takes to survive. The orders in my Academy account may not win much, but it is absolutely not allowed to lose a lot thanks to SL.

Finally, let me say again. Trading is a game of probability. And the methods above, too, are probabilities, not the holy grail. Capital management is the guideline and truth in this market.

Ok! The following article will be about BUY positions. Quickly end the Price Action series so we can go back to Wycoff to learn more safe skills.

Register an Exness account NowGet $1,000 Free for beginners

The post Price Action: 5 Best SELL Positions (Part 10) appeared first on How To Trade Blog.


source https://howtotradeblog.com/best-sell-positions-price-action/

Wednesday, April 27, 2022

Price Action: Fibonacci Retracement (Part 9)

One of the skills that I still use often in the process of analysis and planning is Fibonacci Retracement. In this article, I will only focus on my experience and use of Fibonacci with Gold, not talking about numerical sequences or the magic of Fibonacci.

Repeat: You are reading my Price Action series, sharing my trading style and experience. You can read the entire series here: PRICE ACTION SERIES.

Register an Exness account NowGet $1,000 Free for beginners

How to use Fibonacci retracement

For me, Fibonacci (Fibo) only has 5 key milestones including 0 – 0.382 – 0.5 – 0.618 – 1. In which 0.5 will be the center, where the price is balanced. I also don’t care if I should draw from 0 => 1 or 1 => 0 because everything is symmetric about the 0.5 line. So whether you draw the Fibonacci retracement from the top down or the bottom up, it’s still the same.

How to use Fibonacci retracement

Why is it called Fibo retracement? Because the market never goes straight in 1 way. Any uptrend or downtrend needs to have retracements. And I use Fibo retracement to make trading plans at these pullbacks.

Fibonacci retracement with GOLD

As for gold, I will divide it into Downtrend and Uptrend. Because there is a slight difference, it should be divided to use.

Draw Fibo with Gold in a downtrend

Use the H4 candlestick chart (Tradingview) and draw Fibo Retracement as follows.

(A) Starting point: The opening price of the first red candle starts a downtrend. Not the highest price!!!!!

(B) Pull down right through at the lowest price of this bearish wave.

Drawing Fibo with Gold in a downtrend

So the 3 price zones you need to pay attention to prepare for a SELL order will be:

– 1815 corresponds to the 0.382 zone.

– 1825 corresponds to the 0.5 zone.

– and 1837 corresponds to the 0.618 zone.

Why do I draw Fibo like that?

(i) With gold, I will draw Fibo on the H4 candlestick chart and the starting point will be the opening price of the first candle that started the bearish wave. Not the highest price. Because this is my experience.

(ii) Why drag to the area (B). Since here, the price made 2 bottoms so it is possible to create a bounce.

(iii) Why do you choose the opening price of the candle as the starting point of Fibo while the lowest price as the ending point? As my experience indicates so.

And here is the result. Gold price recovered to the 0.382 Fibo zone then continued to fall again.

Gold price returned to Fibo 0.382

Ok! Let’s take 1 more example. I will draw one more time and you can check the rest on Tradingview yourself.

(1) The price fell and broke out of the previous Key Level => the market formed a downtrend.

(2) Draw the Fibo starting from the opening price of the first red candle in this bearish wave.

(3) Drag the Fibo to the lowest point of the wave.

Draw Fibonacci retracement in a bearish wave

After that, we have 3 zones to wait for SELL orders:

– 1807 corresponds to Fibo 0.382

– 1815 corresponds to Fibo 0.5

– 1823 corresponds to Fibo 0.618

Result: The price reacted at Fibo 0.382 and Fibo 0.5

The price retraced to the Fibo zone then fell again

Draw Fibo with Gold in an uptrend

Why is there a difference between Uptrend and Downtrend when drawing Fibonacci?

Answer: Gold’s downtrend is usually a full-power drop. So traders can lose all of their money before there are pullbacks.

On the contrary, in an uptrend, gold is well more educated. It increases then pulls back to run the stop loss of traders then continues to rise… That’s why I will use Fibo retracement to predict the pullback zone.

It’s still the H4 candlestick chart on Tradingview. Draw a Fibonacci retracement in the bullish wave.

Draw Fibo retracement in an uptrend

(A) Starting point: The closing price of the candle that started the bullish wave.

(B) Drag to the highest price of this wave. The retracement price zones to note will be:

– 1836 at Fibo 0.382

– 1824 at Fibo 0.5

– and 1811 at Fibo 0.618

And the result: The price fell and returned to the 0.5 Fibo zone, then bounced back.

Result
Result

In the next bullish wave, I will do as above. Starting from the trigger candle for this bullish wave, drag the Fibo to the highest price (highest high).

In an uptrend, I will draw Fibo with each bullish wave

Just like that, we can repeat every bullish wave to get the price retracement zones.

Draw Fibo each wave in the bull market

In short, in a bull market, use the Fibonacci retracement on each bullish wave to wait for BUY in the zones of 0.382 – 0.5 – 0.618. There is no need to chase the market or “Fomo” because the bull will have resting time while running. It always steps back to gain momentum to continue running again.

Personal experience

In terms of “disobedience”, surely no asset has passed gold. Gold moves slowly when going up but it fluctuates and hunts SL continuously. As for going down, gold’s very fast. Sometimes it only takes 1 night to destroy all the previous increasing processes. Therefore, using Fibo retracement also needs to be flexible.

What about the entry point? Of course, Fibo is a tool for forecasting and planning. To enter the order, it is necessary to combine the key level + candlestick signal. I’ll leave this subject for the next articles.

I will continue with 2 topics in the upcoming article. They are Fibo 50 – the balanced zone and sharing about Fibo retracement for currency pairs.

The article is already long so I take a stop here. You should use the above knowledge to draw and backtest on Tradingview. It will help you a lot.

Register an Exness account NowGet $1,000 Free for beginners

The post Price Action: Fibonacci Retracement (Part 9) appeared first on How To Trade Blog.


source https://howtotradeblog.com/fibonacci-retracement-price-action/

Monday, April 25, 2022

Price Action: How To Make a Trading Plan (Part 8)

This is another important post but I’ll leave it up to part 8 in this series. And most likely, with the title “trading plan”, this article will not have many views.

Commitment: clear images, understand after reading. You can make a trading plan yourself every day.

Ok! Let’s go to this article, a long one with lots of pictures.

Register an Exness account NowGet $1,000 Free for beginners

Use Tradingview to make a watchlist

Each person has 1 platform or software to view trading charts. Tradingview is my choice. It’s friendly and easy to use with lots of tools to draw.

My approach will be to browse all currency pairs + USOil + Gold… for analysis.

Repeat: It’s analysis and planning, not predicting. Because if you try to predict whether the market will go up or down, you will keep that mindset in your head stubbornly. When the price movement is opposite to your prediction, you will likely lose all your capital.

Analysis time: 15 minutes for all (average 30s for 1 chart).

How to make a trading plan

I go step by step. It’s actually very fast if you’re used to it.

Style reminder: Use the daily chart to identify trends. Focus on the H4 candles to find breakout points (true breakout or false breakout) to enter trades.

XAU/USD – my top favorite pair

The market is moving sideways with a wide margin. Reason: The current high is equal to the previous one – (A) = (B). The current low is equal to the previous one too – (1) = (2).

Analysis of the XAU/USD

But, Gold is stuck in a downtrend line of the current wave. Prioritize SELL.

(1) Plan 1: If the price dropped sharply and the candle closed definitively below the 172x zone => SELL to chase.

Gold trading plan 1
Gold trading plan 1

(2) Plan 2: Sell at a downtrend with the H4 chart. Do you remember the theory for us to enter a SELL order? It’s the bearish confirmation candle.

Gold trading plan 2
Gold trading plan 2

Reminder: The market does not follow the shape of a Christmas tree or the Eiffel Tower. Before the fall, the price always generates enough signals for you to enter a SELL order. See details here: Confirmation candle in Downtrend: SELL order (Chapter 6)

What about BUY? No, it’s not in the plan with this chart.

DXY – USD Index

You should look at the USD once a day and judge it. Since this is a strong currency, it affects most of the remaining currency pairs.

DXY is in an uptrend and is showing signs of a downward correction. Zones (A), (B) and (C) are how DXY creates a trough to end previous corrections. Likely, the next one will be the same.

Plan: Wait for the price to stop falling and create candlestick patterns similar to (A), (B) and (C) zones. Wait to BUY.

DXY – USD Index
DXY – USD Index

USD/CAD – a trading opportunity

The price falls sharply and breaks out of the downtrend and the key level zone. Enter a SELL order with the amount half of the plan. If the price retests, enter the remaining 1/2.

USD/CAD - a trading opportunity
USD/CAD – a trading opportunity

+ Stop Loss: 1.2660

+ Take Profit: 1.2300

=> Rate 2.7R

GBP/USD – Wait to SELL

GU is in a bearish phase after breaking down the important Key Level. And now, the price is retesting.

Put it on the watchlist. If the bearish confirmation candle appears on the 4h Chart, immediately enter a SELL order.

GBP/USD – Wait to sell

EUR/USD – no trading opportunities

For pairs that don’t have a trading opportunity, ignore it. Let’s review it the next day. If the price enters the confluence of the Key level and the downtrend, then we will consider it later.

EUR/USD - no trading opportunities
EUR/USD – no trading opportunities

NZD/USD – no trading opportunities

Wait more.

NZD/USD - no trading opportunities
NZD/USD – no trading opportunities

USD/CHF – Waiting for confirmation

There’s nothing with this chart either. It takes time to see when the price enters the Key Level zone.

USD/CHF - Waiting for confirmation
USD/CHF – Waiting for confirmation

AUD/USD – Wait for a reaction to SELL

AUD/USD - Wait for a reaction to SELL
AUD/USD – Wait for a reaction to SELL

USD/JPY – Waiting for the reaction at the Key Level

USD/JPY – Waiting for the reaction at the Key Level

USOil – a trading opportunity

Habit of Oil: Every time it crosses the top, the price usually accumulates to go sideways at the top zone or breaks out and then retests. You do not need to rush to enter the order because it could be a Fakey pattern.

Put in the watchlist for review.

USOil - a trading opportunity
USOil – a trading opportunity

EUR/JPY

After a decrease, the price is now entering the sideways period. The price has not yet entered the zones we are interested in. Skip.

EUR/JPY
EUR/JPY

EUR/AUD – a trading opportunity

The price is entering the confluence of Key Level and the uptrend, forming a balanced Doji pattern. Wait for confirmation candlestick patterns for each scenario.

If it drops sharply, the uptrend will be broken. Enter a SELL order because it is likely to be a sharp and deep drop. Prioritize this plan.

EUR/AUD – a trading opportunity

Summary

What do you see after 12 charts? Very fast, right? You don’t need to focus too much on currency pairs that don’t have a chance.

Remember: We only trade when the probability of winning is so high that both you and I are willing to trade with our own money. Therefore, if the opportunity is not delicious enough, let it go.

Every morning, you just need to surf all the currency pairs (daily chart). Then make a watchlist of about 3 to 5 pairs to track the day’s happenings with the H4 chart. So, everything is in your plan. You know what you’re going to do, how much you’ll lose if you’re wrong, and how much you’ll win if you’re right.

Register an Exness account NowGet $1,000 Free for beginners

The story of a predator

For those who do not know, Hitman is the top sniper in the Hollywood world.

Hitman’s job is a one-shot head hunter. One of the best images that I have always wanted to learn to apply in trading. And here’s how the killer works.

After closing the order (prey), Hitman spends consecutive days observing his prey. Patiently record the behavior, personality, habits, and even the bodyguards next to the prey. After that, he makes a detailed plan to “hunt” – location, time, method, etc, and a way to escape. Everything is scripted in great detail.

The story of a predator

The right time has come. He begins to “take action”. At that location, he calmly waits for his prey to come into view, feeling the direction of the wind. Gently open the safety pin and take a deep breath, and put his hand on the trigger. Dang! 1 single bullet, get up and leave. No traces, no emotions and no mistakes allowed.

That’s it! Those who are trained for the only job of headhunting also need to have a plan, a script to act. When the probability of taking down the prey is not high, the assassin will never “get to work”. He understands that as long as he is impatient or makes a single mistake from a predator he will turn into prey immediately.

The post Price Action: How To Make a Trading Plan (Part 8) appeared first on How To Trade Blog.


source https://howtotradeblog.com/make-a-trading-plan/

Saturday, April 23, 2022

Price Action: Fakey Confirmation Candlestick Pattern (Part 7)

On July 20, 2021, for the first time in months, BTC closed below 30,000 USD/BTC. The crowd began to plot a sharp drop. Reason: Unlike the previous times, when BTC hit 30k, it would bounce back strongly (creating Pin Bar candles). But this time, when the price dropped to the 30k zone, the market did not rise again like before.

Bitcoin price closed below $30,000

On July 21, 2021, Dang!!! “1 trick” from BTC. The market created a Fakey candlestick pattern. Then the price of BTC bounced up sharply, slowly going up in the surprise of both sides.

BTC created a Fakey candlestick pattern

For this article, I will talk about Fakey in my opinion. Please re-read the entire series here: Price Action series.

Register an Exness account NowGet $1,000 Free for beginners

What is the Fakey candlestick pattern?

Many men are like Fakey is a candlestick pattern that combines Inside Bar, Mother Bar, Pin Bar this and that…

You just need to remember simply like this. Fakey = fake + key level.

Meaning: The market makes a Fake (false) Breakout at the Key Level. Remember, Fakey’s issue is its location.

What is a Fakey candlestick pattern?

Take a look at the example above. When Bitcoin created a bearish Fakey, the BUY side could panic and cut their losses. On the contrary, the SELL side had finished setting up the SELL order. In the end, both sides lost money and the market reversed and went up.

P/s 1: Don’t argue with me that it is a candlestick pattern like this or that. Again, this is a series written according to my knowledge and experience, my own.

P/s 2: Today we only learn to recognize. The next article is about how to enter orders, how to set SL/TP.

Fakey candlestick patterns

I will give 2 patterns including single candle and double candle.

Pattern 1: Single candle

I named this pattern Retracement candlestick. It also belongs to the system.

(1) Retracement candlestick – Bearish Fakey

Identification: It is a red candle with a long wick pointing up and the body pointing down.

Theory: After opening, the price rises sharply and breaks out at Key Levels. But then, it reverses to fall significantly.

Bearish Fakey candle

Practice: These are such candles – Gold in H4 candlestick chart.

Gold creates a bearish Fakey candle
Gold creates several bearish Fakeys in the H4 chart

Experience:

– Before the market plummets, it usually create candles like these. The purpose is to swept the SL of the traders who are entering SELL pending orders and pull the traders waiting outside to enter the BUY order. Then it kills both sides.

– Candles like this are easy to make traders bitter. Me too, although I can identify, I don’t dare to enter the order.

– Special attention: Gold, BTC, US30, GBP/USD… These assets have extremely volatile fluctuations.

(2) Bullish retracement candle – Bullish Fakey

For me, the bullish retracement candlestick that creates a bullish Fakey is not as reliable as the bearish one. So I just write a few about it.

Identification: green candle, long wick pointing down and real body pointing up.

Bullish Fakey pattern

Practice: After opening, the price falls sharply then it reverses to rise.

Gold creates a bullish Fakey pattern

Pattern 2: Double candle

This is a 2-candlestick pattern including:

Candle 1 breaking out from Key Level is beautiful and standard.

Candle 2 is an extremely strong reversal. It must be very strong.

Now we will go into each case in detail.

(1) Bearish Fakey Pattern

Candle 1: a green candle increases and breaks out.

Candle 2: an extremely strong red bearish candle. It must be a stronger bearish candle than the previous green bullish candle.

Bearish Fakey pattern

Practice: One of the lessons I paid well for Gold. The market created a set of Fakey candlesticks, then dropped over $100 (1000 pips) within 2 days.

Gold creates a bearish Fakey candlestick pattern

Experience:

– This is one of Gold’s Big Short positions (please remember carefully).

– In this market, every time it appears, you will often see this formula. Fakey = Fake = Fuck. It entails many trader’s psychological problems. We will discuss this in the next article.

(2) Bullish Fakey Pattern

Similarly 😀. You can self-study and backtest on Tradingview.

Bullish Fakey candlestick pattern

Summary

You will probably see these candlestick patterns as Engulfing. It doesn’t matter. What I want you to understand is Fakey = Fake + Key Level. Understand it as a Fake Break Out then reverse. Don’t be too concerned with the candle or its color. Care about the position.

The main market is like that. Delicacies are never for the masses. Therefore, the price will often create “phantom” candles to deceive traders.

Again: Pay more attention to Bearish Fakeys (create a bullish signal but then reverse bearish). Because these drops will often be sharp and deep… And you can even hit big thanks to Big Short.

Ok! To be continued….

Register an Exness account NowGet $1,000 Free for beginners

The post Price Action: Fakey Confirmation Candlestick Pattern (Part 7) appeared first on How To Trade Blog.


source https://howtotradeblog.com/fakey-confirmation-candlestick-pattern/

Wednesday, April 20, 2022

Confirmation Candle In The Downtrend: SELL Order (Part 6)

Why do people call a downtrend a bear market? Let’s look at how the bear attacks.

First, the bear runs straight ahead. Unlike tigers, lions or wolves, bears do not rush straight in. When approaching, he stands up then pounces strongly and bites the prey. When the prey is in the mouth, the bear begins to tear the flesh of the prey, letting it slowly bleed and die in pain.

And here is a segment of the bear market:

A segment of a bear market

(1) The bear has identified its prey, rushes forward and stands up.

(2) Pounce strongly.

(3) Torment the prey until it dies.

What does Dow Theory say? While the bull runs up, it will stop, pick up momentum and run again. But the bear is different. It does not need momentum. It rushes and stands up, using its body to pounce on its prey. This is why prices will usually go up slowly (like walking up the stairs) but when they fall very quickly (like going down in an elevator).

A bull market goes up slowly while a bear market falls fast

Hehe! Just rambling a bit. Now we’re going to get into some sort of bearish pattern, confirmation candle and sell order.

Two ways to trade in a downtrend

Please read this article once again: What Is A Downtrend In Forex? How To Trade Forex With A Downtrend.

(1) Breakdown

When the price falls, it usually falls vertically. Therefore, you need to be decisive as soon as there is a candle confirming Breakdown.

(2) Bounces

Like a ping-pong ball falling, when it hits the ground, the ball will bounce, then continue to fall. The same goes for the bear market. After a sharp drop, it will be the process of bouncing up and down. Watch for SELL on bounces.

Confirmation candle in the downtrend

Features: Red candle, long body, closing price close to or equal to the lowest price. In technical analysis, this candlestick pattern is called Bearish Marubozu.

Bearish Marubozu pattern

1st position: Breakdown

The word “down” is understood as when the price breaks out of this zone, the market will enter a downtrend.

Theory: At the end of an uptrend, the market starts moving sideways (Distribution). Boom! The price drops sharply and the market crashes very hard. It starts with a bearish confirmation candle, breaking down from the distribution area.

Breakdown confirmation candle

Distribution is a process and the market rarely follows a pyramid pattern (strong up and strong down). In most distributions, you can always draw a Key Level or a clear support level. The Breakdown candle needs to pierce straight through and close definitely below this level.

Practice:

Gold confirmation candle in a downtrend

Special note: When the market enters a downtrend, there will be extremely strong declines, penetrating all the Key Levels that you can draw before. Therefore, you will easily have the psychology of wanting to buy and it is very easy to enter a buy order. This is the beauty of the Bear market. The more you buy, the more money you lose.

2nd position: Bounces

Theory: The pullback in a downtrend is often an opportunity for you to continue selling. For me, the signal is still a candle confirming the pullback is over and the price will continue to fall again.

Bounces in a downtrend

Price retracement will come after sharp declines. The market at times like this is easy for SELL orders. Just the profit won’t be as great as when you catch the Breakdown.

Practice:

Gold's bounces in a downtrend
Gold’s bounces in a downtrend

Note: It is very rare for the market to drop sharply and then increase sharply again. Usually, it will be a bounce scenario to continue falling or accumulate again, creating momentum to go up. Even in this case, the SELL order is still the safest.

Personal experience

When the bear attacks, it will stand up and then pounce on its prey. The market is also the same before the downtrend. There will be some retracement and crashes.

Wait for the confirmation candle. The stronger the bearish candle, the more prestigious it is. Because when the price drops sharply, it will spread the crowd psychology, selling off the whole market.

Sometimes you just need to catch 1 Big Short (long drop). It is more than enough. And if trading is too difficult, just trade in one way – SELL.

Reason: The bull running up will need to rest to gain momentum. Or in other words, in an uptrend, there are still retracements for you to sell. In a downtrend, if you catch a SELL, sometimes you will get a Big Short.

Register an Exness account NowGet $1,000 Free for beginners

Trading examples with confirmation candle

SELL Gold (XAU/USD) order.

In the daily chart, gold is still in a downtrend (it hasn’t created a new high higher than the old one).

Gold's daily chart
Gold’s daily chart

In the H4, the confirmation candle closes below 1780 => Enter a SELL order.

– Place Stop Loss above the confirmation candle (140 pips).

– Take Profit at the Supply Demand zone below.

Enter a SELL Gold order

SELL EUR/USD order.

In the daily chart, EUR/USD is still in a downtrend, and it is returning to the Key Level.

EUR/USD daily chart
EUR/USD daily chart

In the H4, the confirmation candle appears and the previous key level is broken => Enter a SELL order.

– Place the Stop Loss above the confirmation candle (40 pips).

– Take Profit in the Key Level below. This order has the ratio R:R = 1:1.8.

SELL EUR/USD order
SELL EUR/USD order

We will have an article on the trading log to summarize all the orders in this $15,000 account. Let’s see after the whole process of learning and practicing whether we make a profit or a loss.

Summary

I repeat that the beauty of a downtrend is to make traders want to BUY rather than SELL. Maybe because traders have been waiting to BUY in the Key Level below. Maybe they find the price cheaper, etc. But for whatever reason, the truth is that most people lose money on sharp drops.

For example, in the Crypto market, in an uptrend, everything increases – every coin increases – even shitcoins also rise. But usually, people will lose everything in a downtrend. No matter how much money they make, they will return all to the market.

Remember: In an uptrend, people use BUY and Hold. But in a downtrend, they use Big Short. Hope you understand what I’m trying to say.

Apart from this blog, all my articles are also posted on a telegram channel. You can read them here: JQKA Academy.

Register an Exness account NowGet $1,000 Free for beginners

The post Confirmation Candle In The Downtrend: SELL Order (Part 6) appeared first on How To Trade Blog.


source https://howtotradeblog.com/confirmation-candle-sell-order/