This is the foundation of technical analysis, the foundation of all markets – Dow Theory. Before you enter the series of learning and practicing Price Action, you must understand the nature of the market and the psychology of trading. That’s why I have to write this article.
Commitment: This is going to be a long post but your time spent on it won’t be wasted. I will use the Gold and Crypto markets to describe this theory.
Through this article, I will prove that Dow Theory is not just a theory. It has existed for hundreds of years and it is true for all markets.
What is Dow Theory? And its 6 main tenets
Dow Theory is a series of theories expressing Mr. Charles H.Dow’s beliefs about how the stock market works.
Later, many experts in the financial field also recognized this theory as a standard for all markets. Therefore, they took his name to name the largest stock index in the US – Dow Jones.
Let’s read through these 6 tenets once. Then I will go into each of them to explain for you to fully understand each issue.
1st Tenet: The price discounts everything.
2nd Tenet: Primary and secondary trends.
3rd Tenet: 2 primary trends and 3 phases of the market.
4th Tenet: Averages must confirm each other.
5th Tenet: The price must be accompanied by volume.
6th Tenet: The main trend is maintained until there are clear signs of reversal.
For convenience, I will present the following order – (1), (3), (2), (4), (5), (6). In this way, it will be easier for you to understand.
I will also take the example of the Gold market (XAU/USD) for tenets (1), (2) and (3). But from tenets (4) and (5), I will move on to talk about the Crypto market.
Tenet 1: The price discounts everything
The information you know from psychology, data on inflation, interest rates to wars, epidemics, etc, all have been reflected in the price.

This is the first tenet for you to accept the Dow theory. Once we have used technical analysis, the only thing we will focus on is price. The market tells its own story through the price. The factors that have been and are or will even happen are already in the price.
Tenet 3: 2 primary trends and 3 phases
Do not confuse with 3 trends bullish, bearish and sideways. According to Dow Theory, there are 3 movements of the market including primary trend, secondary trend and daily fluctuation. But in this price action series, we only mention 2 primary trends. They are bullish (Uptrend) and bearish (Downtrend).
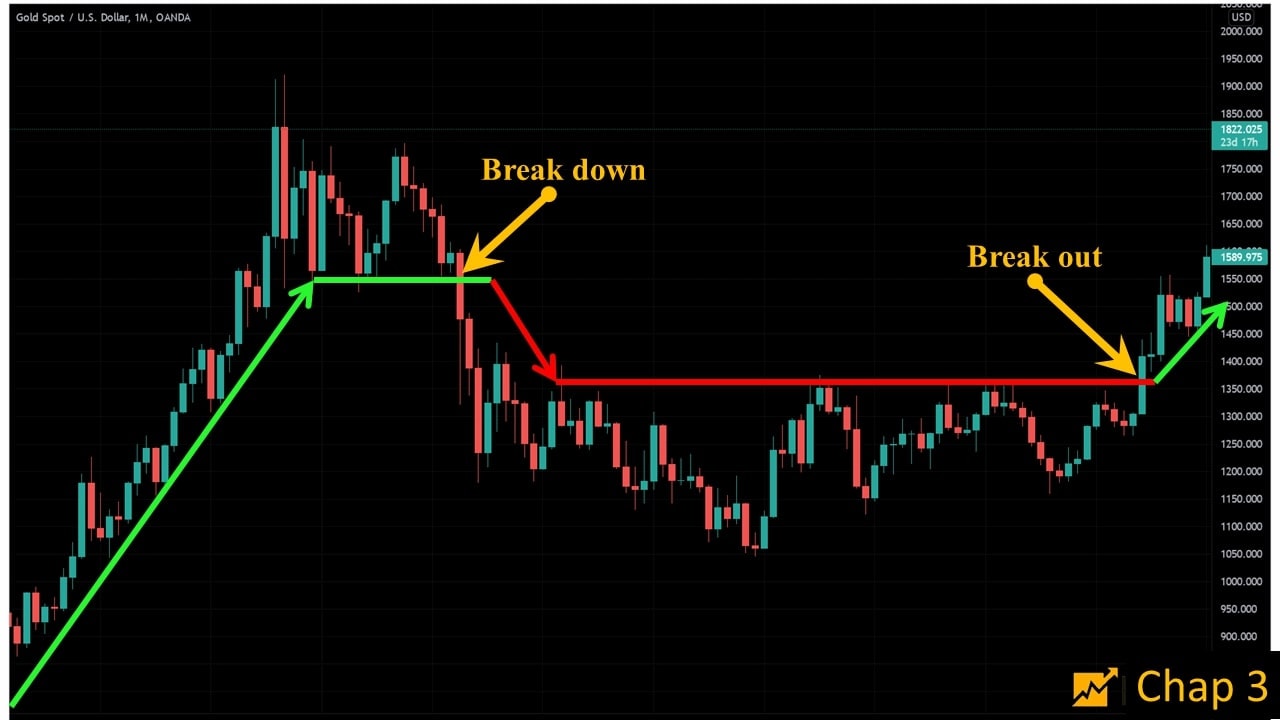
Look at Gold’s monthly chart and imagine this.

(A) There is a certain force that controls the market, which I call the brokers. First, they push down the price to buy gold at a cheap price. Therefore, at this phase, the price will move sideways for a certain period.
(B) After buying enough gold, the brokers pull the price up continuously.
(C) Start distribution to all investors (including me and you) to realize profits.
(D) After the distribution process, the brokers push the price down again. Organizations and individuals will cut their losses, run away, and sell gold all at a cheap price.

(A) In the end, the brokers proceed to buy again and start a new cycle. Then everything goes back to the way it is.
Ok! Now we will go deeper.
Uptrend (Bull market)
In this trend, the market has 3 main phases including accumulation, explosion and transition.

(1) Accumulation phase
This is the beginning of a new market cycle.
After the sharp drop, all the worst news was out. Everyone sold out and the market entered the accumulation phase.
Sign: The price moves sideways within a certain range.

This is the most difficult phase to recognize because investors all felt fear, apprehension and a little doubt at the end of the downtrend of the previous cycle. So they almost stand out during this phase. Meanwhile, the media and news also are not interested in the market.
(2) Explosion phase
Boom! Something big explodes (Of course in the brokers’ calculations).
Sign: A breakout candlestick appears on the chart, exiting the accumulation phase. The price starts to rise continuously.

Features: This is the easiest money-making phase of the market. What you need to do is to buy, partial profit-taking, hold. You can find new entry points to repeat this process several times during this phase. However, if you try to surf, buy and sell uncontrollably, you will lose money without a doubt.
The good news such as injections, wars, pandemics, etc, are released every day. All eyes are on gold and money flows to gold.
(3) Transition phase
I usually call this the sprint phase. The price pulls quickly and strongly to the “finish line” – a specific target level in the brokers’ pre-calculated scenario.
Sign: The price increases rapidly and strongly. In phase 2, the price will increase in the pattern of a ladder pattern, in which it rises then rests, gaining momentum to increase further. But in phase 3, the price will increase vertically, triggering greed and excitement of the crowd.

Features: FOMO sentiment is pushed up. Experts start saying “Gold will increase to $3000 – $5000”. Many non-traders and fresh buyers also begin to enter the market. Roughly, this is the time when “everywhere you go, you hear about the gold price”.
This stage is very happy and super excited. Just buy and win. Newspapers and media report good news about gold every day. And, whatever comes, must come.
Downtrend (Bear market)
A downtrend also has 3 phases. It begins with a distribution phase, followed by a sharp decline and finally a desperate phase.
(1) Distribution phase
It is strange because the good news about gold comes out continuously but the price does not increase.
Sign: The market will usually go sideways.
Features: The price often fluctuates strongly during this stage. The more positive information is pumped out, the transaction is also more active. Experts begin to say the market would increase even more. But the most important thing is that the market is not bullish.

Remember: Distribution phase is a long period. It is not a 1 or 2 days affair. It spans multiple sessions in a row and gives you enough signals to notice.
(2) Sharp decline phase
This is a terrible time for the buyers. Boom! The gold price breaks down from the horizontal channel of the distribution zone. The crowd begins to panic.
Sign: The price falls sharply and breaks out of the previous support levels.
Features: For professional investors, they will quickly cut their losses and leave the market. What about “chicken”? They begin to hope and pray for the price to return.

Unlike the bullish boom phase of the uptrend. this sharp decline phase is catastrophic. The price drops like a train plunging. The more you try to stop it, the more you “disintegrate”. If you don’t get out when the price breaks down (officially entering the downtrend), then you almost don’t dare to sell at this point.
(3) Desperate phase
After the massacre, those who still “hold the goods” will still expect the price to increase again. Therefore, the brokers will begin to take them from one hope to another, only to drown them all in despair.
Features: The market stops falling sharply. There are some retracements. This is like the landing of a ping pong ball, bouncing up and down, then bouncing again…
Sign: Buyers wait for the price to bounce back to exit all BUY positions. But as soon as the price rises, it falls again. Many fresh ones enter the market with the psychology of buying and waiting for high prices to sell. Now they become reluctant holders, who are desperate and praying.

So the market has ended a cycle consisting of one uptrend and one downtrend. Each trend consists of 3 phases. Of course, the biggest beneficiary is still the brokers. The preys here are traders, investment funds, etc, and especially chickens (newbies).
Tenet 3 is one of the best things about Dow Theory. It combines all the quintessence of technical analysis and market sentiment. Now I’m back to tenet 2.
Register an Exness account NowGet $1,000 Free for beginners
Tenet 2: Primary and secondary trends
The market does not fly like a rocket. It moves slowly. Therefore, in a primary trend (level 1), there are always secondary trends (level 2).

In an uptrend, the primary trend will be bullish. At the same time, a temporary downtrend in an uptrend will be called a secondary trend. A level 1 trend is considered to continue when the price continues to rise above the old high. The market makes higher highs and higher lows.
You can imagine it like a cow. After running for a while, it will walk slowly or stop to take some rest. Then, it steps back to gain momentum and sucks its head to rush forward.
Do you know what this principle means? Let me explain.
(i) This is the wave-in-wave theory. In a large bullish wave, there will be many rising and falling waves within it. And of course, all the small waves inside respect tenet 2 (there are bullish and bearish waves and 3 phases for each wave).

(ii) Don’t be in a hurry! If you missed a trade when the market broke out into the Uptrend, wait for the secondary trend to buy.
Have you discovered anything yet? Dow theory’s tenet 2 is the foundation of the Elliott wave theory, the Fibonacci retracement method and price action, etc. More benefits are still behind. Take your time to read. I believe your thinking after this article will change.
Tenet 4: Averages must confirm each other
Good stocks are only placed in a good market. In other words, If the Dow Jones increases, stocks like Walmart, Google, Apple, etc, will increase.
Or like when Bitcoin (BTC) increases, other Altcoins can benefit and increase accordingly. Now we will take the example of the Crypto market.

When money flows into the market, it spreads to other coins. So, when BTC rises, other small coins will also increase. Even the junk coins and Shitcoins also increased sharply. This is the spillover effect of cash flow.
The opposite is also true. When BTC falls, money flows out of the market. Other altcoins also sell off. It’s kind of like the Domino effect or herd mentality, running away from the market together.
When you decide to invest in a stock or a certain coin, analyze the general market. You need to see the big picture before investing your precious money.
A coin or a stock is only good when it is placed in a good market.
Tenet 5: Trend must be confirmed with volume
This is one of the pinnacles of Dow Theory – trend and volume. Very few traders understand and know this. What they look at is just a chart. But everything is explained by volume.
This is the reason why I can’t explain with the gold price. I’ll use any top coin so you can see its trading volume.
Trading volume is the money pouring into the market.
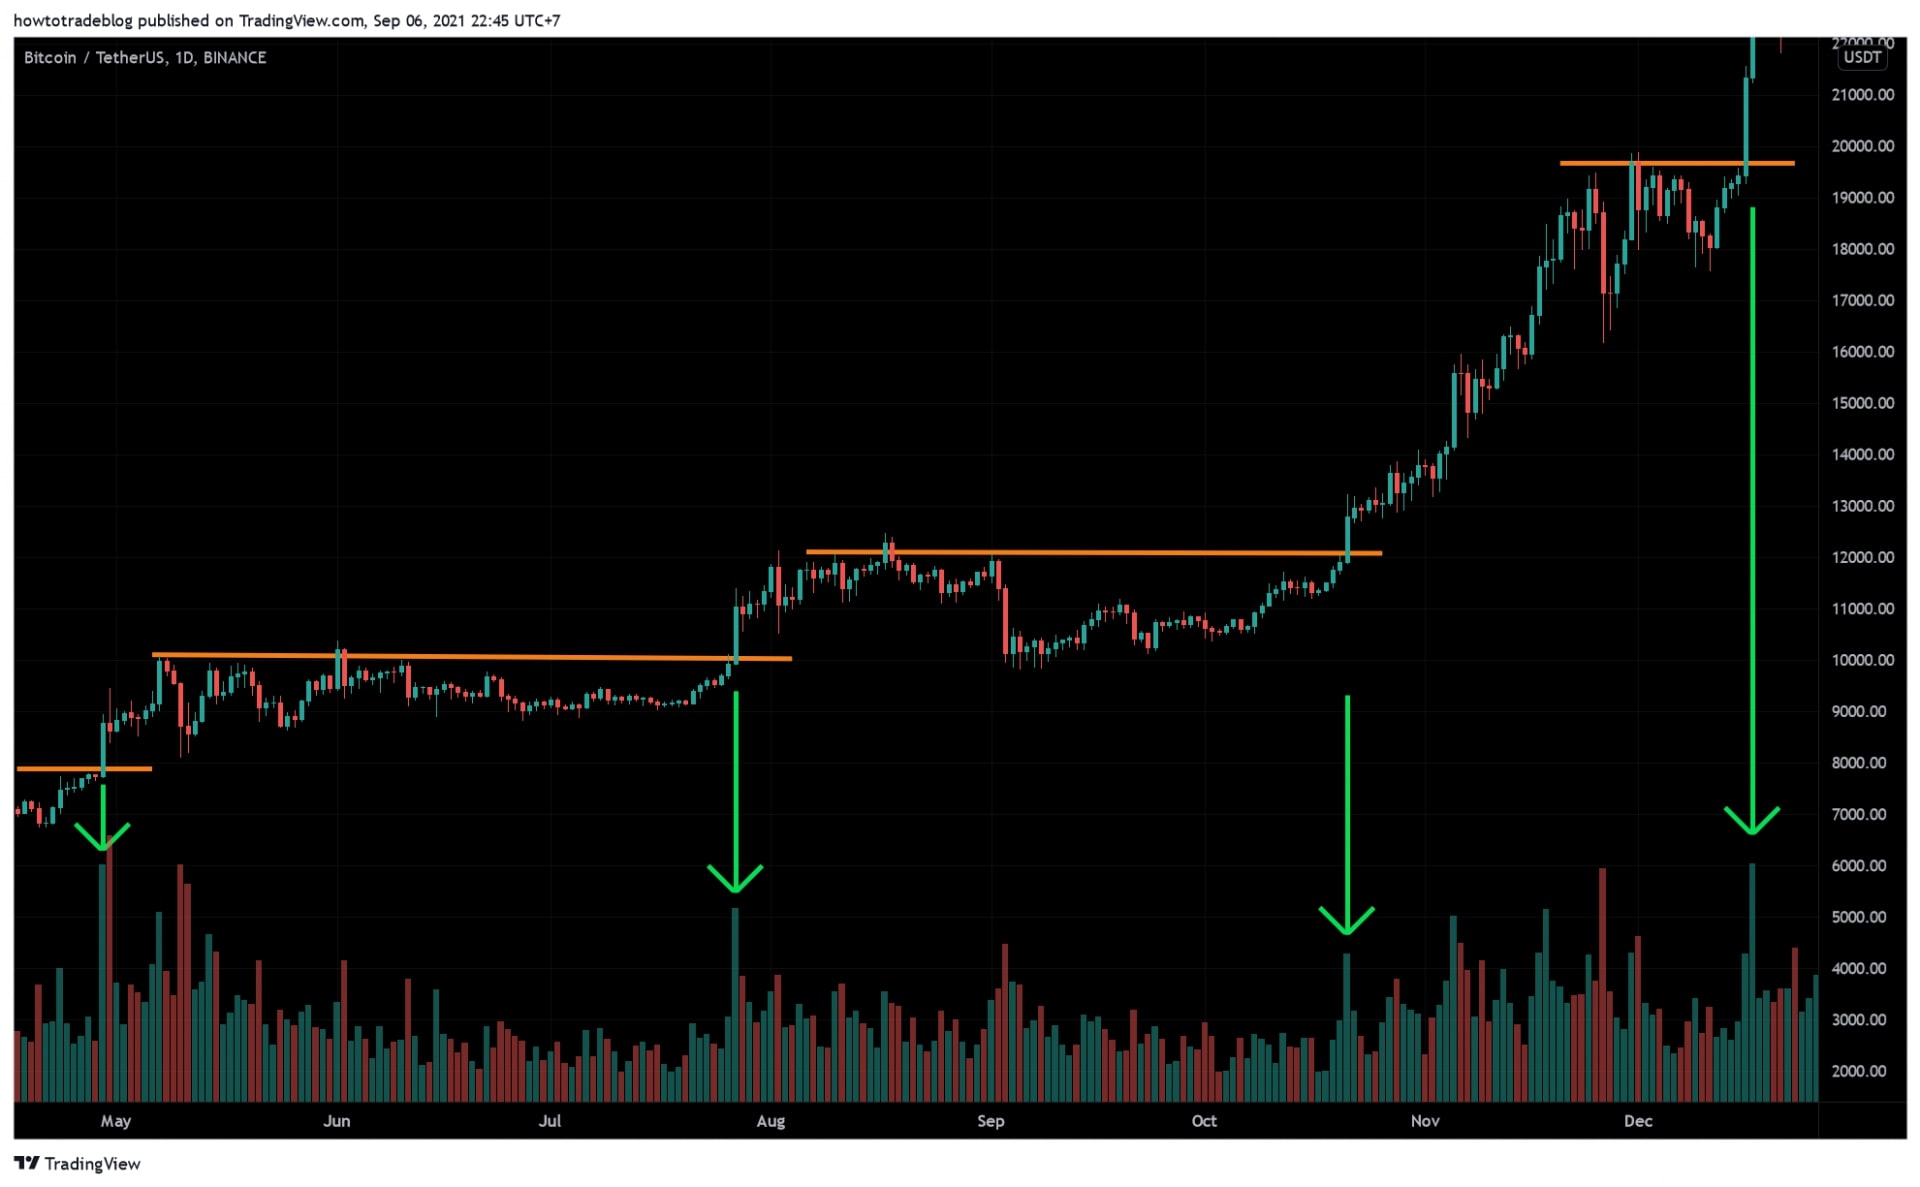
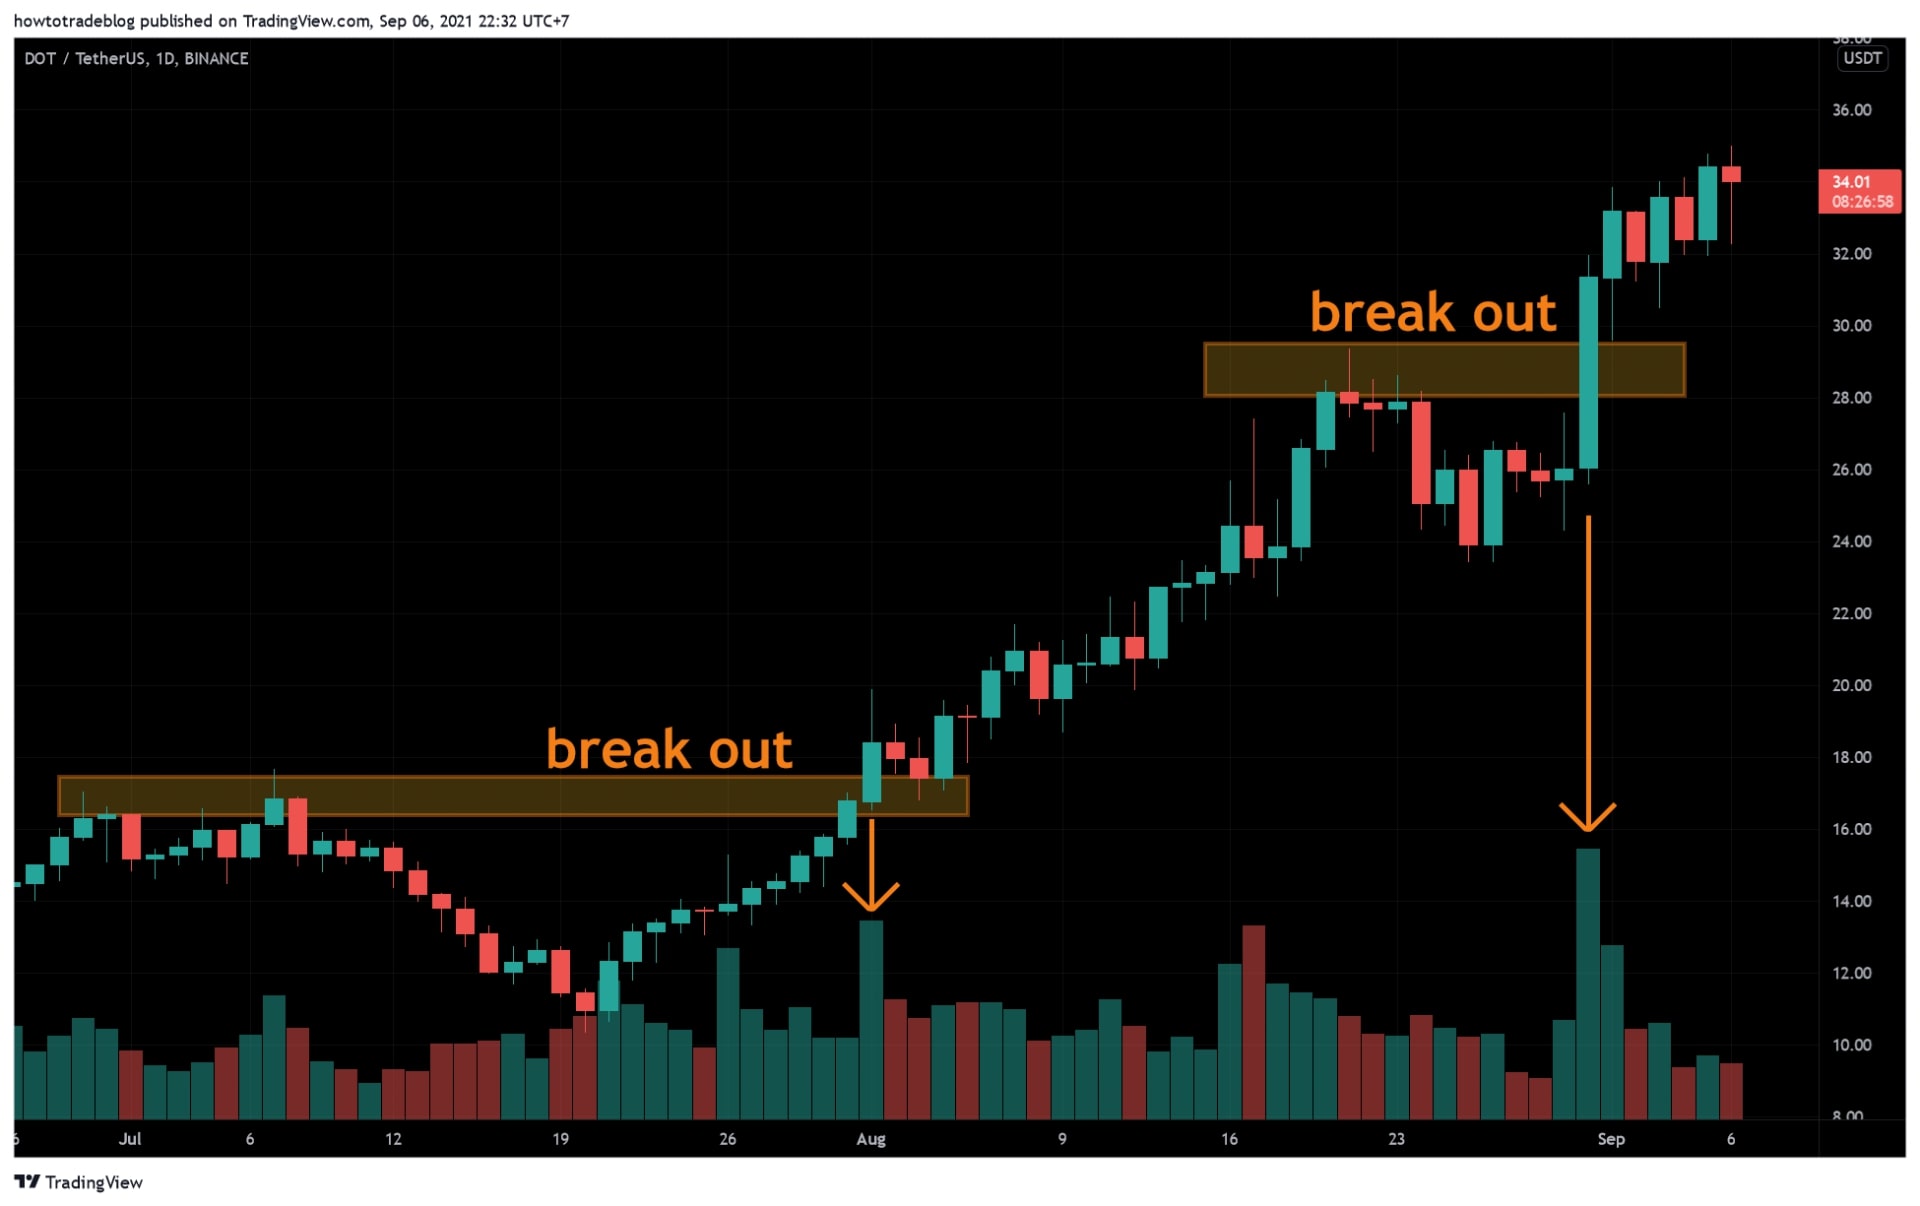
I will take an example with Bitcoin (BTC/USDT on Binance exchange). Take a close look at the Breakout points. What do you see? The uptrend must be accompanied by increased volume. This is a manifestation of the money flowing into BTC. The buyers overwhelm the sellers. Both the volume and the price increase.
Don’t just look at this example solely. Now, you can turn on the chart and goes to some good stocks or good coins. Open the Volume indicator to immediately verify what you have just read. See if I’m right?
There’s a lot more to the volume, which is the foundation of the VSA method. I will save it for later articles in this series.
Remember that a Breakout is only convincing when there is an increase in cash flow, which is volume.
Tenet 6: The main trend is maintained until there are clear signs of reversal
There is a classic saying “Trade what you see, not what you think”. It is alluding to this theory.
Everything is maintained only until there is a clear sign of reversal. Nothing is ambiguous and everything is very clear. Uptrend only ends when the market has finished distributing. There are signs of strong decline and breaking the trend. On the contrary, a downtrend only ends when the market accumulates, reverses the trend with a breakout candle and enters the uptrend.
Dow Theory does not encourage you to buy low and sell high. Dow Theory only encourages you to trade most safely. That is to buy when the market has entered an uptrend and sell when the market has entered a downtrend.
This proves that even Mr. Dow cannot predict the top and bottom of the market. Nobody can do this. Don’t try to buy low and sell high. I’ll repeat it again. What you need to do is to buy when the price enters the explosion phase, hold until the distribution phase and sell when there is a sign that the uptrend has ended.
Remember that two major trends and 3 phases are a long process. It doesn’t happen in 1 or 2 days. This process is very clear and you can completely use your knowledge to analyze and identify.
Summary
Many people say that Dow Theory is just a theory, has a lag, and is not practical.
Wrong! Dow Theory is the source of all technical analysis. It even includes market sentiment in it. You try to look at the picture below to see the emotional development of a trader in trading. Is it similar to Dow Theory? I will have another post to talk about this topic.

The market has one time or another. The bull/bear cycle is sometimes fast and sometimes slow. But human psychology for hundreds of years has never changed. This is the depth that Dow Theory wants to convey.
After 3 articles, I have finished sharing all the necessary background knowledge. In the next ones, we will only go into practice. From here on, what I quote will lie mainly in this article.
If you’ve been reading till this line, turn on Tradingview and test it out. Test to see if what this DOW theory teaches is correct? See if the market really has 2 trends and 3 phases? Is it true that all breakout points come with high volume? Give it a try. I guarantee you’ll learn a lot more.
Register an Exness account NowGet $1,000 Free for beginners
The post What is Dow Theory? The Foundation of All Markets (Part 3 – must-read) appeared first on How To Trade Blog.
source https://howtotradeblog.com/dow-theory/
No comments:
Post a Comment