Choose the Japanese candlestick chart to observe the price of a trading asset. Clusters of candlesticks interweave with different colors to form an overall picture. There are interesting patterns that give a good signal to enter a trade. Today, I will introduce to you the Tweezer Tops & Bottoms candlestick patterns. Its identification characteristics, meaning, and how to trade safely will also be available.
Register an IQ Option account NowGet $10,000 Free for beginners
Video on how to identify and trade with the Tweezer Tops and Bottoms candlestick pattern
What is Tweezer?
Tweezer is a reversal candlestick pattern that usually appears at the top or bottom of an upward or downward trend.

What is a Tweezer Tops candlestick pattern?
Tweezer Tops candlestick patterns usually appear in an uptrend. It signals a reversal from bullish to bearish with high probability.
This is a signal used by experienced traders to predict price reversals. It has very high accuracy. Therefore, you can consider opening a DOWN order safely.

What is a Tweezer Bottoms candlestick pattern?
In contrast, the Tweezer Bottoms candlestick pattern appears in a downtrend. When it appears, it brings a strong reversal message from decreasing to rising to investors.
It is used by successful traders as a tool to predict the reversal from decreasing to rising. And it yields positive results in many decisive transactions.

Characteristics of Tweezer Tops and Bottoms candlestick patterns
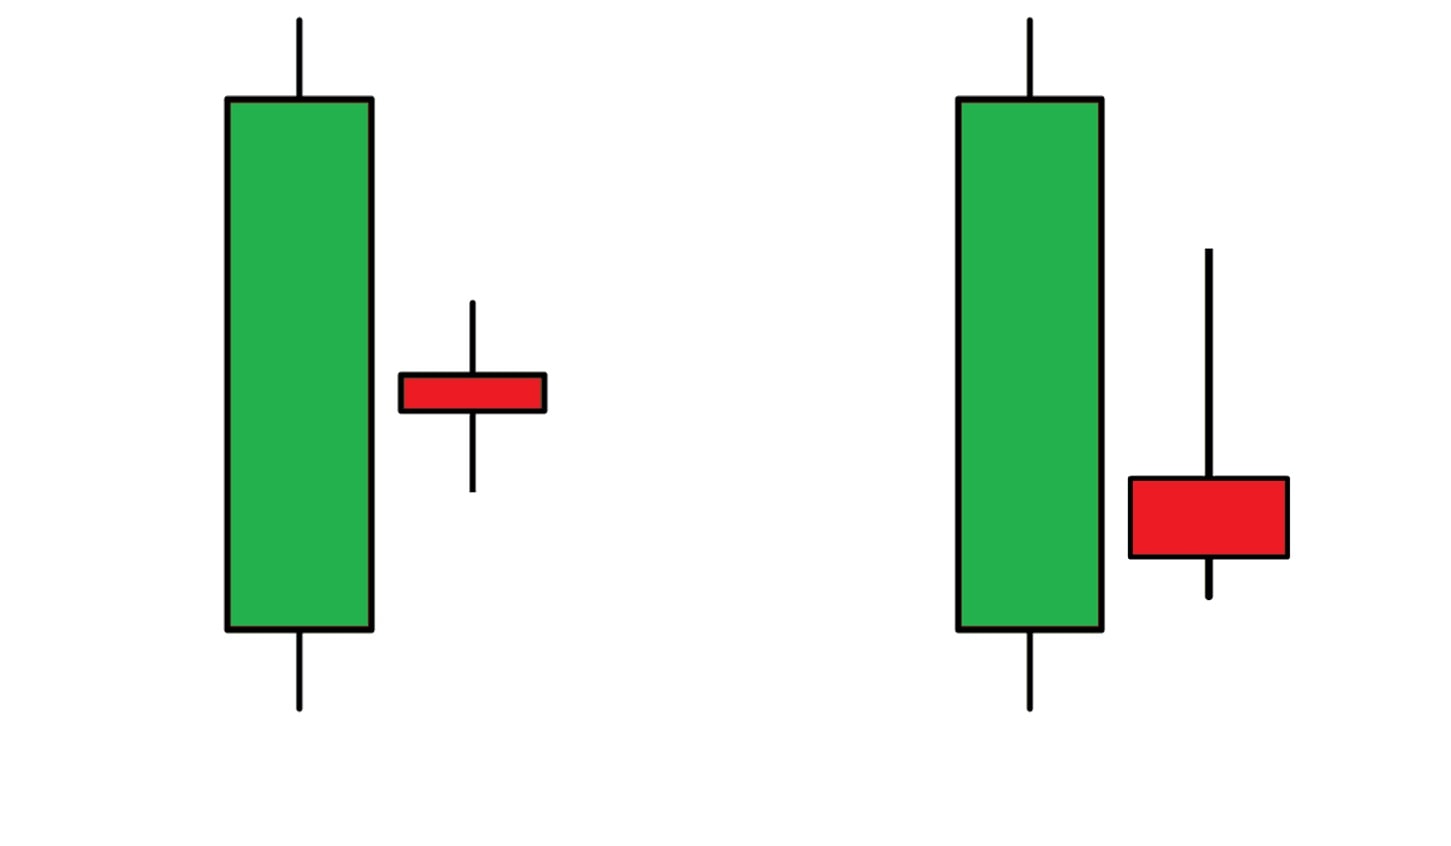
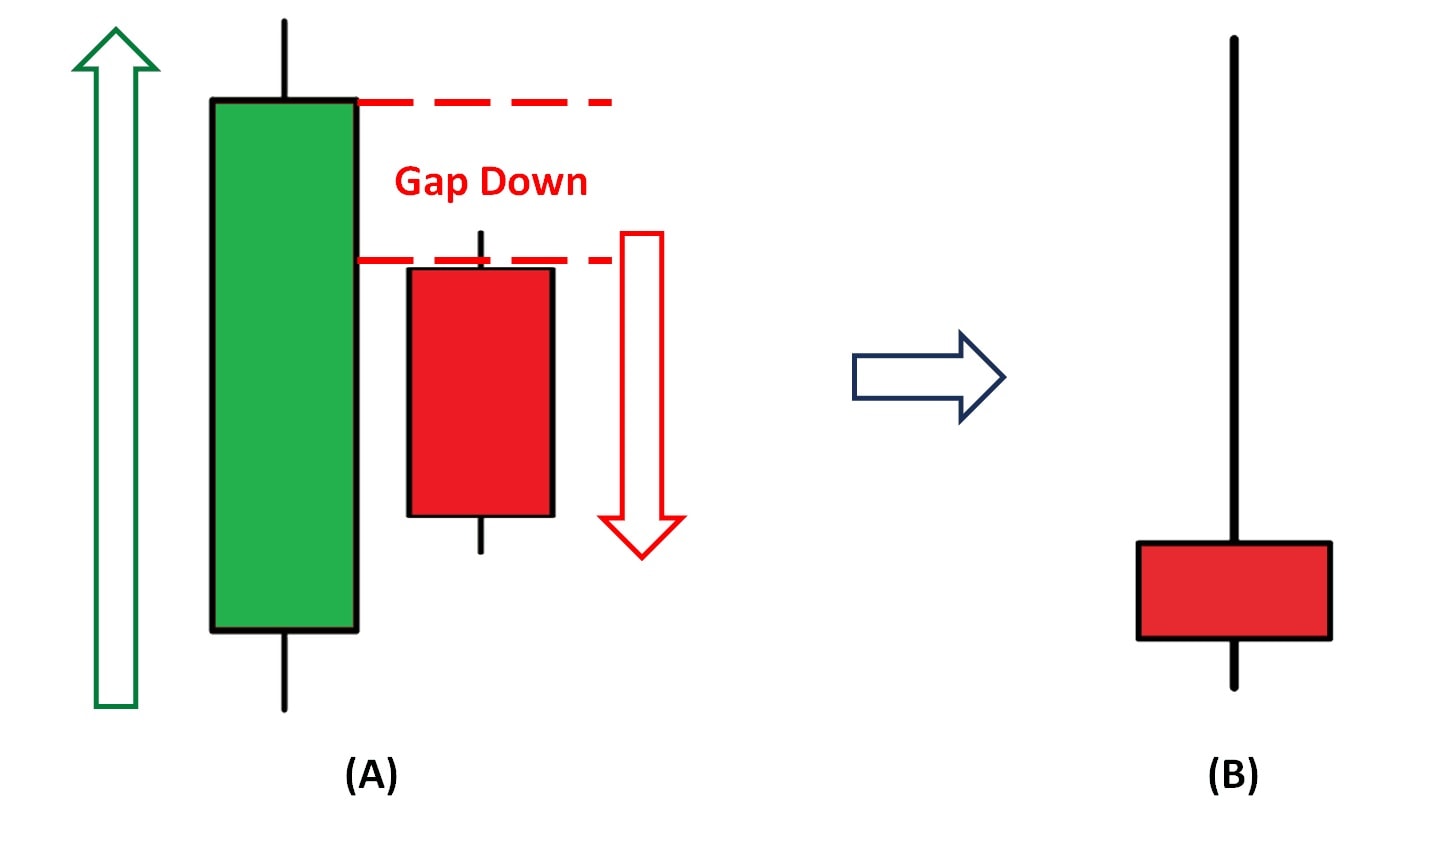
You can recognize them quickly because they look very simple and easy to remember. They consist of 2 long body candlesticks, appearing in parallel but with different colors. Traders sometimes interestingly see it as rails because it looks like that.

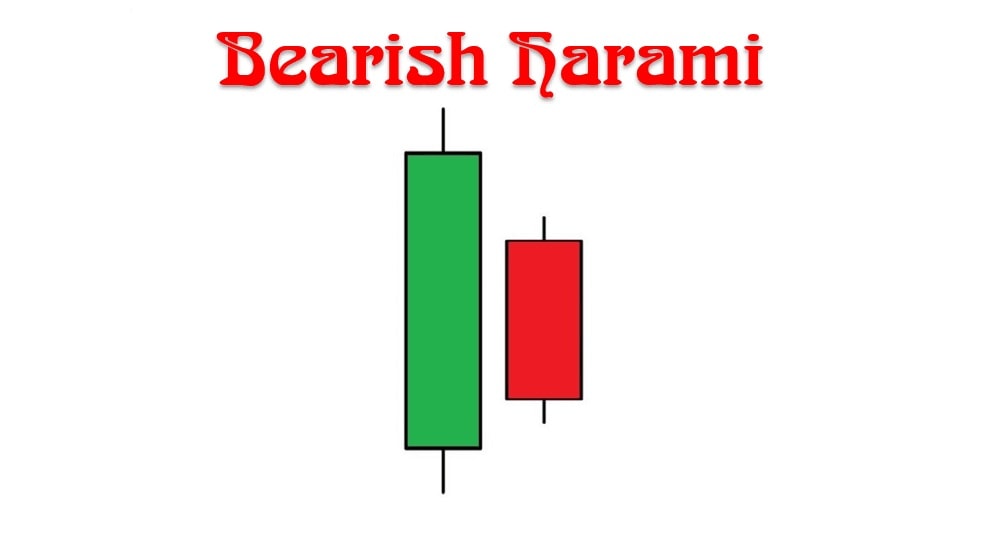
Tweezer Tops pattern consists of 2 candlesticks:
– First candlestick: is a bullish candlestick with a long body
– Second candlestick: is a bearish candlestick with the equivalent length to the first one.
They usually appear at the top of an uptrend, warning an upcoming reversal.
Tweezer Bottoms pattern consists of 2 candlesticks:
– First candlestick: is a bearish candlestick with a long body.
– Second candlestick: is a bullish candlestick with the equivalent length to the first one.
If appearing at the bottom of a downtrend, the accuracy of the Tweezer Bottoms candlestick pattern is very high. It predicts a reversal from bearish to bullish will occur soon.
Meaning of Tweezer Tops and Bottoms candlestick patterns
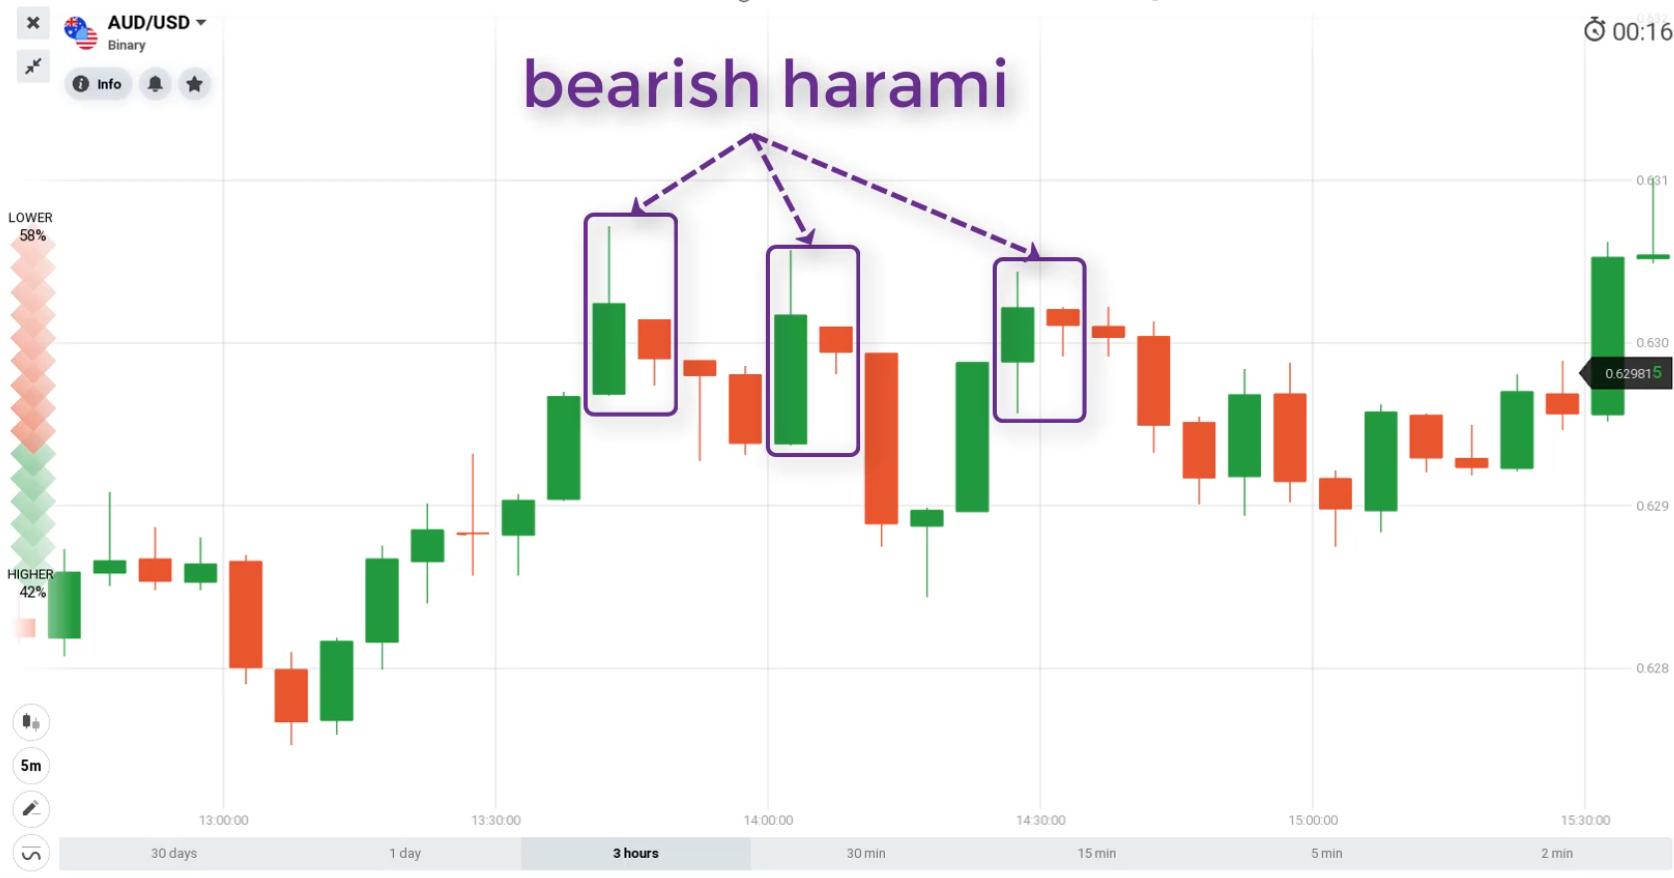
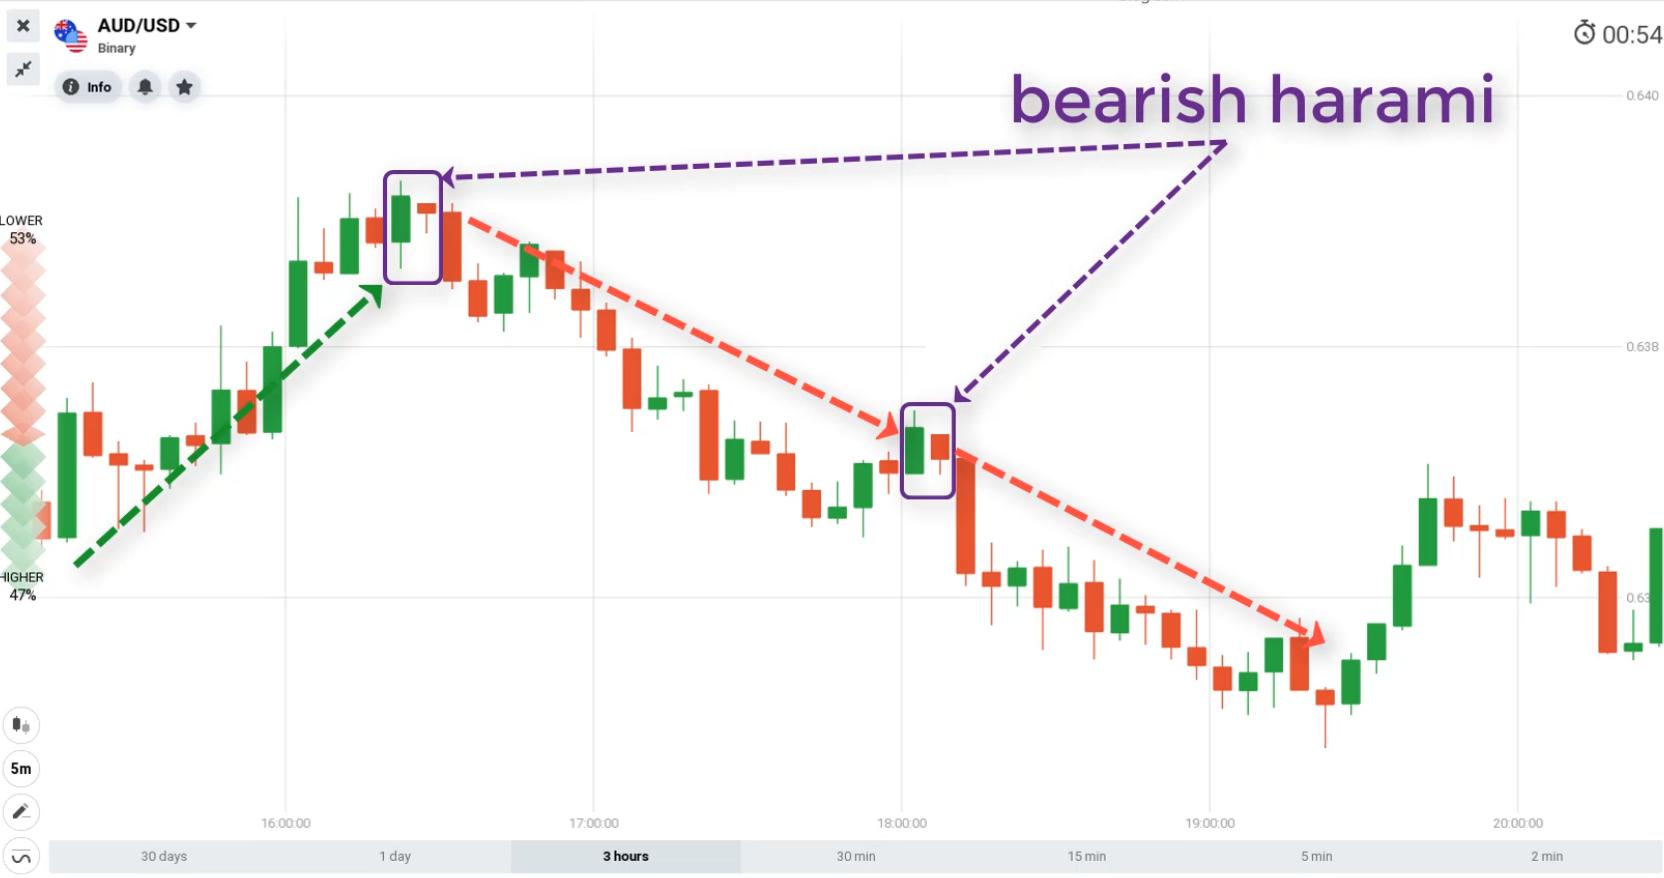
It can be seen that after the Tweezer Tops & Bottoms candlestick patterns appear, the market has some breakout in decreasing or increasing. They only occur in an upward or downward trend.
When the market is trending up, prices continue to reach higher. Suddenly, a bearish candlestick with the same length as the previous bullish candlestick appears and completely negates the upward momentum. The Tweezer Tops pattern appears, indicating a falling trend.
On the contrary, in a downtrend, the price goes deeper to reach the lowest level. Then, a long bullish candle with the same length as the previous bearish candlestick appears. There, the Tweezer Bottoms candlestick pattern has been confirmed and a reversal is likely to happen.

How to trade binary options with Tweezer Tops and Bottoms candlestick pattern
For price action traders, the Tweezer candlestick pattern is a strong reversal signal. It is like an early warning from the market that a reversal is imminent. For safe transactions, we should combine it with other technical analysis indicators.
In this article, I will show you how to trade binary options by combining the Tweezer Tops and Bottoms reversal candlestick pattern with Support/Resistance and RSI indicator.
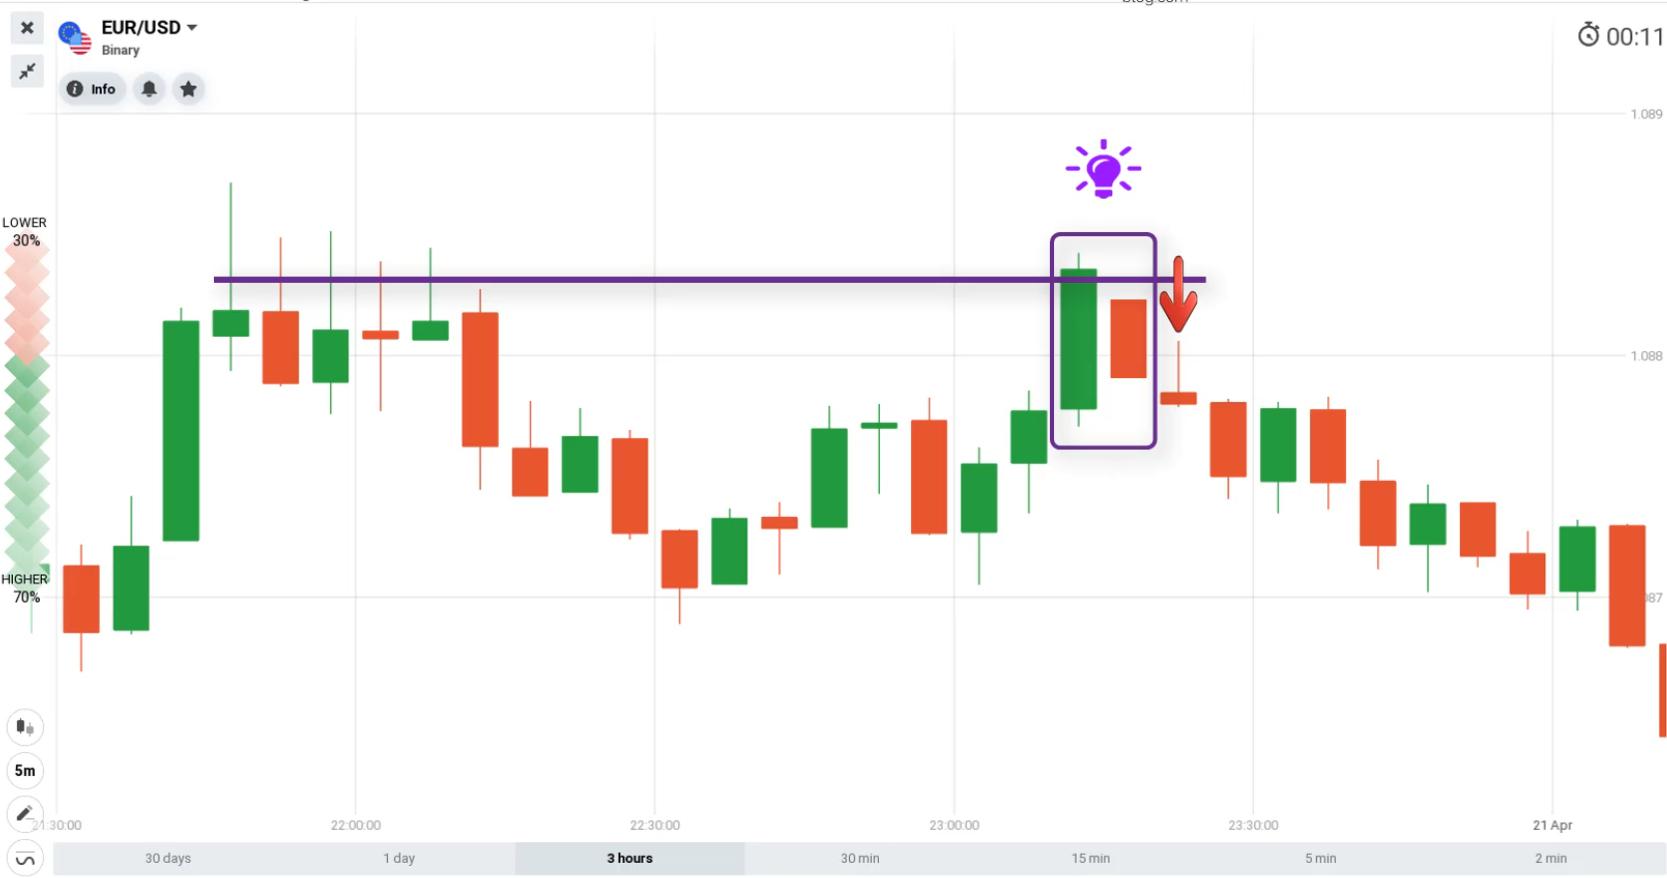
Tweezer Tops candlestick pattern combined with resistance
Conditions: A 5-minute Japanese candlestick chart. The expiration time of 5 minutes to 15 minutes.
Open a DOWN order when: The Tweezer Tops candlestick pattern appears in the resistance zone.
Explanation: When the price reaches the resistance zone, it usually reacts hesitantly and bounces back. If the Tweezer Tops candlestick pattern appears in the resistance zone, the probability of price decline is very high. This is the least risky zone for DOWN orders.

Tweezer Bottoms candlestick pattern combined with support
Conditions: A 5-minute Japanese candlestick chart. The expiration time of 5 minutes to 15 minutes.
Open an UP order when: The Tweezer Bottoms candlestick pattern appears right at the support.
Explanation: The price usually rebounds higher when it enters the support. The Tweezer candlestick pattern appearing right at the support is a reliable signal to open an UP order.

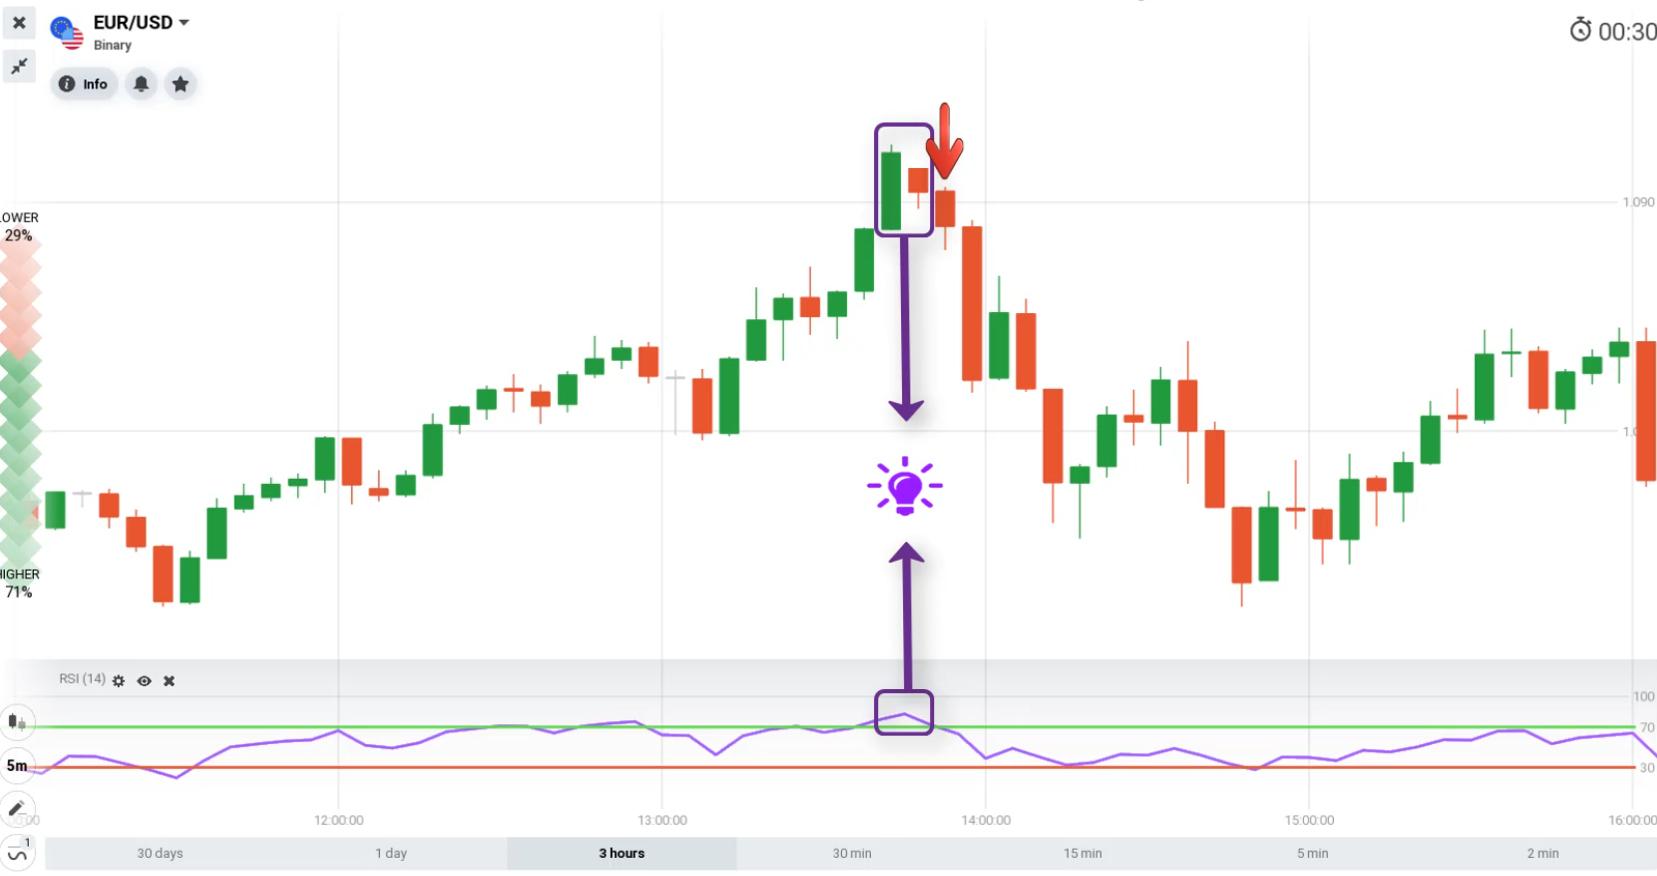
Combining Tweezer Tops and Bottoms candlestick patterns with RSI indicator
Conditions: A 5-minute Japanese candlestick chart. The expiration time of 5 minutes.
Open a DOWN order when: The Tweezer Tops candlestick pattern appears right at the overbought zone of RSI.
Explanation: When the price enters the overbought zone, the probability of further increase is not much. In most cases, when touching the overbought zone, the price often reverses from up to down. When combined with Tweezer Tops candlestick pattern right at the overbought zone, opening a DOWN order is very safe.

Open an UP order when: The Tweezer Bottoms candlestick pattern appears right at the oversold zone of RSI.
Explanation: When the price enters the oversold zone, the declining momentum has been weakened. Traders usually open UP orders in the oversold zone of the RSI indicator. If the Tweezer Bottoms candlestick pattern appears in the oversold zone, opening an UP order will yield a high winning rate.

Things to keep in mind when using these two candlestick patterns to trade binary options
– Do not trade when there is news causing strong fluctuations. Because when the market is affected by the news, every candlestick pattern has almost no effect.
– Do not apply the Tweezer Tops and Bottoms candlestick pattern when the market is in a sideways trend.
– Do not use this candlestick pattern independently. Combine it with other indicators such as RSI, MACD, and SMA, etc., to increase accuracy.
When you are a follower of the reversal trading, the Tweezer candlestick pattern is the entry signal. Combining with other basic technical analysis indicators will increase efficiency. Experience and test it for yourself on a Demo account. From there, you can draw for yourself a binary options trading strategy that suits you.
Register an IQ Option account NowGet $10,000 Free for beginners
The post What Are Tweezer Tops And Tweezer Bottoms? Meaning And How To Trade appeared first on How To Trade Blog.
source https://howtotradeblog.com/tweezer-tops-tweezer-bottoms/