Today, How to trade blog will introduce to you the Bearish Harami candlestick pattern. This is a good signal for orders following the downtrend. This article will provide all the best knowledge about this special candlestick pattern. How to use it in transactions so that it is most effective.
Video on how to identify and use Bearish Harami candlestick pattern
What is a Bearish Harami candlestick pattern?
Harami is the common name for a type of candlestick pattern shaped like a pregnant woman. Bullish Harami is a candlestick pattern signaling the reversal of prices from falling to rising. In contrast, the Bearish Harami candlestick pattern is a signal for a reversal from up to down.
These two candlestick patterns are very good, highly accurate signal pairs. Traders always give an eye on them when they appear on the price chart.
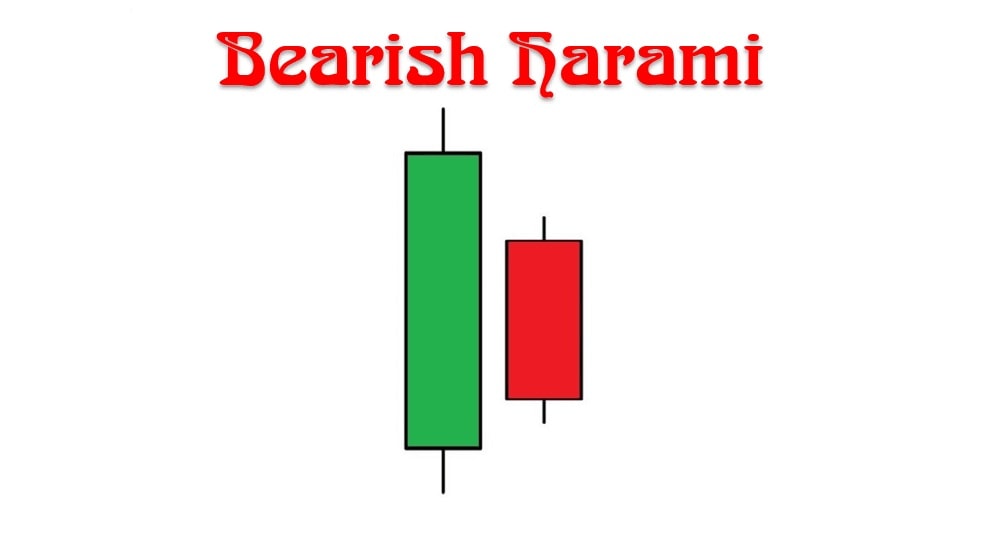
Structure of a Bearish Harami candlestick pattern
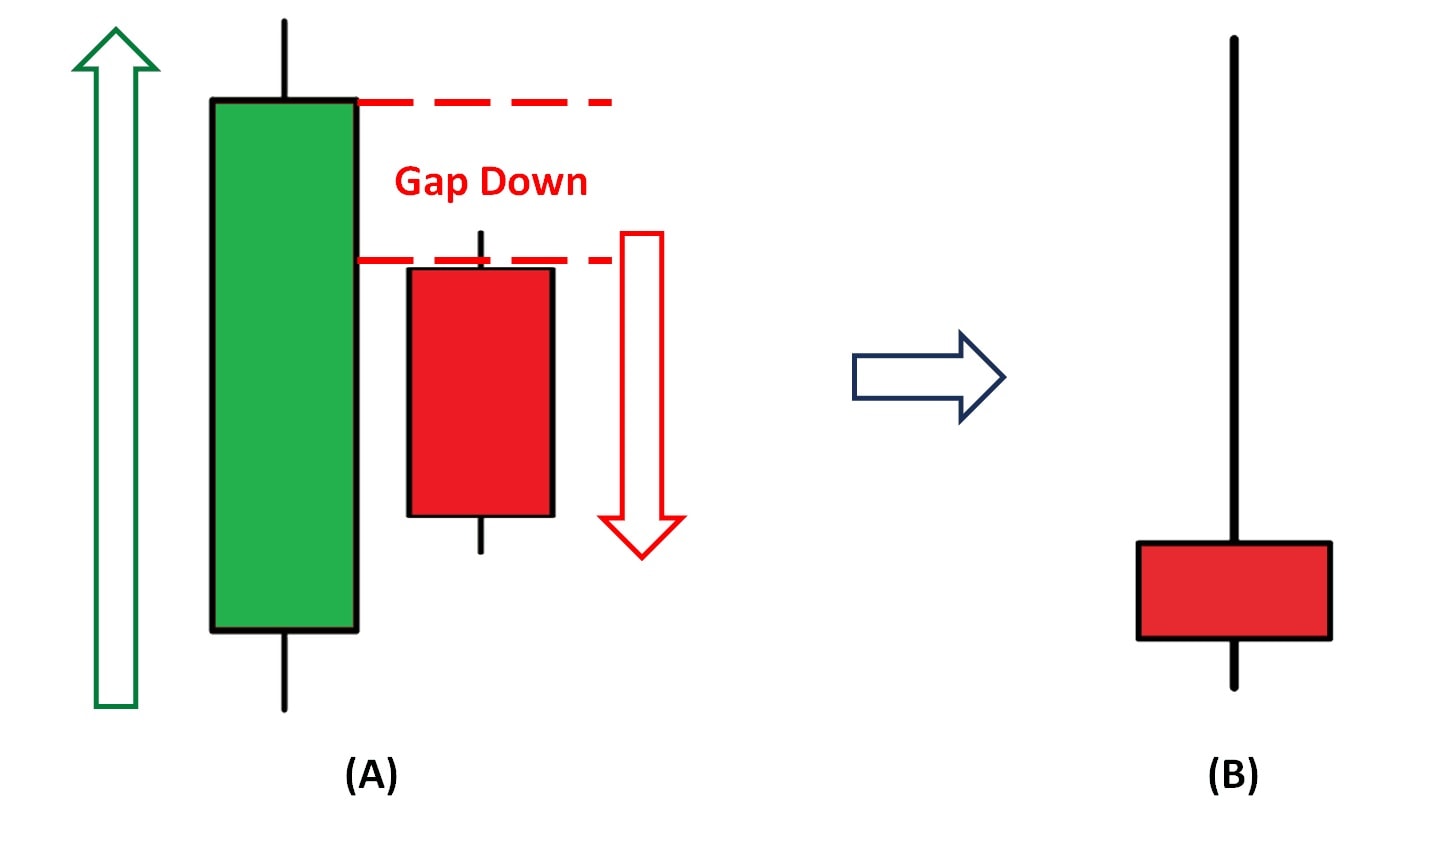
The standard candlestick pattern consists of 2 candles.
- The first candlestick is a strong green bullish one.
- The second candlestick is a red (bearish) candle lying within the first one.
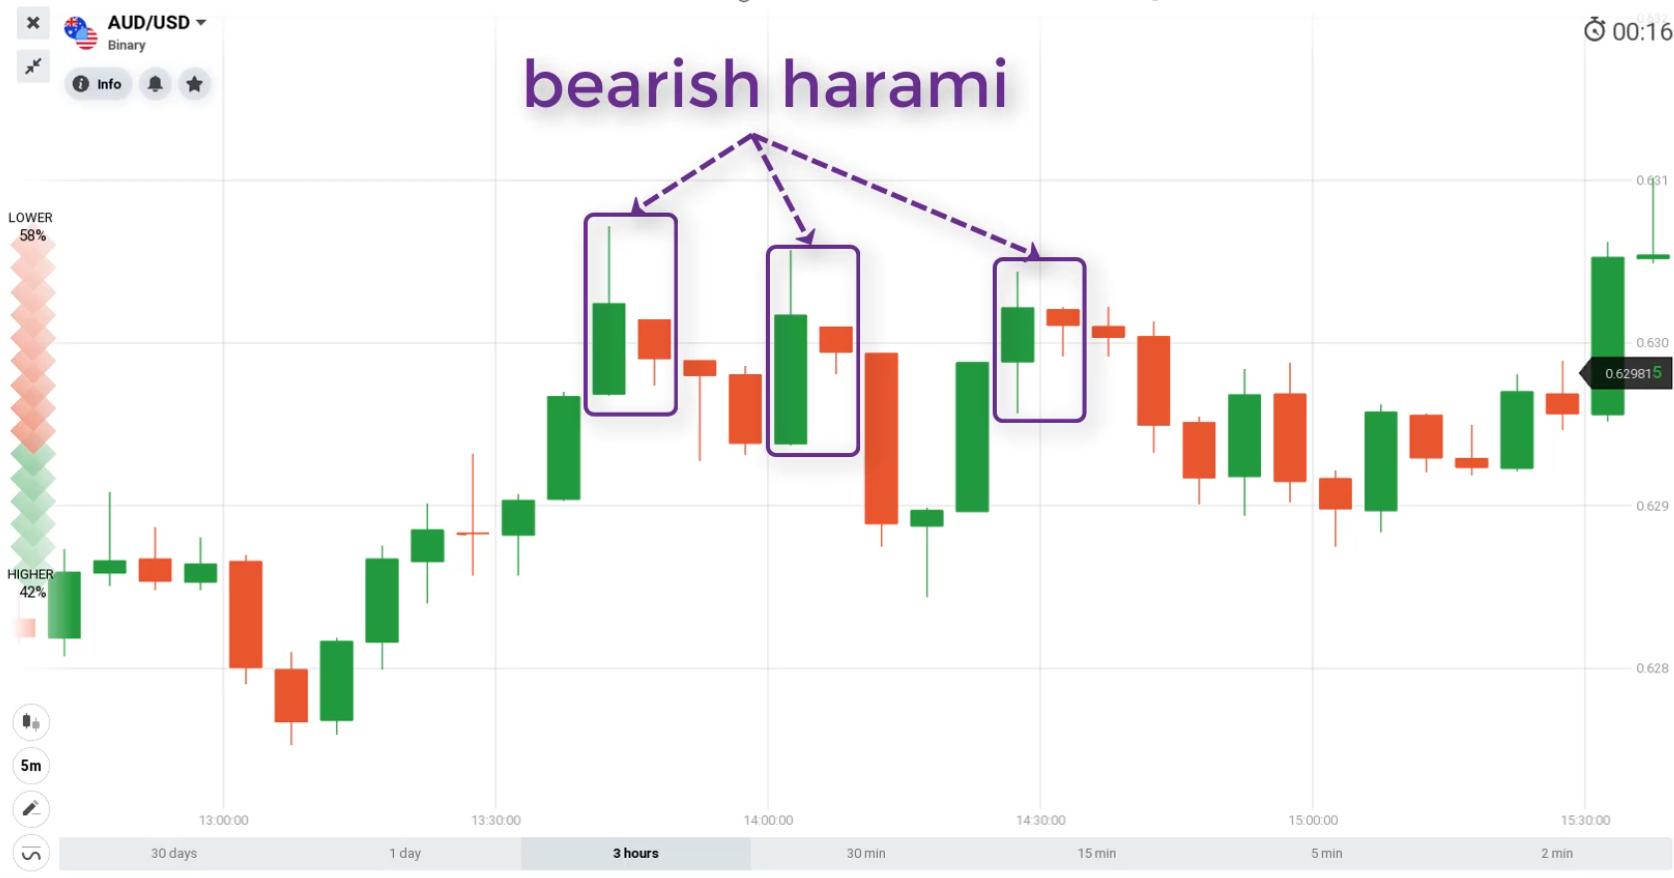
On the Japanese candlestick price chart: It usually appears at the end of uptrends and predicts a future price decline. The pattern which has a larger amplitude will give a more accurate bearish signal.
Some appearance of this special candlestick pattern on the Japanese candlestick chart.
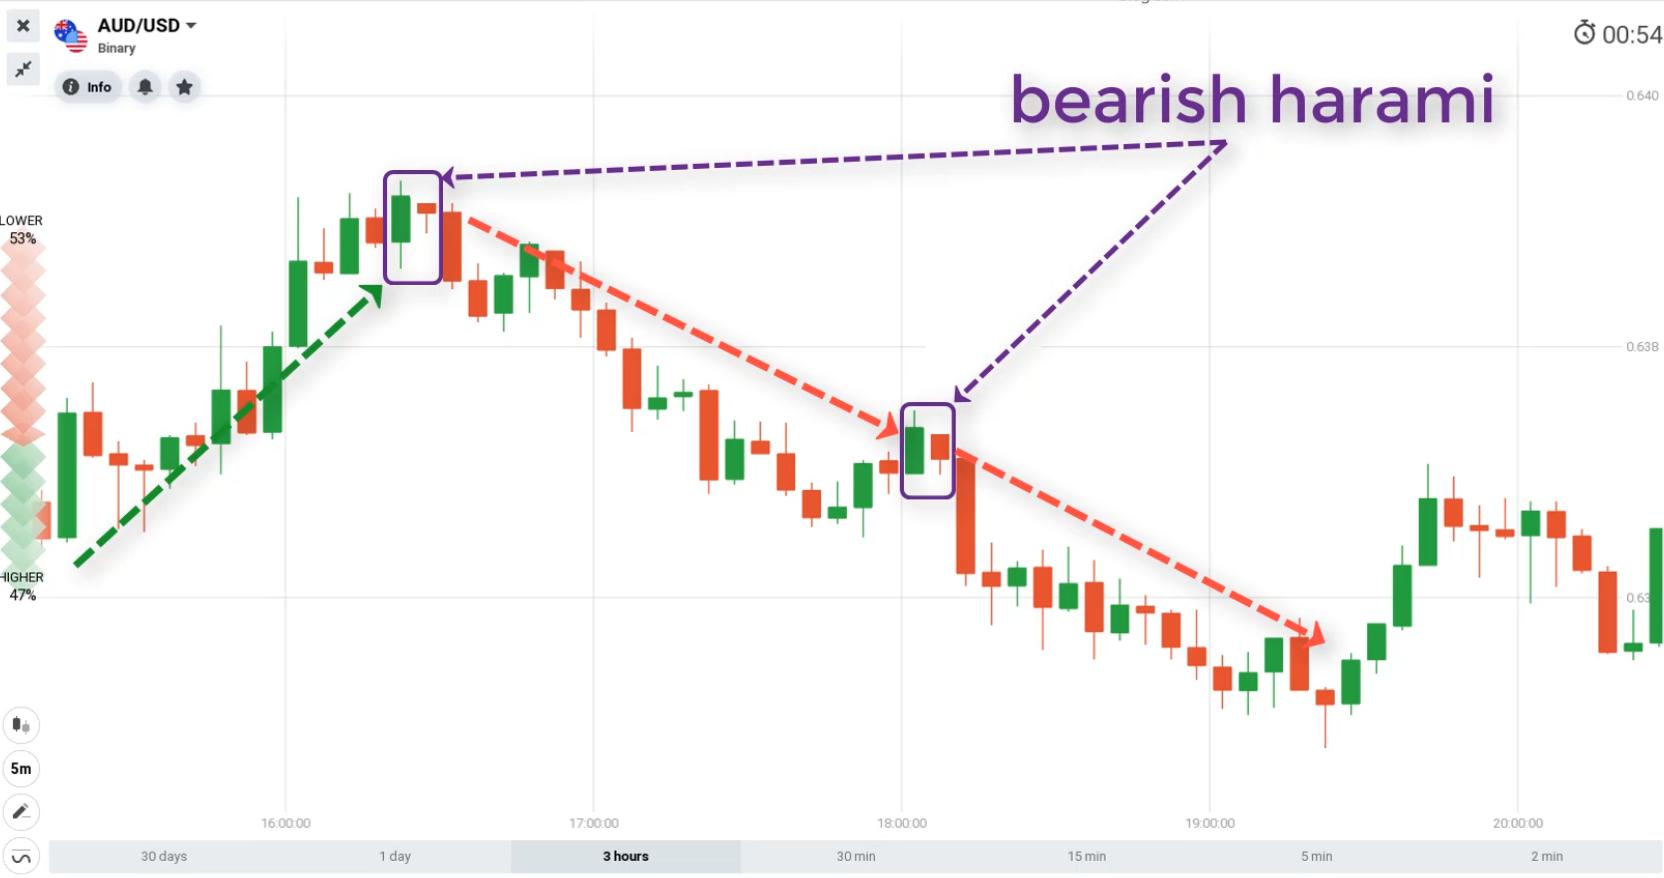
Sometimes, the Bearish Harami candlestick pattern appears in a downtrend. This is a signal for the continuation of the downtrend.
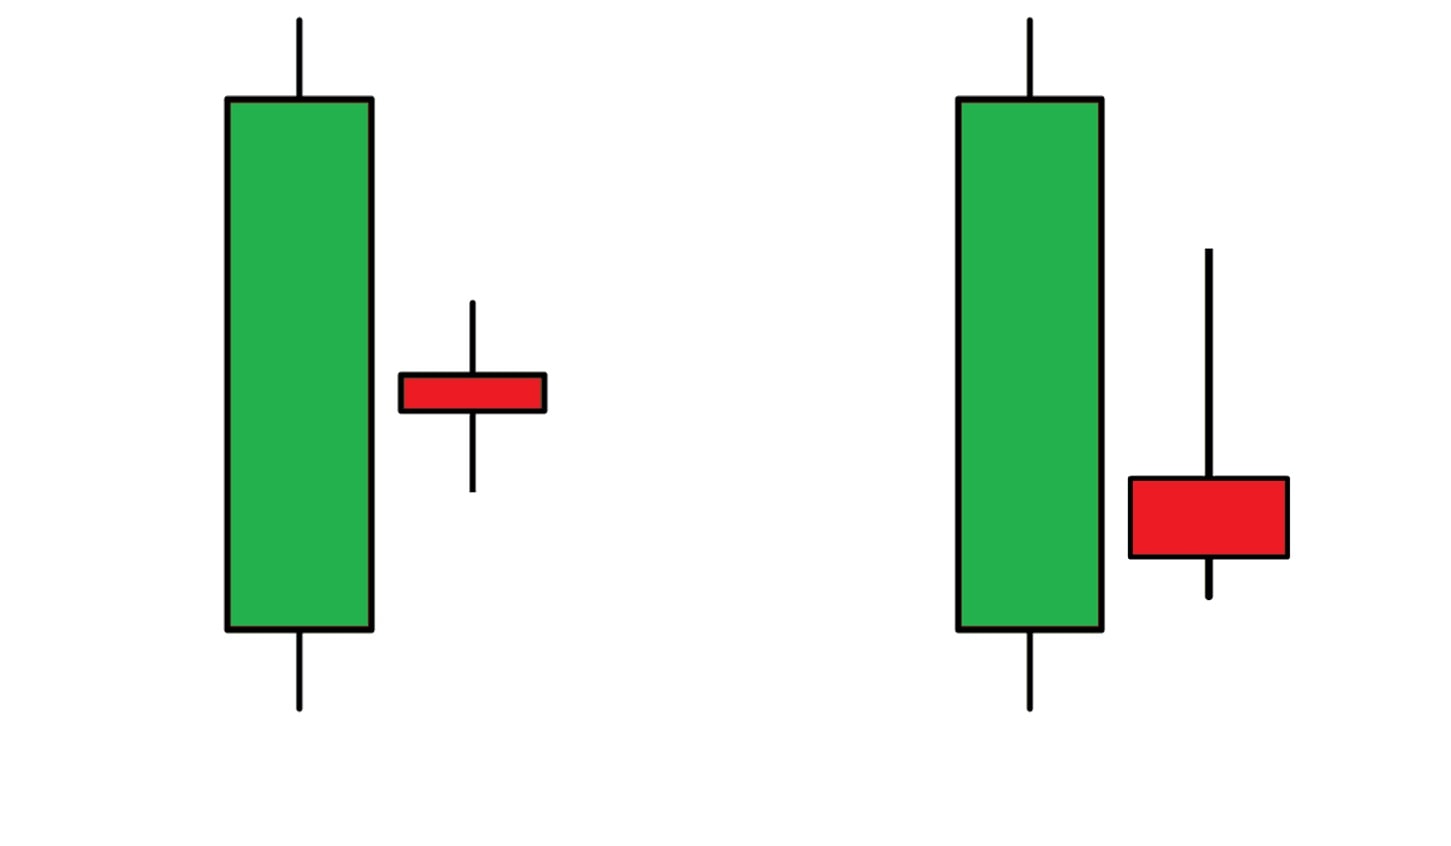
The variant Bearish Harami candlestick pattern
Compared to its standard pattern, the variant one has a slightly different structure. The second candlestick is a Spinning Top or Pin Bar. This variant candlestick pattern is also a very noticeable signal of experienced traders when it appears.
Bearish Harami pattern meaning
Combining the 2 candles of the Bearish Harami, you will get a Bearish Pin Bar (aka Shooting Star). These are popular candlesticks signaling bearish trends. This explains why it often appears at the end of an uptrend and is a signal of price reversal from up to down.
How to trade binary options with this candlestick pattern
Bearish Harami is a special candlestick pattern, which is the beginning of major price drops. Traders consider this candle pattern as confirmation points to open DOWN orders. To get the most out of this candlestick pattern, traders often combine it with trend indicators. Let’s take a look at some of the following effective combinations.
Notes: This is a bearish reversal pattern. So when using it, you can only open DOWN orders following the prediction of the pattern only.
Strategy 1. In combination with RSI indicator
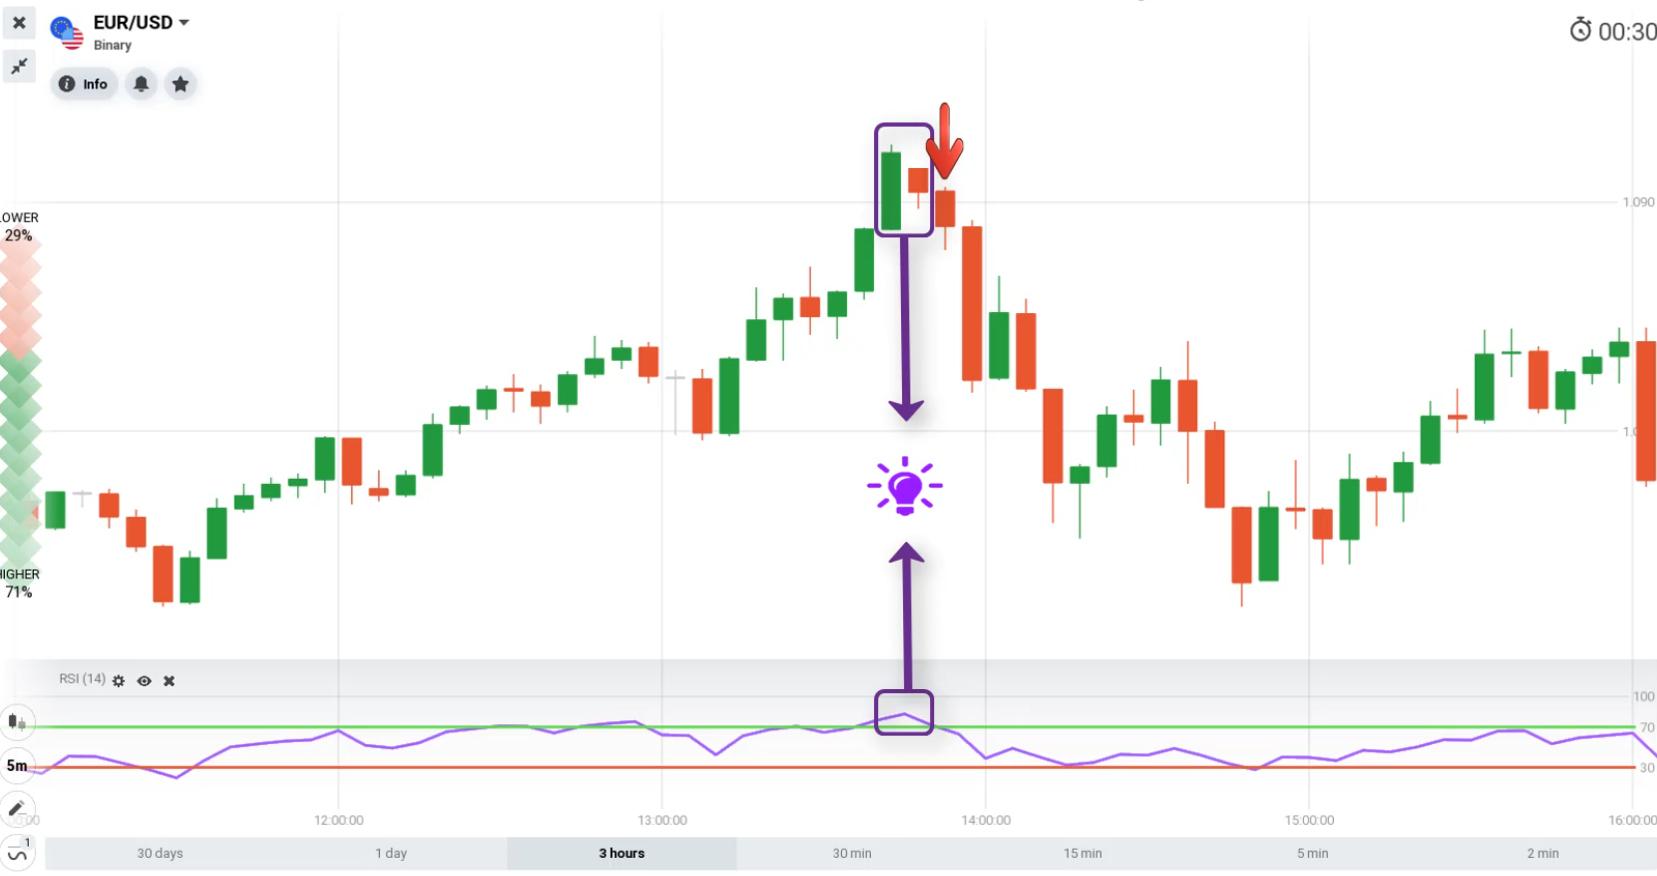
RSI indicator is a very good price trend analysis indicator. When the RSI is in the overbought zone, the price tends to fall. Combined with the appearance of the Bearish Harami pattern, this will be a very good entry signal for you to make a profit.
Conditions: The 5-minute Japanese candlestick chart, RSI indicator (14). Orders with an expiration time of 15 minutes.
Trading formula:
+ Open a DOWN option when the RSI indicator is in the oversold zone, and our candlestick pattern appears.
Strategy 2. In combination with Resistance
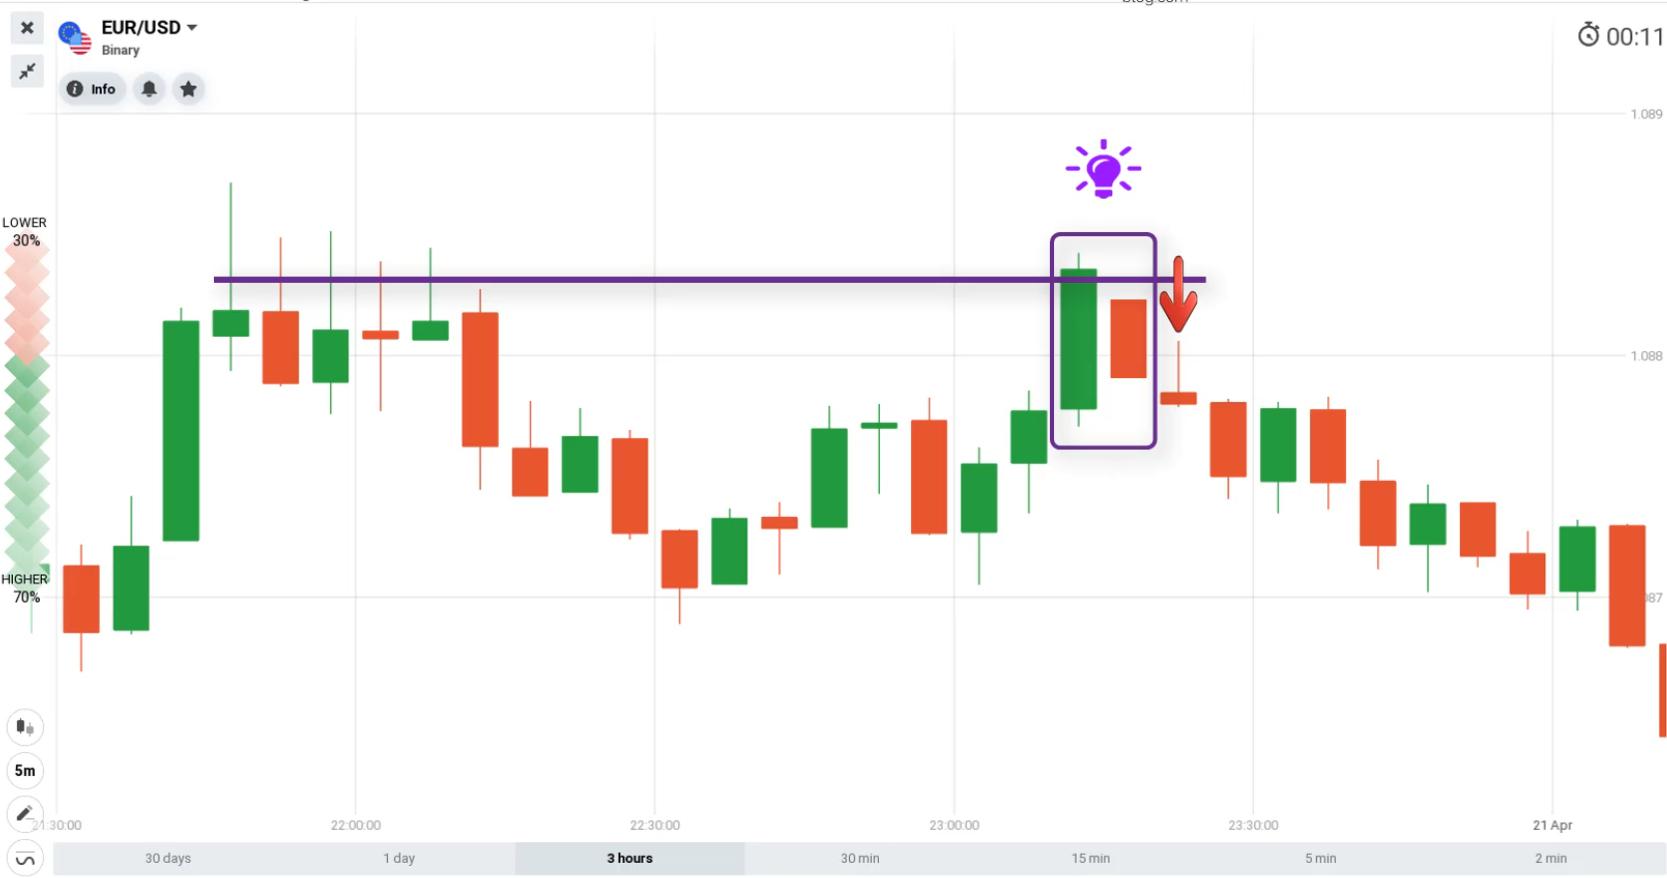
The resistance is the zone where when the price touches, it will likely turn back down. If the price is forming a Bearish Harami pattern, it will likely decrease. You can then open DOWN orders according to this signal.
Conditions: The 5-minute Japanese candlestick chart, resistance zone. The expiration time of 15 minutes or above.
How to open an order:
+ Open a DOWN order when the price touches the resistance and our candlestick pattern appears.
Notes when using the pattern in binary options trading
- The Bearish Harami candlestick pattern is just a sign of a bullish reversal. We need to consider other factors before making a decision to open an order.
- The larger the candlestick margin is, the higher the accuracy becomes. The signal will also become more reliable.
- When the market has some fluctuation news, the effectiveness of the candlestick pattern can be greatly reduced. Prefer to use this candlestick pattern in trading sessions with little news.
This is a very popular candlestick pattern for traders to follow the trend. Familiarize yourself on a DEMO account with this special signal to better understand it. I wish you successful transactions.
Register an IQ Option account NowGet $10,000 Free for beginners
The post What Is Bearish Harami Pattern? How To Identify And Use It In Trading appeared first on How To Trade Blog.
source https://howtotradeblog.com/what-is-bearish-harami-candlestick-pattern/
No comments:
Post a Comment