EMA and SMA are the two types of moving averages used most in trading. Today, Howtotrade blog will help you get acquainted with the EMA indicator. We will guide you on how to use EMA like professional traders. This is an important skill you need to have when trading using moving averages. Stay tuned to learn more about this EMA.
Register an IQ Option account NowGet $10,000 Free for beginners
Video on using the EMA indicator in Binary Options trading
What is the EMA indicator?
EMA stands for Exponential Moving Average which is understood as exponential average. Unlike the simple moving average (SMA), EMA uses an exponential formula for calculation. So, EMA has better sensitivity and reacts to price faster than SMA. Professional traders often use EMA to predict price movements in the short to medium term.
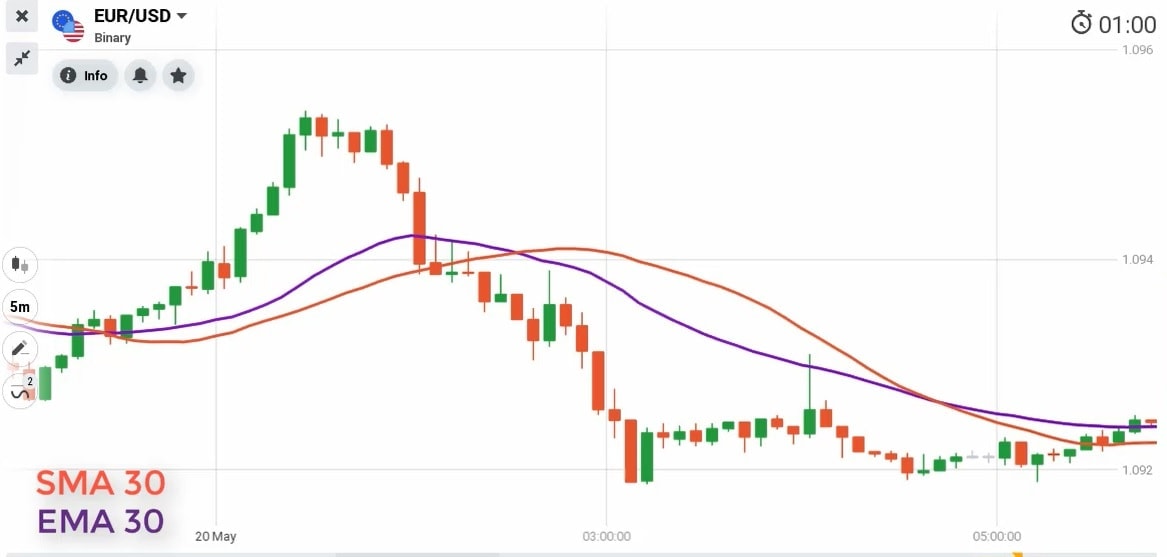
Compared to SMA, EMA tracks price trends better. It catches up with fluctuations faster. However, for this reason, EMA also filters out noisy signals worse than the SMA.
How EMA works
Like other moving averages, the basic signals that the EMA gives to traders are trend signals.
Specifically:
+ When the price is in an uptrend, the Japanese candlesticks are above the EMA which is pointing up.
+ When the price is in a downtrend, the Japanese candlesticks are below the EMA which is heading down.
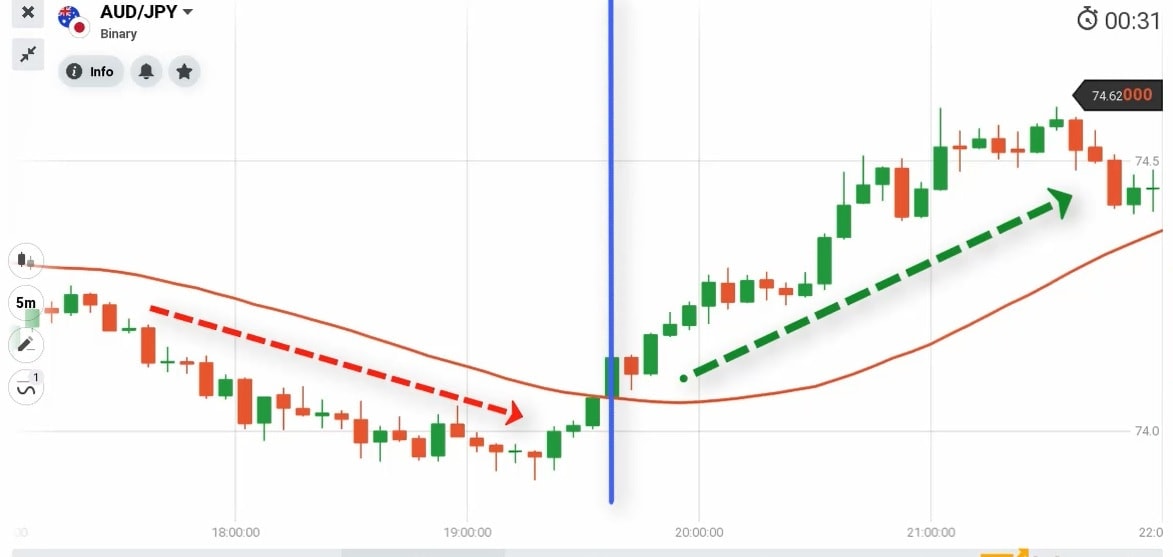
Especially: When the price crosses EMA decisively, it will create a new trend. This is an important price trend reversal signal of the EMA.
How to use EMA in Binary Options trading
There are many ways to use EMA to find entry points in options trading. A common use is to use EMA to identify the main trend and then wait for entry signals from the indicators or price behavior.
EMA combines with Heiken Ashi candlestick chart
The Heiken Ashi candlestick chart is a reliable tool for trading following the trend. Combining EMA with Heiken Ashi candles increases trading accuracy.
Conditions: The 5-minute Heiken Ashi candlestick chart. The EMA30 indicator. Open orders with an expiration time of 15 minutes or above.
How to open an order
+ Open an UP order when Heiken Ashi candlesticks penetrate EMA from below.
+ Open a DOWN order when Heiken Ashi candlesticks penetrate EMA from above.
EMA combines with reversal candlestick patterns
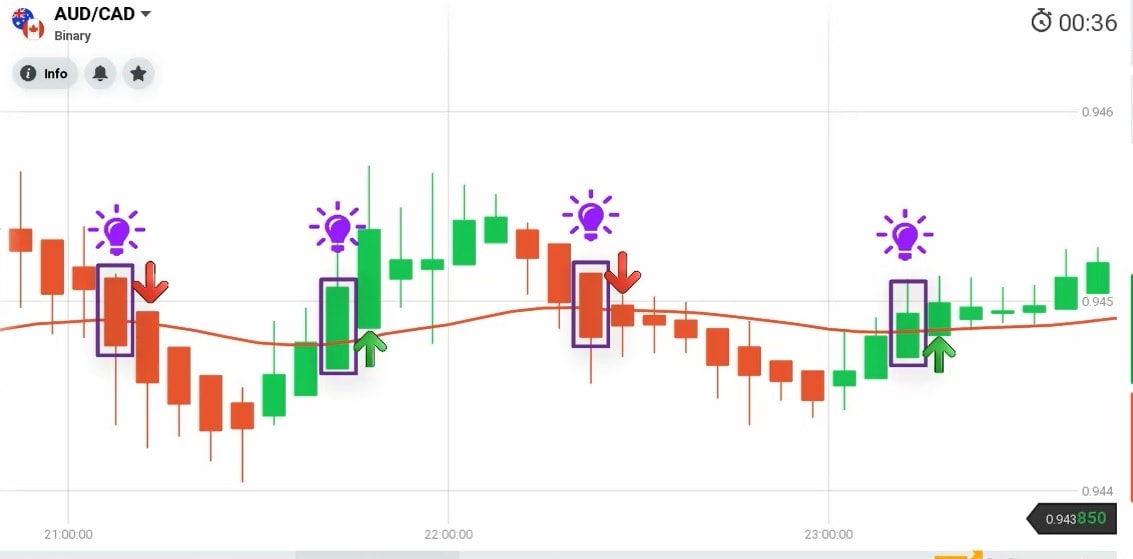
With this strategy, EMA30 will be the dominant trend indicator. We will open orders in continuation of the trend with the signal of candlestick pattern signaling the continuation of a trend.
Conditions: A 5-minute Japanese candlestick chart. The EMA30. Open orders with an expiration time of 5 – 10 minutes.
How to open an order
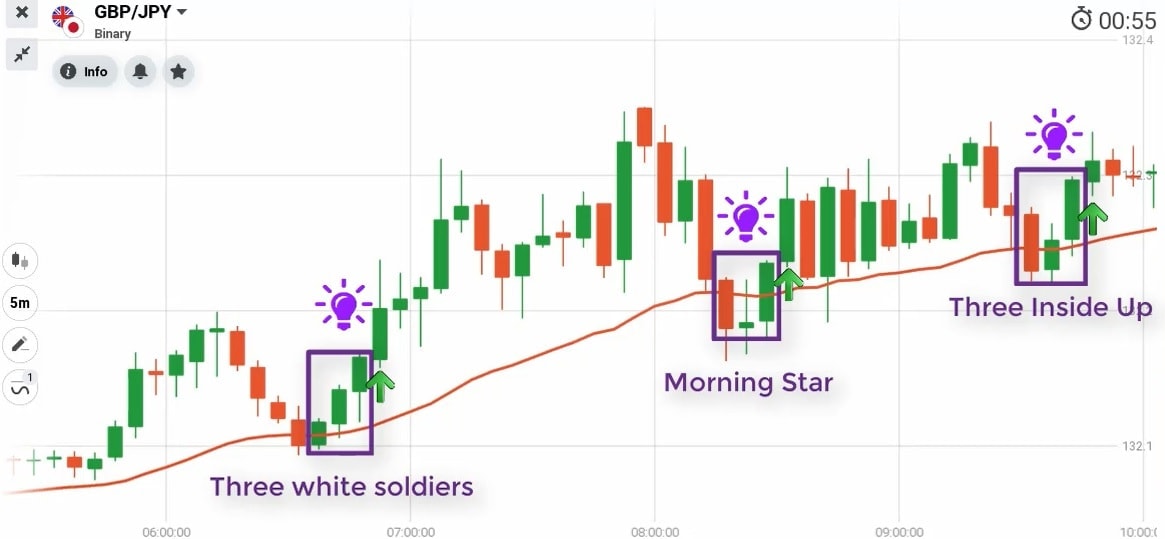
+ Open an UP order when the price is in an uptrend. The price hits EMA and forms a bullish reversal candlestick pattern (Bullish Harami, Three White Soldiers, Three Inside Up, Morning Star, etc.).
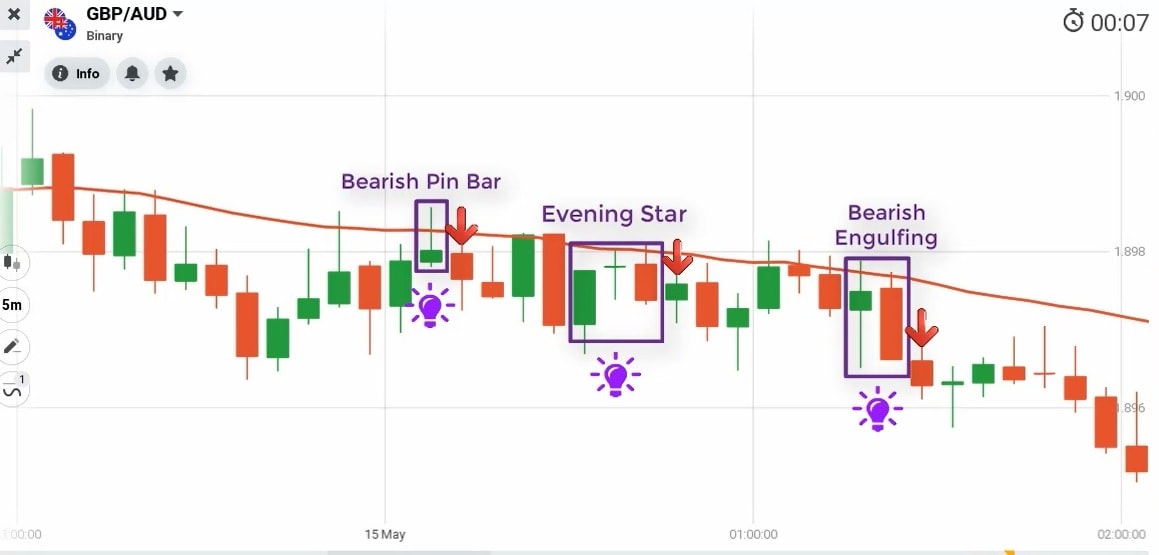
+ Open a DOWN order when the price is in a downtrend. The price hits EMA and forms a bearish reversal candlestick pattern (Evening Star, Bearish Engulfing, Bearish Pin Bar, etc.).
There will be many trading strategies as well as notes on how to use EMA in trading that we will present in the following articles. For now, open a DEMO account for yourself and practice to get to know the EMA. Goodbye and good luck.
Register an IQ Option account NowGet $10,000 Free for beginners
The post What Is EMA Indicator? How To Use EMA Efficiently In Trading appeared first on How To Trade Blog.
source https://howtotradeblog.com/what-is-ema-indicator/
No comments:
Post a Comment