One of the popular market analysis techniques in Forex is the use of SMA indicator. Using the SMA is the simplest, most effective way to identify market trends. In today’s article, I will guide you on how to use the SMA in Forex trading with the highest efficiency.
Register an Exness account NowGet $1,000 Free for beginners
What is the SMA indicator?
SMA means a simple moving average. SMA indicator is considered by trend traders as an indispensable support tool. SMA acts relying on past price movements to forecast future trend movements. Although the calculation of the SMA is very simple (price averages), the effect is great when used.
How does the SMA indicator work?
SMA is the simplest moving average. It is the average of closing prices over specified trading sessions.
For example, SMA (50) means the moving average of the 50 candles on the closing price of the previous 50 candlesticks.
The SMA belongs to the group of MA including SMA, EMA, and WMA. The remaining moving averages will be introduced to you in the following articles.
Each experienced trader uses the SMA for different purposes.
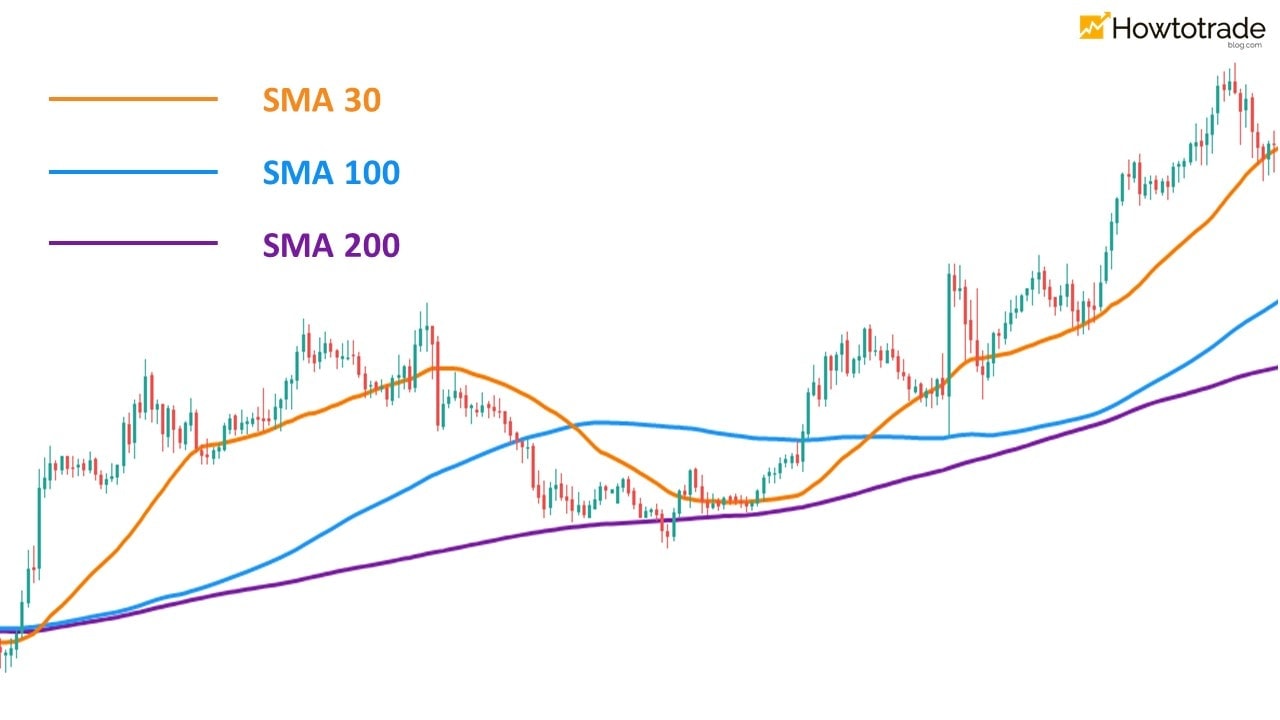
– SMAs used for long-term observation: SMA (100), SMA (200).
– For mid-term observation: SMA (30), SMA (50).
– SMAs for short-term use: SMA (10), SMA (14), SMA (20).
In the example below, you can see that in the short and medium term, prices have reversed from bullish to bearish. The price crosses the SMA 30 (orange), the SMA 100 (blue), and goes down. However, as using the SMA 200 with a long-term perspective, when the price touches the SMA 200 (purple), it rebounds and continues the uptrend.
In Forex, SMAs create dynamic levels that move with the price. This means that when the price touches these SMAs, it will likely bounce back or slow down. Depending on the SMA, these levels may be difficult or easy to break.
How to use SMA to determine price trends in Forex
The SMA helps investors find out both current and future price trends. The slope of the SMA reflects how fast or slow the price movement is.
Specifically:
(1) When the SMA is pointing up and the price creates a Japanese candlestick that stays above the SMA, the market is in an uptrend. The steeper the SMA is, the stronger the uptrend is.
(2) When the SMA is pointing down and the price creates a Japanese candlestick that stays below the SMA, the market is in a downtrend. The more sloping the SMA is, the stronger the downtrend is.
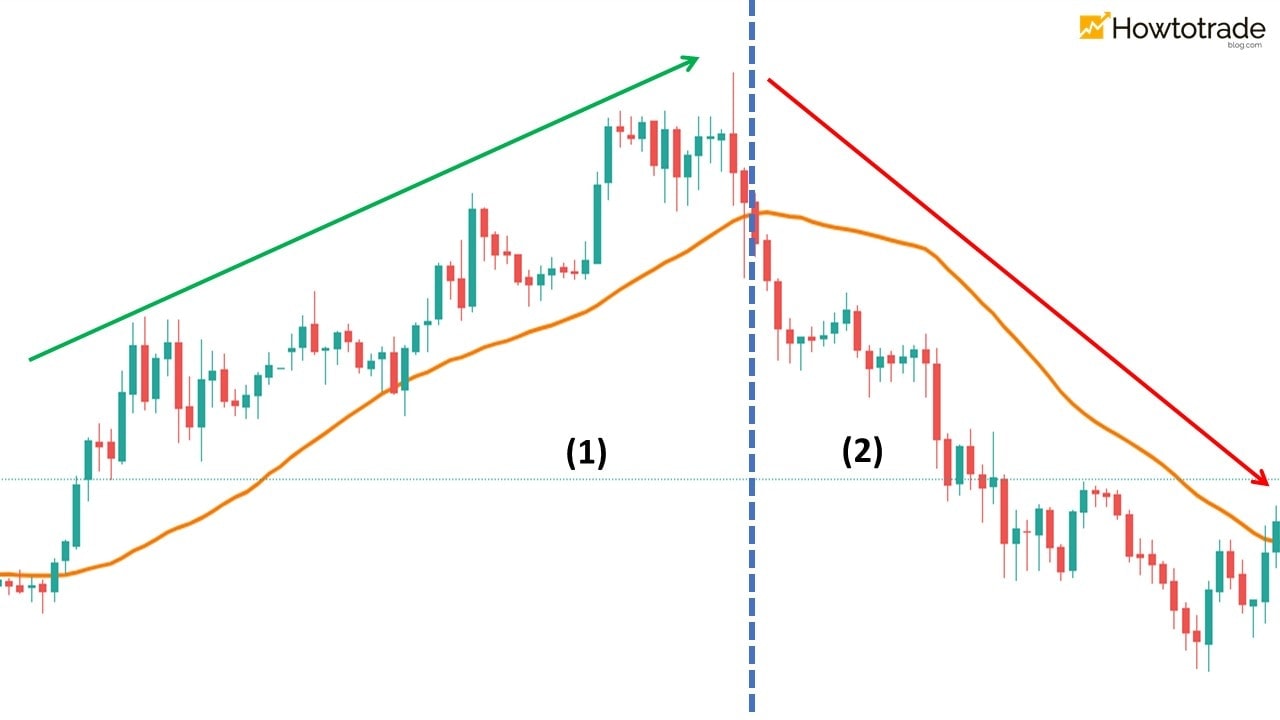
Especially: When the price crosses the SMA strongly, this is most likely a trend reversal signal.
How to trade Forex effectively with the SMA indicator
SMA is best used in predicting market trends. In this section, I will guide you to place orders with the SMA indicator. These are test transactions to get used to the SMA. You should not apply it to real accounts.
When opening an order, in order to optimize your profits, you need to clearly identify entry points, take-profit, and stop-loss. Doing this will make your account more secure.
Strategy 1. Trade Forex using a single SMA
This trading strategy is very simple. You just need the SMA 30 to open orders. The entry signal is when the price definitely cuts the SMA and develops a new trend.
Conditions: The H1 Japanese candlestick chart. The SMA 30 indicator.
Open a BUY order with the SMA 30 indicator as follows:
+ Entry Point: When the price crosses the SMA 30 from below with a bullish candle with a long body.
+ Stop-Loss: At the nearest Support before the price crosses the SMA 30.
+ Take-Profit: when the price touches old resistance levels that have been formed in the past.

Open a SELL order with the SMA 30 indicator as follows:
+ Entry Point: When the price crosses the SMA 30 from above with a red bearish candle with a long body.
+ Stop-Loss: At the nearest Resistance before the price crosses the SMA 30.
+ Take-Profit: when the price touches old support levels that have been formed in the past.

Strategy 2. Trade Forex using two combined SMAs
This is a popular trading strategy adopted by a large number of traders. The two SMAs used to open orders are SMA 30 and SMA 10.
Conditions: The H1 Japanese candlestick chart. The SMA 30 and SMA 10 indicators.
Open a BUY order with two SMAs as follows:
+ Entry Point: When SMA 10 cuts SMA 30 from above and widens.
+ Stop-Loss: At the nearest Support before the two SMAs intersect.
+ Take-Profit: when the price touches old resistance levels that have been formed in the past.

Open a SELL order with two SMAs as follows:
+ Entry Point: When SMA 10 cuts SMA 30 from below and widens.
+ Stop-Loss: At the nearest Resistance before the two SMAs intersect.
+ Take-Profit: when the price touches old support levels that have been formed in the past.

The technique of using SMA in trading is one of the basic skills that you need to master. In the following articles, I will guide you to build effective Forex trading strategies based on SMA indicator. Goodbye and see you again.
Register an Exness account NowGet $1,000 Free for beginners
The post What Is SMA Indicator? How To Trade Forex With SMA appeared first on How To Trade Blog.
source https://howtotradeblog.com/what-is-sma-indicator-forex/
No comments:
Post a Comment