Monday, May 11, 2020

What Is Gap? How To Use Gap Strategy For Trading

When looking at the financial chart, you sometimes come across an up or down gap. The appearance of that gap signals something to investors. This article will guide in detail what a Gap is and Gap trading means. There are two important types of Gap you need to know namely Breakaway and Runaway Gap as well as the meaning and how to trade using them.

Register an IQ Option account NowGet $10,000 Free for beginners

A video introduces Gap in technical analysis

What is a Gap?

A Gap (as its name) is the gap created when prices move sharply in the upward or downward direction. If the price bounces higher than the closing price of the previous candle, it is called a Gap Up.

Gap Up in the Japanese candlestick chart

Otherwise, if the price falls lower than the closing price of the previous candle, it is called a Gap Down.

Gap Down in the Japanese candlestick chart

The reasons why Gap appears

– On holidays of the financial market (such as Saturday and Sunday or federal holidays), there might be some big news of fluctuations. At the beginning of the next week (such as Monday) or the day after the holiday, the Gap is likely to appear.

– When there is an event (bad or good news) that is extremely powerful and affects the financial market, it may cause banks to sell off a currency.

– At major holidays like Christmas or year-end, it is the time when many banks in the world stop trading. This leads to the lack of continuity in the transaction which is a condition for the Gap to appear.

Two common Gap types and their meanings

Breakaway Gap

This type of Gap usually appears when the price breaks out of the support or resistance zone.

For example,

The price breaks out of the resistance zone by 1 gap (Gap Up). The market is likely to enter the uptrend. Also, the Gap Up becomes a Support zone.

Breakaway Gap
Breakaway Gap

Otherwise, the price breaks out of the support zone by 1 gap (Gap Down). There is a high probability that the market will enter a downtrend. And now, the Gap Down becomes a Resistance zone.

Runaway Gap

This type of Gap appears in continuation of a trend when the market is in an up or downtrend.

For example,

The price is in an uptrend, creating a price gap (Gap Up) and continues to increase sharply.

Runaway Gap
Runaway Gap

Conversely, the price is in a downtrend, creating a price gap (Gap Down). The price will then continue to fall.

How to trade Binary Options with Gap

Using Breakaway Gap as Support/Resistance

If you use Breakaway Gap as an entry signal, then Gap Up = support zone. Gap Down = resistance zone.

This is considered a price retest or filled Gap strategy. When the price strongly breaks out of a support or resistance zone and creates a gap, it tends to go back to test or in other words, fill the gap (recover the previous price gap).

Requirements: A 5-minute Japanese candlestick chart. The expiration time of 15 minutes

How to open an option:

UP option: The price goes into the Gap Up.

How to open an UP option with the Breakaway Gap

DOWN option: The price goes into the Gap Down.

How to open a DOWN option with the Breakaway Gap

Use Runaway Gap to trade with the trend

This is the long-term trading (long expiration time) in Binary Options. You can combine it with 1 trend indicator such as SMA30.

Requirements: A 5-minute Japanese candlestick chart. The expiration time of 30 minutes or above.

How to open an option:

UP option: The price is above the SMA30 and creates a Gap Up.

How to open an UP option when combining Runaway Gap with SMA30

DOWN option: The price is below the SMA30 and creates a Gap Down.

How to open a DOWN option when combining Runaway Gap with SMA30

Notes when using Gap trading

– The Gap is a probabilistic tool that needs to be combined with indicators such as SMA, RSI, MACD, etc.

– Determine support or resistance levels with Gap types to open orders correctly.

– Verify whether the Gap is with familiar candlestick patterns or not to increase the reliability

Let’s experience to trade binary options using Gap as an entry signal. This strategy might work on you, so you should try it on a Demo account first. Once you understand how to operate and the advantages of Gap trading, then you can think about making money.

Register an IQ Option account NowGet $10,000 Free for beginners

The post What Is Gap? How To Use Gap Strategy For Trading appeared first on How To Trade Blog.


source https://howtotradeblog.com/what-is-gap/

Sunday, May 10, 2020

What Is Marubozu Candlestick? Meaning And How To Trade In The Most Reasonable Way

Marubozu candle is one of the most important signal candlesticks. You may encounter it very often in the Japanese candlestick chart. Marubozu candlestick pattern is considered a sign of the upcoming price trend.

In this article, How To Trade Blog will show you how to identify a Marubozu candlestick. Also, we will show you how to combine it with a number of reliable indicators to open reasonable options.

Video on how to identify and trade with the Marubozu candlestick pattern

What is Marubozu candlestick?

Marubozu candlestick is a single-colored signal candlestick. It represents a strong buying or selling force appearing on the market.

What is Marubozu candlestick?

Characteristics of Marubozu candle pattern

Marubozu candle has a very long body. The closing prices and opening prices are often far apart. There is no shadow (only body with 1 single color for each). The colors are green (bullish Marubozu candlestick) and red (bearish Marubozu candlestick).

Characteristics of Marubozu candle pattern

Green candlestick (Marubozu Bullish): It demonstrates a sharp increase in prices. The buyers dominate and overwhelm the sellers. The opening price coincides with the lowest price. And the closing price coincides with the highest price.

Red candlestick (Marubozu Bearish): It demonstrates a sharp decrease in prices. The opening price coincides with the highest price. And the closing price coincides with the lowest price.

Meaning of Marubozu pattern

When Marubozu appears, it is likely that the price will develop a new trend.

The length of Marubozu and the movement of the price determine the accuracy of the candlestick. For example,

(A) The price continuously increases sharply => (B) Green Marubozu => There is a high probability that prices will continue to increase in the near future.

Meaning of Marubozu pattern

(A’) The price rises sharply in the beginning, but then stops rising and moves sideways => (B’) Green Marubozu => The probability of the price to increase in the near future is not high.

Meaning of Marubozu pattern

So, in 2 cases, both are green Marubozu candlesticks. However, the price movements are different => The accuracy of the Marubozu candle is also different.

To understand more about the significance of Japanese candlestick patterns, you can refer to this article: What is Japanese candlestick? The Truth And Importance Of The Japanese Candlestick Chart

How to trade options with Marubozu

Marubozu is a candlestick signaling an upcoming trend. However, to open high-precision options, you need to use it with a number of trend indicators. For example, SMA30, MACE or Support/Resistance, etc.

How to open options using the Marubozu candlestick pattern combined with the SMA30 indicator

Conditions: A 5-minute candlestick chart + SMA30 indicator.

The SMA30 is a trend indicator. When the price is above the SMA30, the market is trending up. Conversely, when the price is below the SMA30, the market tends to fall.

How to open an option:

Open an UP option: The price surpasses the SMA30 from below with a green Marubozu.

Explanation: When the price surpasses the SMA30 from below, the market is likely to reverse from down to up. The green Marubozu candle is an important confirmation signal for an uptrend.

How to trade with Marubozu and SMA30

Open a DOWN option: The price crosses the SMA30 from above with a red Marubozu candlestick.

How to trade with Marubozu and SMA30

How to trade options with Marubozu and Support/Resistance

Conditions: A 5-minute candlestick chart

How to open an option:

Open an UP option: The price breaks out of the resistance with a green Marubozu candle.

Explanation: When the price breaks out of the resistance, the market tends to enter an uptrend. The green Marubozu candle is a reliable confirmation signal for an uptrend.

How to trade binary options with Marubozu and Resistance

Open a DOWN option: The price breaks out of the support with a red Marubozu.

How to trade binary options with Marubozu and Support

Notes when trading options with Marubozu candlestick

The longer the expiration time of the candlestick chart is, the more reliable the Marubozu candlestick becomes. For example, A 5-minute candlestick chart is more accurate than a 1-minute candlestick chart.

The longer the Marubozu candle is, the higher the probability becomes.

If you are trading options on-trend, the expiration time must be long enough.

I hope this article has answered the following question. What is Marubozu candle? And it also shows you how to open reasonable options with this candlestick pattern.

Register an IQ Option account NowGet $10,000 Free for beginners

The post What Is Marubozu Candlestick? Meaning And How To Trade In The Most Reasonable Way appeared first on How To Trade Blog.


source https://howtotradeblog.com/what-is-marubozu-candlestick/

Saturday, May 9, 2020

What Is Pin Bar Candlestick? How To Use It To Trade Binary Option

It is not natural that technical analysts separate Pin Bar from other Japanese candlesticks. In this article, I will show you how to identify a Pin Bar candle pattern. Also, I will explain what the meaning of Pin bar candlestick is as well as introduce effective binary options trading strategy to you.

Register an IQ Option account NowGet $10,000 Free for beginners

Video on how to identify and trade Binary Options with Pin Bar

In this article, we will introduce what a Pin Bar candlestick is. The characteristics, meaning, and usage of Pin Bar candle patterns in options trading are also available.

What is Pin Bar candlestick?

When entering the financial market, the first thing you see is the Japanese candlestick chart. It has distinct shapes that reflect the price action of the market. And among them is a very different candlestick that looks like a pin – Pin Bar.

Pin Bar is a candle shaped like a pin with an outstanding long shadow and small body.

What is Pin Bar candlestick?

Characteristics of Pin Bar

Pin bar candle must have the following features:

– Tail (aka wick or shadow): The Pin Bar is a candle with a long upper or lower tail. That is the highlight of a Pin Bar that shows a strong rejection of prices. The Pin Bar tail must be at least 2/3 of the length of the candlestick bar.

– Body: This is the zone between the opening and closing prices. The body of a candlestick must not be longer than 1/3 of the length of the candlestick bar. The opening and closing prices of adjacent bars are close to each other or maybe equal.

– Pin Bar nose: This is the opposite of the tail. A Pin Bar does not necessarily have a nose. Sometimes, the Pin Bar doesn’t have a nose because it opens and closes right at the closing price of the candle. The smaller the Pin Bar nose is, the better it becomes.

Pin Bar candlestick patterns

Two Pin Bar candlestick patterns

As for the Bullish Pin Bar, the body is closer to the top of the candlestick. Conversely, for the Bearish Pin Bar, the body of the candle stays closer to the bottom of the candlestick.

Pin Bar candle patterns

Meaning of Pin Bar

When the Pin Bar candle appears, it signals that the price is rejecting a specific price range. It expresses through the strength of the tail of the Pin Bar candlestick.

Visually, the Bullish Pin Bar and the Hammer candlesticks are the same. And the direction of prices is also the same.

Bullish Pin Bar is similar to Hammer candlestick

Bearish Pin Bar has a similar pattern to a Shooting Star candlestick. When looking at the price action of these 2 candles, there is not much difference.

Bearish Pin Bar is similar to Shooting Star candlestick

Regarding the price action on the chart, the Hammer candle is similar to the Bullish Pin Bar. And the Shooting Star candle has the same movement as the Bearish Pin Bar.

To understand the meaning of Japanese candlesticks, you can see details in this article: What Is The Japanese Candlestick? The Truth And Importance Of The Japanese Candlestick Chart.

How to trade binary options with Pin Bar

Currently, the methods of trading using Pin Bar are very diverse. Depending on the view of each trader about the market, they can apply appropriate strategies to improve efficiency. You can open options with Pin Bar candles individually or combine them with trend indicators such as SMA, Alligator, etc., to improve accuracy.

Binary Options trading strategy only with Pin Bar

Conditions: A 5-minute Japanese candlestick chart. The expiration time of 5 minutes.

Open an UP option: A Bullish Pin Bar appears on the candle chart.

Open a DOWN option: A Bearish Pin Bar appears on the chart.

How to trade options with Pin Bar

This is how to trade binary options according to the color of the candlestick. This means: Once the previous Pin Bar has just closed, you must open an order immediately to bet the next candlestick.

How to open options using Pin Bar and Support/Resistance

Conditions: A 5-minute candlestick chart. The expiration time of 15 minutes or above.

How to open an option:

Open an UP option: A Bullish Pin Bar appears and touches the support zone.

Explanation: When prices touch the support, the probability of the market continues to rise is high. Bullish Pin Bar candle is considered a safe entry signal for UP options.

How to trade options using Bullish Pin Bar and Support

Open a DOWN option: A Bearish Pin Bar appears and touches the resistance zone.

How to trade options using Bearish Pin Bar and Resistance

Things to note when using Pin Bar to trade binary options

The longer the candle time period of the Pin Bar candlestick (Japanese candlesticks chart) is, the higher the accuracy becomes.

The shorter the nose is, the safer the Pin Bar becomes. The tail of the candle must be as long as possible, accounting for at least 2/3 of the length of the candle. The body of the candle is short, lying completely on one side or the bottom of the candlestick bar.

To increase the accuracy of options, you should combine Pin Bar candle pattern with trend indicators. Open long trendy options to achieve the highest level of accuracy.

This article may help you understand more about the Pin Bar candle patterns with relatively high safety. Let’s experience and complete Pin Bar trading strategy with a Demo account.

Register an IQ Option account NowGet $10,000 Free for beginners

The post What Is Pin Bar Candlestick? How To Use It To Trade Binary Option appeared first on How To Trade Blog.


source https://howtotradeblog.com/what-is-pin-bar-candlestick/

Friday, May 8, 2020

What Is Doji Candlestick? How To Identify And Trade With Doji Candlestick Patterns

Some candlesticks have small bodies, but the upper or lower shadow is unusually long. When they appear on the candlestick chart, they will attract attention because of the difference. So, experienced traders use it as a signal to enter secure transactions. In this article, I will introduce what a Doji candlestick is. What is the meaning and how to use it in binary options trading?

Register an IQ Option account NowGet $10,000 Free for beginners

A video introduces how to identify and use Doji candlestick

What is Doji Candlestick?

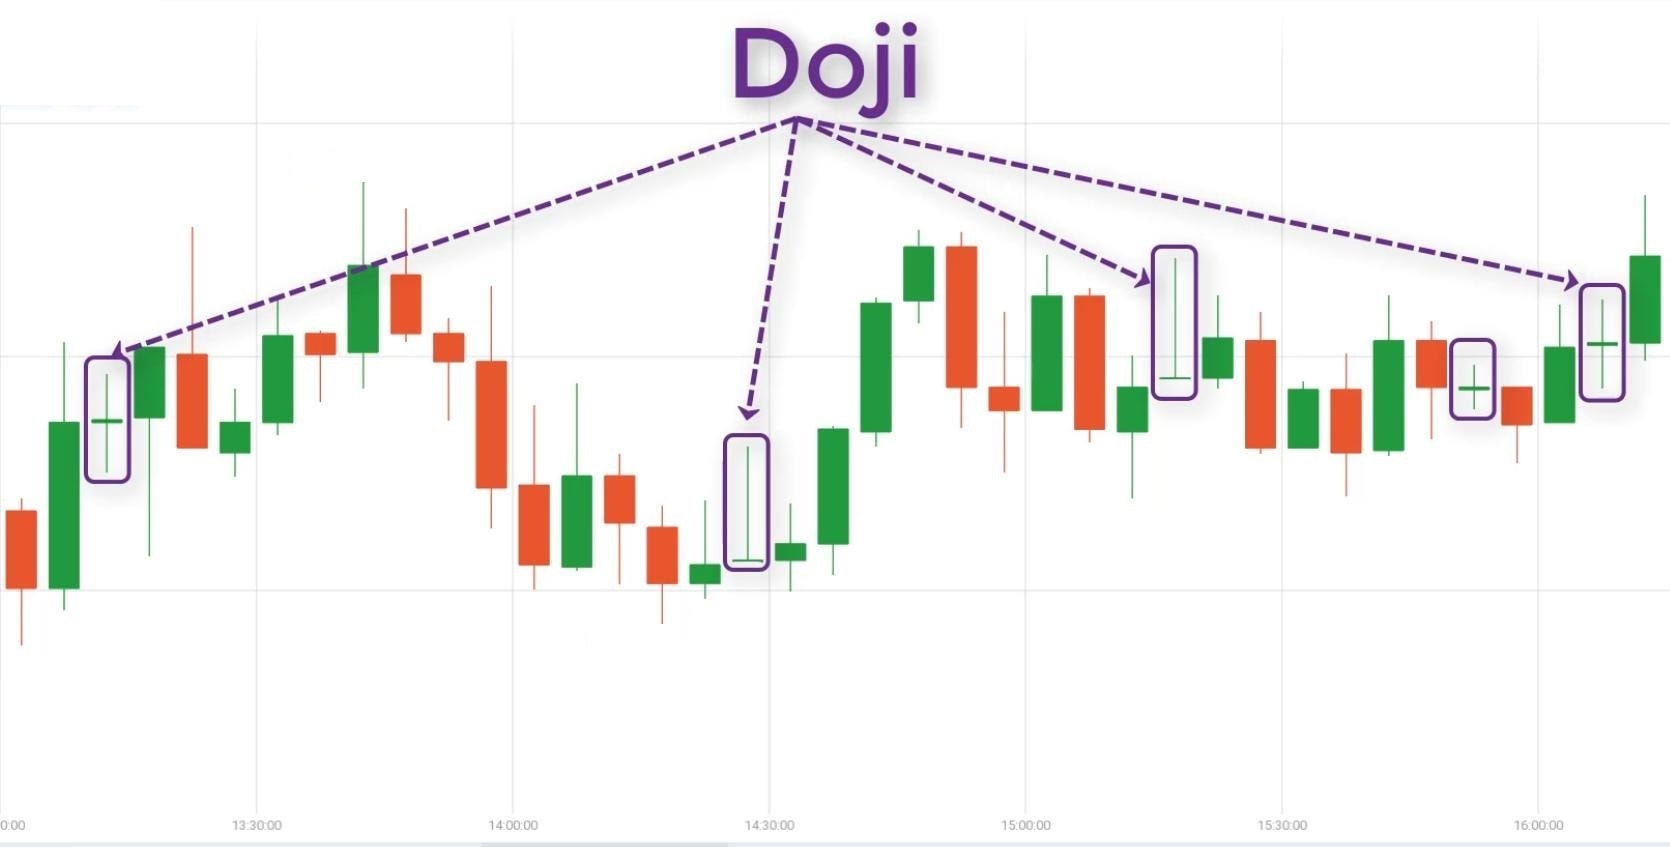
A Doji candlestick is a candlestick pattern that represents an indecisive crowd in the market. It can be used for both up and down markets. However, the Doji candlestick pattern has many variations and each variation has a different characteristic. This can lead to misconceptions if you do not fully understand.

Doji is a special signal pattern that is easy to identify when using Japanese candlestick charts to forecast and analyze prices.

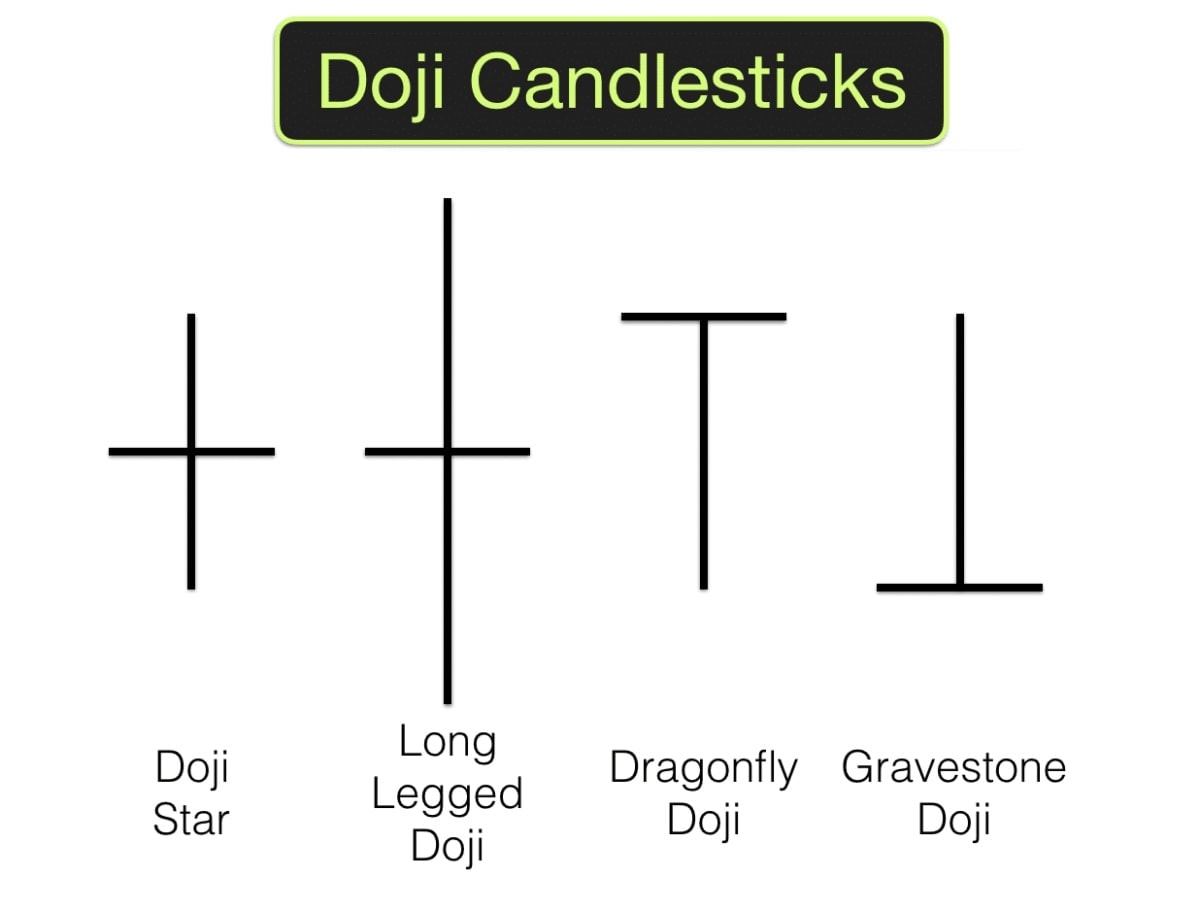
Doji candlestick patterns

Characteristics of Doji candlesticks

Doji Star: This is a standard Doji candle with the same closing and opening prices. The upper and lower tails of the candle are of normal length.

Long-legged Doji: This is a Doji which has an upper and lower tail that is longer than the standard candlestick.

Doji Star and Long-legged Doji

Dragonfly Doji: This is a Doji candlestick with a very long lower tail, but (almost) without an upper tail. Opening price = Closing price = Highest price. Looking at the Japanese candle chart, it is very much like a dragonfly.

Gravestone Doji: This is a Doji candlestick with a very long upper tail, but (almost) without a lower tail. Opening price = Closing price = Lowest price. This candle pattern looks similar to a gravestone.

Dragonfly Doji and Gravestone Doji candlestick

Meaning of the Doji candlestick pattern

Doji Star: It shows the indecision of the market. The opening price is equal to the closing price which lies in the middle of the candlestick. And when the price hesitates, it’s time for you to observe.

The price chart of Doji Star

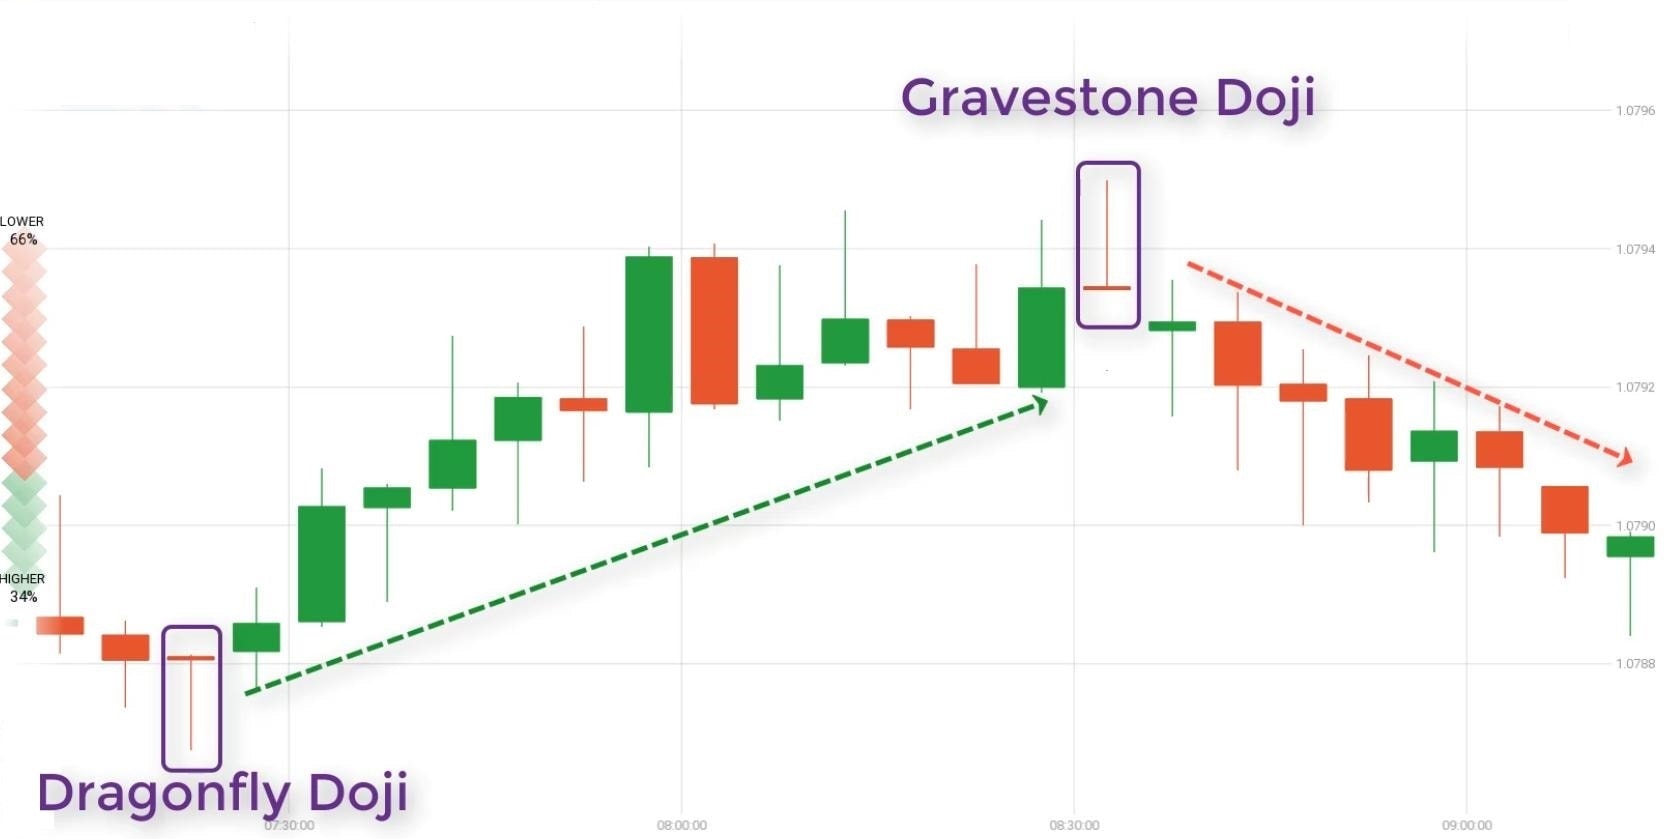
Dragonfly Doji: This is one of the candle patterns that shows the determination of the market. In the beginning, the market drops sharply, but it increases decisively after that. This candlestick usually appears at the bottom of the market.

The price chart of Dragonfly Doji

Gravestone Doji: It’s completely opposite to the Dragonfly Doji. The price increases sharply during the first stage but then falls decisively in the later stage. This is a candlestick pattern that usually appears at the top of the market.

The price chart of Gravestone Doji

How to trade binary options with Doji candlesticks

When a Doji candlestick pattern appears after an up or downtrend in the market, it will reflect the slowdown of that trend.

In other words, when the Doji candle pattern appears, it shows the balance between supply and demand of the market. After the Doji is broken, the market may reverse or resume the previous trend.

Open a Binary option using the Doji candlestick combined with support or resistance

Conditions: A 5-minute Japanese candlestick chart. The expiration time of 5 minutes.

Open an UP option: The Doji candle appears. The price touches the support level.

Enter an UP option when a Doji hits the support

Open a DOWN option: The Doji candlestick forms right at the resistance level.

Open a DOWN option when a Doji hits the resistance

Dragonfly Doji and the support level

Conditions: A 5-minute Japanese candlestick chart. The expiration time of 5 minutes.

Open an UP option: The Dragonfly Doji touches the support zone.

Open an UP option when the Dragonfly Doji hits the support

Gravestone Doji and the resistance level

Conditions: A 5-minute Japanese candlestick chart. The expiration time of 5 minutes

Open a DOWN option: The Gravestone Doji candle touches the resistance zone.

Open a DOWN option when the Gravestone Doji hits the resistance

Things to keep in mind when trading with Doji candlestick

– A Doji candlestick appears at a lonely peak. It means there are gaps before and after it. Then, it will be a sign of a reversal with high precision.

– If the bullish Doji candles in sequence appear to be gradually shorter, it signals that the bullish force is weakening. The probability of price reversal is very high. Conversely, if bearish Doji candles in sequence appear to be gradually shorter, the bearish force might have been eliminated. The reversal will likely appear.

– To increase safety when trading Binary Options, you should combine Doji candlesticks with other indicators.

This article may help you gain more knowledge about Doji candlesticks. However, to make perfect transactions, you should trade and practice it on a Demo account. If there is a steady winning rate for several consecutive weeks on the Demo account then you can start trading with real money.

Register an IQ Option account NowGet $10,000 Free for beginners

The post What Is Doji Candlestick? How To Identify And Trade With Doji Candlestick Patterns appeared first on How To Trade Blog.


source https://howtotradeblog.com/what-is-doji-candlestick/

Thursday, May 7, 2020

What Is The Japanese Candlestick? The Truth And Importance Of The Japanese Candlestick Chart

Questions: Why are 99% of traders trading via Japanese candlestick charts? What and why is this kind of candlestick used by many traders?

Answers: Based on the candlestick charts, you will be able to analyze price behavior. From there, you can also predict the next trend of prices and make the most accurate trading decisions.

And this article will probably be the most detailed article, summarizing all the most important knowledge about Japanese candlestick.

Register an IQ Option account NowGet $10,000 Free for beginners

What is the Japanese candlestick?

Japanese candlestick (aka Candlestick, candle) is a pattern that shows the whole price movement in a given period of time. There are two basic colors Green and Red determining the direction of the price. Green = bullish candlestick = up price. Conversely, red = bearish candle = down price.

What is the Japanese candlestick?

For example,

(A) The price is up within 5 minutes => (B) Creating 1 green candlestick within a period of 5 minutes => (C) One 5-minute candlestick = Five 1-minute candlesticks.

Green candlestick
Green candlestick

(A) The price is down within 5 minutes => (B) Creating 1 red candlestick within a period of 5 minutes => (C) One 5-minute candlestick = Five 1-minute candlesticks.

Red candlestick
Red candlestick

So the Japanese candlestick chart consists of consecutive candles. Depending on the time frame (1 minute, 5 minutes, 30 minutes, 1 hour, etc.), there will be different candlestick charts.

For example, when traders use the “1-minute candlestick chart” => It means: They are using the Japanese candle chart with the 1-minute time frame (the candlestick time period is 1 minute).

A 1-minute candlestick chart

“5-minute candlestick chart” => Japanese candle chart with the 5-minute time frame (the candlestick time period is 5 minutes).

A 5-minute candlestick chart

The main elements of Japanese candlestick

The Japanese candle consists of 2 main elements: Body and shadow. And it is made up of 4 characteristics of the price: Opening price, closing price, highest price, and lowest price.

For example,

Up price: Opening and closing prices create the body of the green candle. Upper shadow = highest price, lower shadow = lowest price.

Bullish green Japanese candlestick

Similarly, down price: The body of the candlestick is red.

Bearish red Japanese candlestick

Stable price: Neutral and colorless candlestick (without body). Long shadow, upper shadow = highest price, lower shadow = lowest price.

Neutral candlestick

The most important meaning of Japanese candlestick

The reasons Jap candlestick and Jap candlestick patterns are used by 99% of traders are because they can analyze and predict price behavior in the market.

For example,

1.

Meaning of the Japanese candlestick

(A) This is a bullish candle (green) with a candlestick time period of 30 minutes.

(B) It consists of 3 bullish candles (green) with a 10-minute candlestick time period.

(C) Behavior: The price continuously increased over a period of 30 minutes.

=> Prediction: The price trend would continue to increase in the near future.

2.

Meaning of the Japanese candlestick

(A) This is a special candlestick (small upper body, long shadow) with a candlestick time period of 30 minutes.

(B) It consists of 3 10-minute candlesticks.

(C) Behavior: The price dropped in the first 10 minutes, but then stopped (balanced) and rebounded sharply in the last 10 minutes

=> Prediction: The price tends to continue to increase in the near future.

3.

Meaning of the Japanese candlestick
Meaning of the Japanese candles

(A) A special 30-minute candlestick (closing price = opening price).

(B) It consists of 3 continuously up and down 10-minute candlesticks.

(C) Behavior: The price went up and down continuously, but after 30 minutes it returned to the initial price (Opening price = closing price).

=> Prediction: The price would have strong fluctuations in the future. Focus on observation and prepare for transactions.

Conclusion

In transactions, correct analysis => Correct predictions. Only with a correct prediction, you may be able to open profitable orders. The money will go straight to your pocket when you enter correct transactions. So, Japanese candlestick and Japanese candlestick charts are the tools for you to make the correct analysis.

The longer the time frames are, the clearer meaning the Japanese candles provide. At the same time, the abilities to analyze and predict are also more accurate. For example, A 5-minute candlestick chart will give better results than a 1-minute candlestick chart.

Thank you for reading the article on what the Japanese candle is. There are many other articles that go into detail about the Japanese candlesticks and candlestick patterns that Howtotrade Blog will update in the near future. See you in the following articles.

Register an IQ Option account NowGet $10,000 Free for beginners

The post What Is The Japanese Candlestick? The Truth And Importance Of The Japanese Candlestick Chart appeared first on How To Trade Blog.


source https://howtotradeblog.com/what-is-japanese-candlestick/

Tuesday, May 5, 2020

Olymp Trade Account – 4 Login Errors And Solutions

Your Olymp Trade account cannot be logged in. The system continuously reports an error. You don’t know how to troubleshoot it. Don’t worry! How To Trade will list out 4 login errors in Olymp Trade. At the same time, we will guide you on how to troubleshoot them.

Register an Olymp Trade account NowGet $10,000 Free for beginners

4 Olymp Trade login errors and solutions

Error 1: Unexpected Olymp Trade account blocked

There is only one reason why your account is locked out or blocked. This is because you have activities that violate an Olymp Trade agreement or trading policy.

Unexpected Olymp Trade account blocked

Common causes:

(1) The age for opening an Olymp Trade account is under 18.

(2) There is doubt about money laundering using Olymp Trade transactions.

(3) An individual registers multiple accounts.

(4) Try to log into at multiple locations and IP addresses. This is a doubt of your Olymp Trade account getting hacked.

(5) Do transactions from countries where Olymp Trade is not available.

What to do when Olymp Trade locks your account

– Use the chatbox to report this issue.

– Directly call the Olymp Trade Hotline immediately.

How to contact with the Olymp Trade platform

Error 2: No Olymp Trade registration information found

This error appears when you enter the wrong email or wrong login information. Simply because when creating an account, you choose to register with Facebook, Google, etc.
Therefore, when you log back in or log in from another computer, you will not be able to access Olymp Trade.

Register Olymp Trade using Facebook or Google Account
Register Olymp Trade using Facebook or Google

How to handle this login error

Make sure you use the same login method as when you registered.

If you register by using a social network account, please log in to your account through this social network.

In case you register by using an email and password, use this email and password to log into your account.

If you have tried all of the above methods but still cannot log in, contact the customer support of Olymp Trade. They will quickly handle your query in less than 5 minutes.

Error 3: Not receiving the 2-factor authentication message from Olymp Trade

You have applied the 2-factor authentication function for your Olymp Trade account via SMS. However, due to geographical reasons, it is not always possible for Olymp Trade to send the authentication code to you immediately.

Two-factor authentication in Olymp Trade

There are 2 solutions in this case

(1) Immediately contact the support to help remove the two-factor authentication from your account.

(2) Use the two-factor authentication security via the Google Authenticator app.

Error 4: Incorrect password or Invalid Captcha

Forget your password or forget to tick the “Captcha” box (to confirm “I am not a robot”) are also the reasons why you cannot log into Olymp Trade.

The solution is very simple

If you forgot your Olymp Trade login password, you only need to reset your password.
Also, every time you log in, be sure to tick the captcha box.

Captcha box in Olymp Trade

So, if there is any reason why you cannot login to Olymp Trade, leave your comments below. We will assist you.

Register an Olymp Trade account NowGet $10,000 Free for beginners

The post Olymp Trade Account – 4 Login Errors And Solutions appeared first on How To Trade Blog.


source https://howtotradeblog.com/olymp-trade-account-4-login-errors-and-solutions/

Friday, May 1, 2020

6 Frequently Asked Questions FAQ During Withdrawal In Olymp Trade

Currently, Olymp Trade has provided traders with a large number of online payment methods for deposit and withdrawal. However, this leads to certain questions during withdrawing money. For example, the bank card has expired, the withdrawal processing time has been over but your bank account balance has not been credited, etc. Today we will answer all these questions (FAQ) for you when withdrawing money from the Olymp Trade account.

Register an Olymp Trade account NowGet $10,000 Free for beginners

Olymp Trade FAQ about withdrawal

This is an overview of our knowledge when participating in trading, depositing, and withdrawing in Olymp Trade.

When will the money be deducted from my account balance after making a withdrawal request?

Your Olymp Trade account balance is deducted only when the platform approves your withdrawal request. This means that if the platform has not approved, you can still continue to trade with the entire balance in your account.

However, by the time Olymp Trade considers your withdrawal request, if your account no longer has enough balance for the withdrawal request, your request will be canceled.

For example, Your balance is $100. You place a withdrawal request of $80. After placing the withdrawal request, if the platform has not deducted your balance, you can still continue trading with that $100.

If the withdrawal request is processed in several installments. Then the withdrawn amount will be deducted from your account in installments to transfer to you. So, you can use your entire account balance until your withdrawal request is processed.

When will the money be deducted from my account balance after making a withdrawal request?

How do I withdraw money to an e-wallet although I deposit with a Visa card and vice versa?

This is also a common question for many new investors. In case your VISA card or e-wallet has expired or been no longer available. If you want to withdraw to another payment gateway, you will need to contact with Olymp Trade to receive detailed processing instructions.

How do I withdraw money to an e-wallet although I deposit with a Visa card and vice versa?

Why can’t I withdraw all my money to my online banking account or e-wallet at one time?

Payment systems have limits on the maximum deposit/withdrawal amount. Therefore, large payments will be divided into many small ones. Olymp Trade will process all these small payments simultaneously.

Why can’t I withdraw my profit to my bank account?

You may encounter this problem when your bank refuses to accept the money transferred from Olymp Trade which is larger than the deposited amount. Regarding this, Olymp Trade will ask you to provide an e-wallet so that withdrawal requests are still processed successfully.

The bank refused to accept the profit from Olymp Trade

The withdrawal request has been successfully processed. But after 5 days, the money has not been credited to my account yet

After Olymp Trade processes your request, the money is sent to the bank of the e-wallet, online banking or bank account you used to deposit. The amount of time that it takes to credit your account balance depends on the bank. It is usually from 2 to 3 working days. If you do not receive your payment after this period of time. You should contact your bank for an explanation.

Your bank may also decline your payment for some reason. In this case, Olymp Trade will pay via e-wallet for you.

Notes: You may have exceeded the maximum limit of the amount of deposit or withdrawal in a day. At that time, contact the bank or technical support of the electronic payment system you use.

How to handle when the money is delayed beyond the withdrawal processing time in Olymp Trade

The payment card has expired. How to add a new card and remove an old one

If you are unable to use your bank card, it may be because your bank card is lost, expired, or locked, etc. You must notify the Olymp Trade support before you submit a withdrawal request. If you have sent a request, you should also notify the technical support. Then, the platform support will instruct you to solve this problem.

Change payment method in Olymp Trade

Conclusion

The above is how to handle problems occurring when withdrawing and depositing money in Olymp Trade. This is a very necessary skill for you before participating in trading. We hope that the article about Olymp Trade FAQ is useful to you. Leave your questions below if you have anything unclear about this.

Register an Olymp Trade account NowGet $10,000 Free for beginners

The post 6 Frequently Asked Questions FAQ During Withdrawal In Olymp Trade appeared first on How To Trade Blog.


source https://howtotradeblog.com/olymp-trade-withdrawal-faq/