Saturday, September 12, 2020

What Is A Wedge Pattern? How To Use The Wedge Pattern Effectively

This is to continue the series of articles sharing about chart patterns in Howtotradeblog. Today, I will bring to you a new one. It is the Wedge pattern. The Wedge pattern is an effective trading signal for Forex traders around the world. Join me in this article to learn about this special chart pattern.

Register an IQ Option account NowGet $10,000 Free for beginners

What is the Wedge pattern? Characteristics and how to identify

Wedge is a popular chart pattern in Forex trading. This is a form of recovery or accumulation of price after a strong trend. Morphologically, the Wedge pattern is a narrowing price channel with the two support and resistance levels converging to one point to the right. This pattern ends when the price breaks out of the resistance or support and creates a new trend.

What is a Wedge pattern? Characteristics and how to identify

In some cases, the price can retests the level just broken and then return to create a new trend in the opposite direction with the wedge. If you don’t know what retest is, please review this article: What is Retest?

Types of Wedge patterns

There are 2 types of Wedge patterns: Rising Wedge and Falling Wedge.

Rising Wedge patterns

The rising wedge pattern is a narrowing price channel with the 2 resistance and support levels pointing up the right corner. After creating a rising wedge, the price will usually break out of the support to enter a downtrend.

The pattern often appears in a downtrend as a form of accumulation. After that, the price breaks out of the support and continues to decline.

An example of the rising wedge pattern appearing in a downtrend

It can also appear at the top of an uptrend and signal a trend reversal from bullish to bearish.

The rising wedge example in an uptrend

Falling Wedge patterns

This is a narrowing price channel with the two support and resistance levels pointing down. After creating a falling wedge, the price will usually break out of the resistance and create an uptrend.

Falling Wedge patterns

Unlike Rising Wedge, Falling Wedge usually appears during an uptrend and is a signal for a new bull run in price.

An example of the falling wedge pattern appearing in an uptrend

Or it can also be at the bottom of a downtrend, signaling a bearish to bullish reversal.

The falling wedge example in a downtrend

Characteristics of the Wedge pattern

+ When the breakout is in the opposite direction of the wedge, it will be more accurate.

+ The steeper the wedge is, the more accurate the signal gives.

How to trade Forex and binary options with the Wedge pattern

Trade Forex

I will show you how to open a Forex order in the most detailed and effective way using the Wedge pattern. Watch it carefully as I will illustrate the best entry point, stop-loss, and take-profit with this pattern.

The general rule for trading using this pattern is to wait for the breakout or retest of the price and then open the order.

+ With a Rising Wedge, we will open a DOWN order when the price breaks out of the support and goes down.

+ With a Falling Wedge, we will open an UP order when the price breaks out of the resistance and goes up.

Please go through the following images to better understand.

For the Rising Wedge

There are two cases where you can open a DOWN order with a rising wedge. The first one is when it comes after an uptrend and the price breaks out and then goes down.

+ Entry Point: Right after the candlestick breaks out of the support.

+ Stop-Loss: At the highest resistance level of the Wedge pattern.

+ Take-Profit: From the entry point, the distance is equal to the maximum width of the rising wedge pattern.

How to trade Forex with a Rising Wedge

The second case is when a rising wedge appears in a downtrend signaling a continuation of the trend. You can also open a DOWN order when the price breaks out and goes down. Take-profit and stop-loss points are similar to the first case.

How to trade Forex with a Rising Wedge

For Falling Wedge

You can only open UP orders in the following 2 cases with a falling wedge.

In the first case, the price is in an uptrend. The falling wedge pattern appears as an accumulation period for a new increase.

+ Entry Point: Right after the candlestick breaks out of the resistance.

+ Stop-Loss: At the lowest support level of the Falling Wedge pattern.

+ Take-Profit: From the entry point, the distance is equal to the maximum width of the pattern.

How to trade Forex with a Falling Wedge

In the second case, the price is in a downtrend. A falling wedge pattern appears. This is a signal that the price will reverse from bearish to bullish. Open an order when the breakout occurs. Take-profit and stop-loss points are set similarly to the first case.

How to trade Forex with a Falling Wedge

Trade binary options with a Wedge pattern

For binary options trading, the perfect entry point using this pattern is the retest point of the price after a breakout. You can use a 5-minute or 10-minute Japanese candlestick chart to search for wedge patterns.

Requirements: A long expiration time (If you use the 5-minute Japanese candlestick chart to analyze the market, the expiration time for a binary options order should be between 30 and 45 minutes.)

How to open an order

+ Open an UP order when the price retests the resistance of the Falling Wedge pattern.

Trade binary options with a Falling Wedge

+ Open a DOWN order when the price retests the support of the Rising Wedge pattern.

Trade binary options with a Rising Wedge

To conclude

The Wedge pattern is a popular pattern used in Forex trading. In addition to being an entry signal, this chart pattern also helps traders identify price reversal points effectively. Experience this special chart pattern on a Demo account carefully before trading on a real account.

In the article, I used images taken from the Olymp Trade trading platform. This is a platform supporting 2 types of trading including Forex and binary options (FIXED TIME TRADE). Register now for yourself an Olymp Trade Demo account in the box below to get acquainted with the Wedge pattern. I wish you successful transactions.

Register an IQ Option account NowGet $10,000 Free for beginners

The post What Is A Wedge Pattern? How To Use The Wedge Pattern Effectively appeared first on How To Trade Blog.


source https://howtotradeblog.com/what-is-wedge-pattern/

Wednesday, September 9, 2020

What Is Flag Pattern? How To Verify And Trade It Efficiently

One of the most common patterns of price trend continuation is the Flag pattern. How to identify this pattern? How to use it in trading most effectively? I will cover it all through this article.

Register an IQ Option account NowGet $10,000 Free for beginners

What is the Flag pattern? Characteristics and how to identify

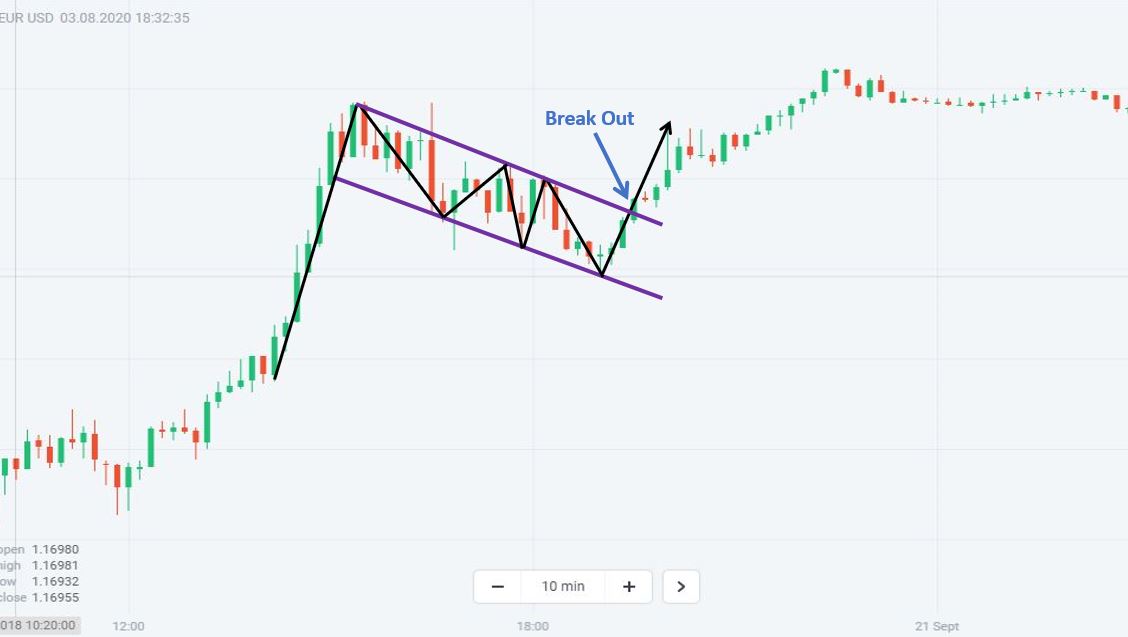
The Flag pattern is a type of price pattern in bullish trends. This pattern consists of a strong increase (called a flagpole), followed by a countertrend with two levels of resistance and support (called flags). The price forms this pattern after a strong increase. It then breaks out of the resistance and continues rising, marking the end of the pattern. This is a very common behavior of prices during an uptrend.

After breaking out of the resistance, the price can retest this new support. If you do not know or want to learn thoroughly about price retest, please review the article: What is Retest?

What is the Flag pattern? How to use it in an uptrend

A practical example in an uptrend.

A practical example of the Bullish Flag chart pattern in an uptrend

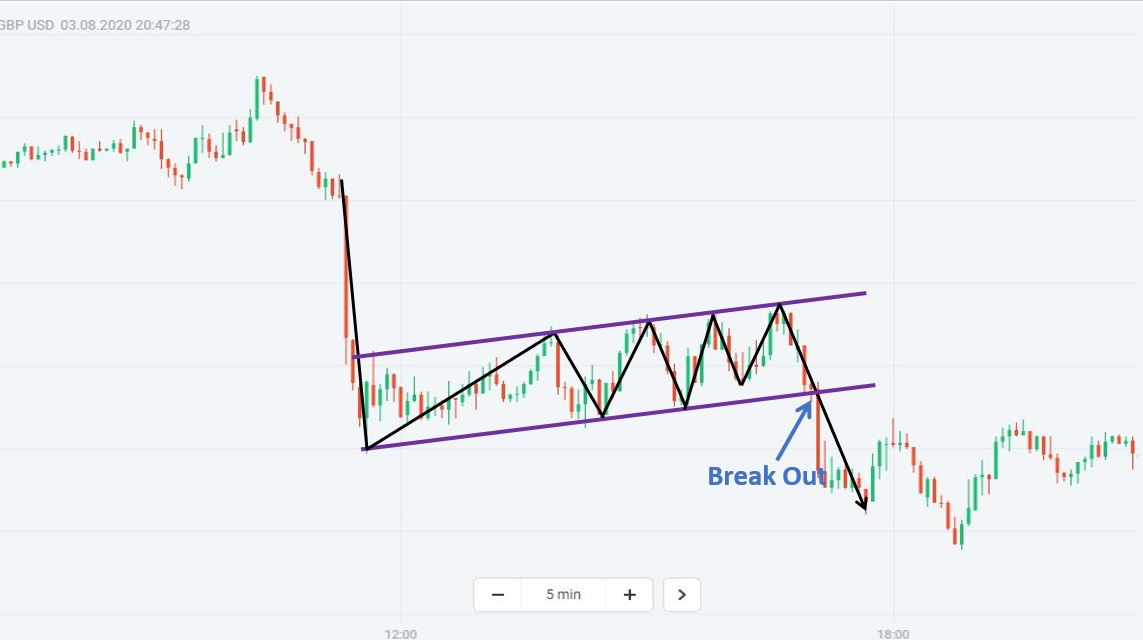
In contrast to the pattern in an uptrend, we also have its counterpart in a downtrend with the opposite shape. After a strong decline, prices tend to rebound with a slightly bullish channel. This is followed by a breakout from the support, which marks the end of the Bearish Flag pattern in a downtrend.

Bearish Flag pattern in the downtrend

An example of the bearish Flag chart pattern in a downtrend.

An example of the Bearish Flag chart pattern in a downtrend

Characteristics of the Flag pattern

+ The narrower the countertrend of the pattern is, the higher its accuracy will be.

+ The countertrend must be in the opposite direction to the main trend (flagpole). Only then does the pattern make sense. If the countertrend goes in the same direction as the flagpole, the pattern will not work.

How to Trade Forex and binary options with the Flag pattern

Here, I will guide you on how to use the Flag pattern in Forex and binary options trading in the most effective way. Read carefully as this is a very good signal for you to make a profit from the market.

Trade Forex

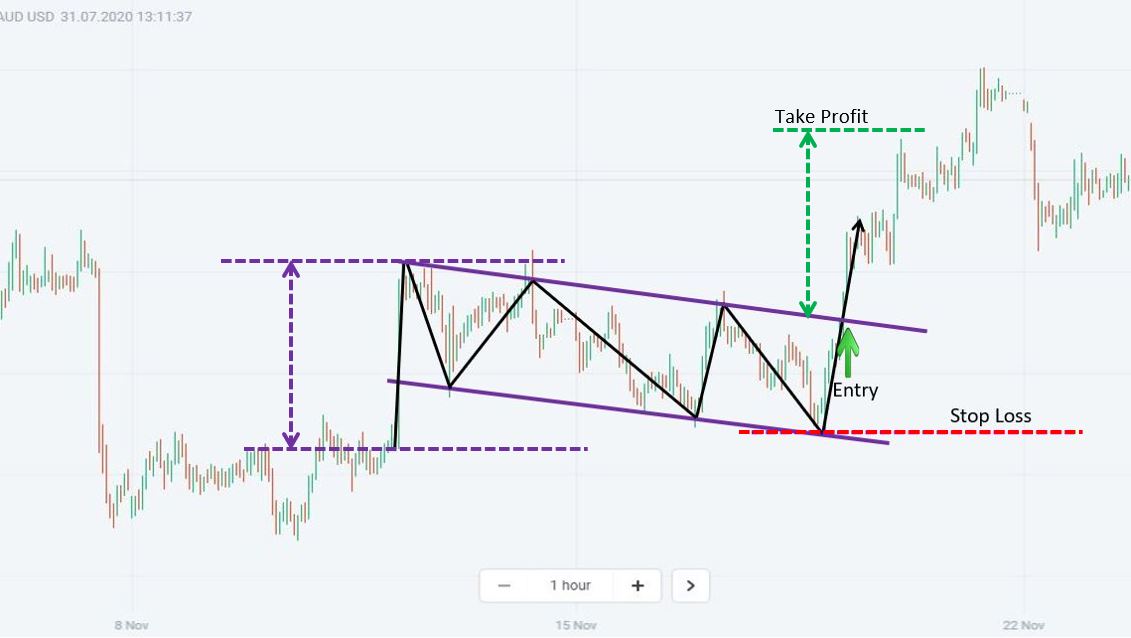
I will show you how to open orders in the most profitable way when encountering the Flag pattern. Entry point, stop-loss, take-profit, all will be presented in the most detail. Let’s follow through the following specific example.

+ Open UP (BUY) orders when the bullish pattern appears in an uptrend.

How to open an order:

Entry Point: Right after the candlestick breaks out of the resistance.

Stop-Loss: At the bottom of the price channel (the lowest point of the support).

Take-Profit: At the price whose, from the entry point, the length is equal to the length of the flagpole.

Trade Forex with the bullish pattern

+ Open DOWN (SELL) orders when the reverse pattern appears in a downtrend.

How to open an order:

Entry Point: Right after the candlestick breaks out of the support.

Stop-Loss: At the top of the price channel (the highest point of the resistance).

Take-Profit: At the price whose, from the entry point, the length is equal to the length of the flagpole.

Trade Forex with the bearish pattern

Trade binary options

For options trading, the best entry point is when the price retests after breaking out of the countertrend.

Requirements: A long expiration time (If you use the 5-minute Japanese candlestick chart to analyze the market, the expiration time for a binary options order should be between 30 and 45 minutes.)

How to open an order:

+ Open an UP order when the price retests the resistance of the Flag pattern after a breakout in an uptrend.

Trade binary options with the bullish pattern

+ Open a DOWN order when the price retests the support of the reverse Flag pattern after a breakout in a downtrend.

Trade binary options with the bearish pattern

One last word

The Flag pattern is a typical continuation pattern that you need to understand in trading. Experience this pattern on a Demo account thoroughly before using it in trading. In the article, I used images taken from the Olymp Trade trading platform. This is a platform supporting 2 types of trading including Forex and binary options (Fixed Time Trade). You can register an Olymp Trade account right below here.

Register an Olymp Trade account NowGet $10,000 Free for beginners

The post What Is Flag Pattern? How To Verify And Trade It Efficiently appeared first on How To Trade Blog.


source https://howtotradeblog.com/what-is-flag-pattern/

Tuesday, September 8, 2020

What is Inverse Head and Shoulders Pattern? Characteristics And How To Trade Effectively

Inverse Head and Shoulders is a strong reversal price pattern. Investors are always interested in this price pattern every time it appears. So what is the Inverse Head and Shoulders pattern? How to identify? Today, I will share it with you.

Register an IQ Option account NowGet $10,000 Free for beginners

What is Inverse Head and Shoulders? Identification characteristics

Inverse Head and Shoulders is a bullish reversal price pattern. The shape of this pattern is the same as that of the Head and Shoulders pattern but in the opposite direction. It is usually at the bottom of the market and is a signal of strong bullish momentum.

The pattern consists of Left Shoulder, Head, and Right Shoulder. A neckline is a line connecting the two peaks of the pattern. The pattern is perfect when the neckline is horizontal (Two peaks have equal prices).

What is Inverse Head and Shoulders? Identification characteristics

Usually, this pattern comes after a strong price drop. This is a warning signal for investors that the market will be back to an uptrend if the price breaks out of the neckline and goes up.

After creating the Right shoulder, the price will break out of the neckline to go up and create an uptrend. In some cases, the price can retest the neckline and then increase again.

If you don’t know what retest is, please review this article: What is Retest?

A practical example of this pattern

Popular Inverse Head and Shoulders types

In fact, the pattern does not always appear with a perfectly horizontal neckline. Based on the neckline, there are two more types of patterns: Inverse Head and Shoulders with an upward neckline or a downward neckline. Please look at the image below to see these two types more clearly.

The variant of Inverse Head and Shoulders pattern with an upward neckline

This is a more common pattern with the neckline being a straight line upwards.

The variant pattern with an upward neckline

A practical example of a variant of the pattern with an upward neckline.

An example of the pattern with an upward neckline

The variant of Inverse Head and Shoulders pattern with a downward neckline

The same goes for when the neckline is downwards. We have the variant pattern with a downward neckline.

The variant pattern with a downward neckline

A practical example:

A practical example of the pattern with a downward neckline

Characteristics of the Inverse Head and Shoulders pattern

Some of the characteristics that increase the effectiveness of the Inverse Head and Shoulders pattern are as follows:

+ The stronger the price decreases before the pattern, the stronger the price increases after it.

+ This pattern becomes most effective if there are downward slopes (sudden drop in prices).

+ This pattern becomes most effective if there are upward slopes (sudden increase in prices).

+ The accuracy of this pattern increases when the right shoulder is lower than the left shoulder.

How to trade Forex and binary options with the Inverse Head and Shoulders pattern

The Inverse Head and Shoulders pattern can be used as a trading signal or as a signal to capture the upcoming uptrend. I will guide you to use this efficient pattern in both Forex and binary options trading. Stay tuned!

How to trade Forex

I will guide you in detail on how to open orders, stop-loss, and take-profit to maximize profits when trading with this pattern. This is a very good signal for you to open UP orders and make profits in an uptrend market.

When the pattern appears, open an order like this:

+ Entry Point: Right after the candlestick breaks out of the neckline.

+ Stop-Loss: At the trough of the right shoulder.

+ Take-Profit: When the price reaches a sufficient increase by the distance from the head to the neckline of the Inverse Head and Shoulders pattern.

How to trade Forex
How to trade Forex

How to trade binary options

In addition to the break-out point from the neckline, another effective entry point is when the price retests the neckline and bounces up. This is a very suitable entry point when you trade binary options.

Requirements: A long expiration time (If you use the 5-minute Japanese candlestick chart to analyze the market, the expiration time for a binary options order should be between 30 and 45 minutes.)

How to open an order.

+ Open an UP order when the price retests the neckline of the Inverse Head and Shoulders pattern.

How to trade binary options

The Inverse Head and Shoulder pattern is one of the very popular Forex trading strategies. In addition to the above trading strategy, you can combine it with other indicators to increase trading accuracy.

Get familiar with this price pattern today on a Demo account. If you do not have a demo account yet, register for an Olymp Trade account immediately by clicking on the box below. This is a very suitable trading platform to test the Inverse Head and Shoulders pattern when there are both binary options and Forex trading types. Finally, goodbye and see you again.

Register an IQ Option account NowGet $10,000 Free for beginners

The post What is Inverse Head and Shoulders Pattern? Characteristics And How To Trade Effectively appeared first on How To Trade Blog.


source https://howtotradeblog.com/what-is-inverse-head-and-shoulders-pattern/

Sunday, September 6, 2020

Head and Shoulders pattern: How To Verify And Trade Efficiently

The Head and Shoulders pattern is one of the most popular and best-known price patterns in Forex trading. In this article, Howtotrade blog will guide you on how to verify and trade effectively with this pattern.

This is a very accurate trading signal if you know how to use it properly and flexibly.

Register an IQ Option account NowGet $10,000 Free for beginners

What is Head and Shoulders? How to identify and characterize

Head and Shoulders is the name of a special type of price pattern that usually appears at the end of uptrends. This is a signal of future downtrends.

It is called Head and Shoulders because the shape of this pattern on the price chart is similar to that of the human body including Left Shoulder, Head, and Right Shoulder.

What is a Head and Shoulders pattern? How to identify and characterize

The line connecting the two troughs of the shoulders is often called the neckline. In fact, this pattern is perfect when the Neckline is horizontal (the prices of the two lows are approximately the same).

Normally, when the pattern appears, the market will offer a Retest (Pull-back) point. If you do not understand what Retest is, please review the article: What is Retest? Why is it so magical.

This pattern has the following characteristics:

+ The stronger the price increases before the pattern, the stronger the price falls after it.

+ The faster the price increases before the pattern, the faster the price falls after it.

+ The variation with a neckline pointing upwards offers the highest accuracy.

+ Left shoulder higher than right shoulder yields better performance.

A practical example of the pattern.

A practical example of the pattern

Common types of Head and Shoulders patterns

A perfect Head and Shoulders pattern rarely appears. Therefore, traders usually consider the variations of this price pattern. Here, I will introduce to you the other two popular remaining types. These are the patterns with an upward neckline or a downward neckline. Let’s take a closer look at the images below.

The variant pattern with an upward neckline

This is a variant with an upward neckline. This price pattern offers the highest accuracy among all Head and Shoulders patterns.

The variant of Head and Shoulders pattern with an upward neckline

An example of the variant pattern with an upward neckline.

An example of the variant pattern with an upward neckline

The variant pattern with a downward neckline

Similarly, we also have another variant with a downward neckline. Then, the neckline will look like a trendline in a downtrend. You need careful observations to identify this pattern.

The variant of Head and Shoulders pattern with a downward neckline

A practical example of the pattern with a downward neckline.

An example of the pattern with a downward neckline

How to trade Forex and binary options

Trade Forex with a Head and Shoulders pattern

I will show you in great detail how to trade Forex with this pattern. Entry points, stop-loss, and take-profit to maximize profits are also available. Please take a look at the example below to learn more about how to enter a Forex trade with this pattern.

Since this is a pattern signaling a price decrease in the future, you should only open DOWN orders with this pattern.

Trade Forex with the Head and Shoulders pattern

+ ENTRY POINT: Right after the candlestick breaks out of the neckline.

+ STOP-LOSS: At the peak of the right shoulder.

+ TAKE-PROFIT: Usually, Head and Shoulders is a pattern for starting a downtrend. Therefore, instead of setting a take-profit, you can adjust your stop-loss when the price falls. The lower the price is, the lower your stop-loss you should adjust. This is to maximize your profits and protect your final results.

Trade binary options with a Head and Shoulders pattern

In Binary Options trading you can observe the 5-min, 10-min price charts to look for Head and Shoulders patterns. With this type of trading, the safest entry point is the retest point at the neckline.

Requirements: A long expiration time (If you use the 5-minute Japanese candlestick chart to analyze the market, the expiration time for a binary options order should be between 30 and 45 minutes.)

How to open an order

+ Open DOWN orders: The price retests the neckline of the pattern.

Trade binary options with a Head and Shoulders pattern

To conclude

The Head and Shoulders pattern is a favorite signal of price action traders. This is a strong signal for you to open trendy Sell positions. Often, the Head and Shoulders warns traders of a strong downtrend in prices.

In the article, I used pictures taken from the Olymp Trade trading platform. This is a platform that offers 2 forms of trading: Forex and Binary Options (Fixed Time Trade). You can open a demo account here:

Register an Olymp Trade account NowGet $10,000 Free for beginners

The post Head and Shoulders pattern: How To Verify And Trade Efficiently appeared first on How To Trade Blog.


source https://howtotradeblog.com/head-and-shoulders-pattern/

Friday, September 4, 2020

How to Deposit Olymp Trade With Visa And Mastercard 09/2020

Nowadays, Visa and Mastercard payment methods are familiar to everyone. This is a fast, easy-to-use, and highly secure payment gateway. How To Trade Blog will guide you how to deposit your Olymp Trade account with VISA MasterCard. This is the most commonly used deposit method by traders trading on this exchange platform.

Register an Olymp Trade account NowGet $10,000 Free for beginners

Video clip on how to deposit Olymp Trade with VISA MasterCard

How to deposit Olymp Trade with VISA or Mastercard

To be able to recharge your Olymp Trade account with your VISA card, you need to perform the following steps

Step 1: Login and click the deposit button

You click More button then select Deposit.

Login and click the deposit button

Step 2: Choose VISA/MasterCard as the deposit method

A window appears with payment gateways supported by Olymp Trade. Click to deposit with VISA/MasterCard.

Choose VISA/MasterCard as the deposit method

Step 3: Enter the amount you want to deposit your Olymp Trade account

Enter the money you want to deposit the Deposit Amount box, then click Deposit.

Enter the amount you want to deposit your Olymp Trade account

Step 4: Fill in the information on the VISA card to proceed with payment

The information includes:

  • Cardholder’s name (Capital letters).
  • The number on the card.
  • Card term (month and year).
  • CVV2 code (back of card).
Fill in the information on the VISA card to proceed with payment

Then you click Pay to continue.

Step 5: Enter the OTP to confirm payment

Payment by VISA card always needs confirmation by code. At this point, you need to enter the OTP code from the bank sending it to your phone number to confirm the request.

Enter the OTP to confirm payment

After completing the OTP code, click NEXT to continue.

Step 6: Wait for confirmation from Olymp Trade

Successfully deposit in Olymp Trade

After the confirmation, your account will be credited.

Step 7: Check your Olymp Trade real account

You have completed all steps to top up your Olymp Trade account with Visa/MasterCard. You can start trading immediately. However, before trading, you can quickly check whether your account has been credited or not.

Check your Olymp Trade real account

Notes when depositing Olymp Trade with Visa or Mastercard

Some small notes when you deposit money into Olymp Trade with VISA/MasterCard.

  • The amount used to deposit Olymp Trade on your card must be 2-5% larger than the amount you want to deposit. This amount is to pay for the fee when using the VISA card.
  • Ideally, you should use your VISA MasterCard in your name. This will save you the hassle when withdrawing money with this card.
  • Usually, only after 1-3 minutes, the money will be immediately deposited into your account. This is a strong point when using VISA/MasterCard. If after a while there is still no money in your account, you can contact Olymp Trade support for help.

Register an Olymp Trade account NowGet $10,000 Free for beginners

The post How to Deposit Olymp Trade With Visa And Mastercard 09/2020 appeared first on How To Trade Blog.


source https://howtotradeblog.com/how-to-deposit-olymp-trade-visa-mastercard/

Wednesday, September 2, 2020

How To Download And Login Olymptrade App On Smartphones

You are a busy person or have to travel a lot. You do not have too much time or conditions to trade on Olymp Trade in your computer or laptop. Understanding this, Olymptrade has developed a trading app on smartphones to help traders make money anytime & anywhere. The following article will guide you to download and login Olymp Trade on your smartphone.

Register an Olymp Trade account NowGet $10,000 Free for beginners

Video on how to download and install Olymp Trade app on smartphones

How to download and install Olymp Trade app on smartphones

Below are the steps to download the Olymp Trade app to your smartphone with iOS operating system. If your phone uses the Android operating system, you can also do the same.

Step 1: Click the download button in this article that suits your smartphone’s operating system

Scroll down to the bottom of this article and find the Download button of the Olymp Trade Mobile App. Then choose the Olymp Trade version suitable for the operating system of your phone.

Click on the download button that suits your smartphone's operating system
Click on the download button that suits your smartphone’s operating system

Step 2: Choose to download Olymptrade from the App store

Download Olymptrade from the app store

Step 3: Open Olymptrade app on your smartphone

After the download is finished. Click open the application to continue

Open Olymptrade app on your smartphone

Step 4: Login to your Olymp Trade account

After opening the Olymptrade app, a registration/login window appears. You proceed to login to your Olymp Trade account with the email and password you registered earlier.

Login to your Olymp Trade account on the smartphone

After successful login, you will see Olymp Trade interface on Mobile app as shown below.

The interface after logging into Olymp Trade on the smartphone

This is a way to make profits from Olymp Trade that is very suitable for those who are busy. Just with a smartphone and 4G, you can make money anywhere & anytime. If you have any problems when using Olymp Trade app, just leave a comment below. We will help you as soon as possible.

Register an Olymp Trade account NowGet $10,000 Free for beginners

The post How To Download And Login Olymptrade App On Smartphones appeared first on How To Trade Blog.


source https://howtotradeblog.com/how-to-download-olymptrade-app/