Howtotradeblog is a website to guide and share useful knowledge about trading in IQ Option, Olymp Trade, Binomo... We do not encourage you to make large amounts of money that are not realistic but to help you earn small profits every day.
Website: howtotradeblog.com
Youtube: https://bit.ly/howtotradeblog-youtube
Why do people call a downtrend a bear market? Let’s look at how the bear attacks.
First, the bear runs straight ahead. Unlike tigers, lions or wolves, bears do not rush straight in. When approaching, he stands up then pounces strongly and bites the prey. When the prey is in the mouth, the bear begins to tear the flesh of the prey, letting it slowly bleed and die in pain.
And here is a segment of the bear market:
A segment of a bear market
(1) The bear has identified its prey, rushes forward and stands up.
(2) Pounce strongly.
(3) Torment the prey until it dies.
What does Dow Theory say? While the bull runs up, it will stop, pick up momentum and run again. But the bear is different. It does not need momentum. It rushes and stands up, using its body to pounce on its prey. This is why prices will usually go up slowly (like walking up the stairs) but when they fall very quickly (like going down in an elevator).
A bull market goes up slowly while a bear market falls fast
Hehe! Just rambling a bit. Now we’re going to get into some sort of bearish pattern, confirmation candle and sell order.
When the price falls, it usually falls vertically. Therefore, you need to be decisive as soon as there is a candle confirming Breakdown.
(2) Bounces
Like a ping-pong ball falling, when it hits the ground, the ball will bounce, then continue to fall. The same goes for the bear market. After a sharp drop, it will be the process of bouncing up and down. Watch for SELL on bounces.
Confirmation candle in the downtrend
Features: Red candle, long body, closing price close to or equal to the lowest price. In technical analysis, this candlestick pattern is called Bearish Marubozu.
Bearish Marubozu pattern
1st position: Breakdown
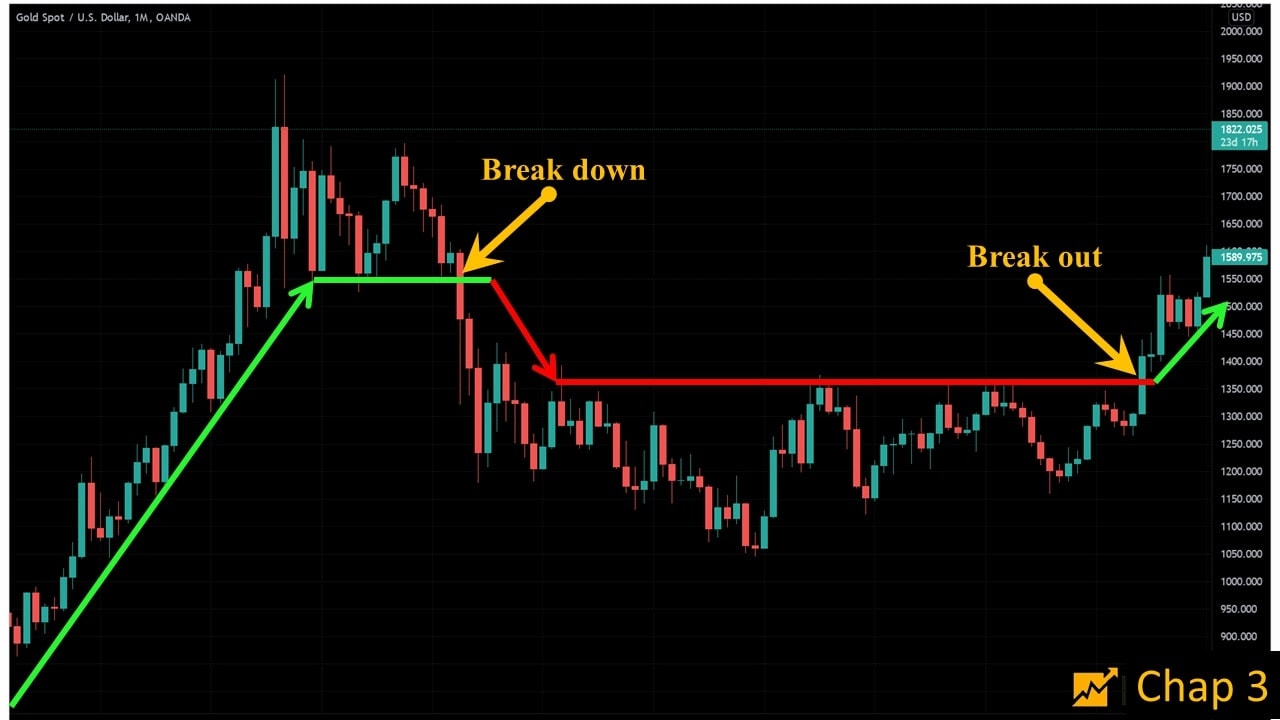
The word “down” is understood as when the price breaks out of this zone, the market will enter a downtrend.
Theory: At the end of an uptrend, the market starts moving sideways (Distribution). Boom! The price drops sharply and the market crashes very hard. It starts with a bearish confirmation candle, breaking down from the distribution area.
Breakdown confirmation candle
Distribution is a process and the market rarely follows a pyramid pattern (strong up and strong down). In most distributions, you can always draw a Key Level or a clear support level. The Breakdown candle needs to pierce straight through and close definitely below this level.
Practice:
Gold confirmation candle in a downtrend
Special note: When the market enters a downtrend, there will be extremely strong declines, penetrating all the Key Levels that you can draw before. Therefore, you will easily have the psychology of wanting to buy and it is very easy to enter a buy order. This is the beauty of the Bear market. The more you buy, the more money you lose.
2nd position: Bounces
Theory: The pullback in a downtrend is often an opportunity for you to continue selling. For me, the signal is still a candle confirming the pullback is over and the price will continue to fall again.
Bounces in a downtrend
Price retracement will come after sharp declines. The market at times like this is easy for SELL orders. Just the profit won’t be as great as when you catch the Breakdown.
Practice:
Gold’s bounces in a downtrend
Note: It is very rare for the market to drop sharply and then increase sharply again. Usually, it will be a bounce scenario to continue falling or accumulate again, creating momentum to go up. Even in this case, the SELL order is still the safest.
Personal experience
When the bear attacks, it will stand up and then pounce on its prey. The market is also the same before the downtrend. There will be some retracement and crashes.
Wait for the confirmation candle. The stronger the bearish candle, the more prestigious it is. Because when the price drops sharply, it will spread the crowd psychology, selling off the whole market.
Sometimes you just need to catch 1 Big Short (long drop). It is more than enough. And if trading is too difficult, just trade in one way – SELL.
Reason: The bull running up will need to rest to gain momentum. Or in other words, in an uptrend, there are still retracements for you to sell. In a downtrend, if you catch a SELL, sometimes you will get a Big Short.
In the daily chart, gold is still in a downtrend (it hasn’t created a new high higher than the old one).
Gold’s daily chart
In the H4, the confirmation candle closes below 1780 => Enter a SELL order.
– Place Stop Loss above the confirmation candle (140 pips).
– Take Profit at the Supply Demand zone below.
Enter a SELL Gold order
SELL EUR/USD order.
In the daily chart, EUR/USD is still in a downtrend, and it is returning to the Key Level.
EUR/USD daily chart
In the H4, the confirmation candle appears and the previous key level is broken => Enter a SELL order.
– Place the Stop Loss above the confirmation candle (40 pips).
– Take Profit in the Key Level below. This order has the ratio R:R = 1:1.8.
SELL EUR/USD order
We will have an article on the trading log to summarize all the orders in this $15,000 account. Let’s see after the whole process of learning and practicing whether we make a profit or a loss.
Summary
I repeat that the beauty of a downtrend is to make traders want to BUY rather than SELL. Maybe because traders have been waiting to BUY in the Key Level below. Maybe they find the price cheaper, etc. But for whatever reason, the truth is that most people lose money on sharp drops.
For example, in the Crypto market, in an uptrend, everything increases – every coin increases – even shitcoins also rise. But usually, people will lose everything in a downtrend. No matter how much money they make, they will return all to the market.
Remember: In an uptrend, people use BUY and Hold. But in a downtrend, they use Big Short. Hope you understand what I’m trying to say.
Apart from this blog, all my articles are also posted on a telegram channel. You can read them here: JQKA Academy.
Continuing in the Price Action series, I will have 2 articles about confirmation candle to enter orders. One article will talk about the uptrend and one about the downtrend. I divide them into 2 articles so that you can easily read, think and understand.
In my experience, please never predict market trends. This is extremely important so I repeat “ NEVER FORECAST THE MARKET”. All you need to do is analyze and plan, wait for the market to make a confirmation, and finally take action.
Reason: For example, if you predict a bull market, what comes to your mind will be BUY, BUY, BUY. Even if the market falls, you will still try to BUY and then BYE BYE your account. No one knows for sure what will happen. So you should come up with scenarios for the market and plan for each of them. Finally, wait for the market to tell its story.
Commitment: This confirmation candle article will focus on a single candle. I don’t use the term reversal candle to misunderstand the concept of trend reversal trading.
Confirmation candle in Uptrend
Features: Long body, green color, the closing price is near or equal to the highest price. The longer the candle, the better it is. Technically, it is called the Marubozu candlestick. For now, we will only use one term – Long body green candle.
Long body green confirmation candle
Two positions of the confirmation candle:
(1) The long body green candle penetrates Key Level in Uptrend (Breakout).
(2) In the bull market, the price returns to the Key Level and bounces up with a long body green candle.
Theory and practice
Now I will go into more detail about the cases. By default, Uptrend + confirmation candle = BUY order.
Position 1: Breakout
Theory: The candle goes up and breaks out of Key Levels or Downtrend lines, confirming the uptrend of the market.
Breakout confirmation candle
Practice:
Confirmation candle on Gold chart
Experience:
– It looks so simple but you will be afraid and not dare to enter the BUY order. Breakout candles appearing at Key Levels always make traders want to sell rather than buy. And that’s it.
– Some currency pairs have a habit of breaking out and then retesting back to the Key Level they just passed. Some do but some don’t. Let’s take gold as an example. Its habit is to accumulate peaks to increase further but it doesn’t retest the Key level. The habit is quite annoying because traders will not dare to BUY at high prices. They wait for the gold price to return to the low price range to BUY but it will not do that.
The usual disobedience of gold
– You have to learn to accept buying at a higher but safer price. Most traders will try to buy low and sell high and of course… they all lose money. You should give up that mentality. To survive, practice the habit of buying safely at the right point.
– Do you still remember the tenet 2 of Dow Theory? If you missed the Breakout candle, wait for the secondary trend. Wait for the price to pull back to start new BUY positions. Don’t try to swing with the market.
Theory: The market is in an Uptrend. The price adjusts to a temporary decrease (to the Key level). A long body green candle appears, confirming the end of the retracement.
Candle confirms the end of the retracement
Practice:
Candle confirms the end of the retracement of EUR/USD
Experience:
– The candle confirming the end of the market’s retracement wave usually increases strongly close to the old peak. Your psychology will be a bit cautious. Like if you enter an order, you need to put SL below the confirmation candle and the TP point will be at the old peak => R:R ratio is not good => Skip the opportunity
– The win rate when I enter BUY orders is not as high as SELL orders. With the same candlestick pattern and entry method, the SELL order gives a higher probability of winning. For example, Gold rising is slow and falling is fast. So if there is a confirmation of the decline (long bearish candle), it will usually continue to decrease.
– I prefer the Breakout strategy rather than the retracement strategy.
Orders I have executed
If you read this far, you will probably understand it. So now we’re going to learn how to enter an order, set stop loss and take profit with this strategy.
With Crypto market
I will talk about how I use it in the Crypto market first (Spot only, absolutely no Margin and Future). Current investment portfolio on Binance exchange.
Current investment portfolio on Binance
With the Crypto market, I will use the H4 chart to identify the Trend and the Key Level. Trade on the H1 chart and combine with the Volume indicator (tenets 4 and 5 of Dow Theory).
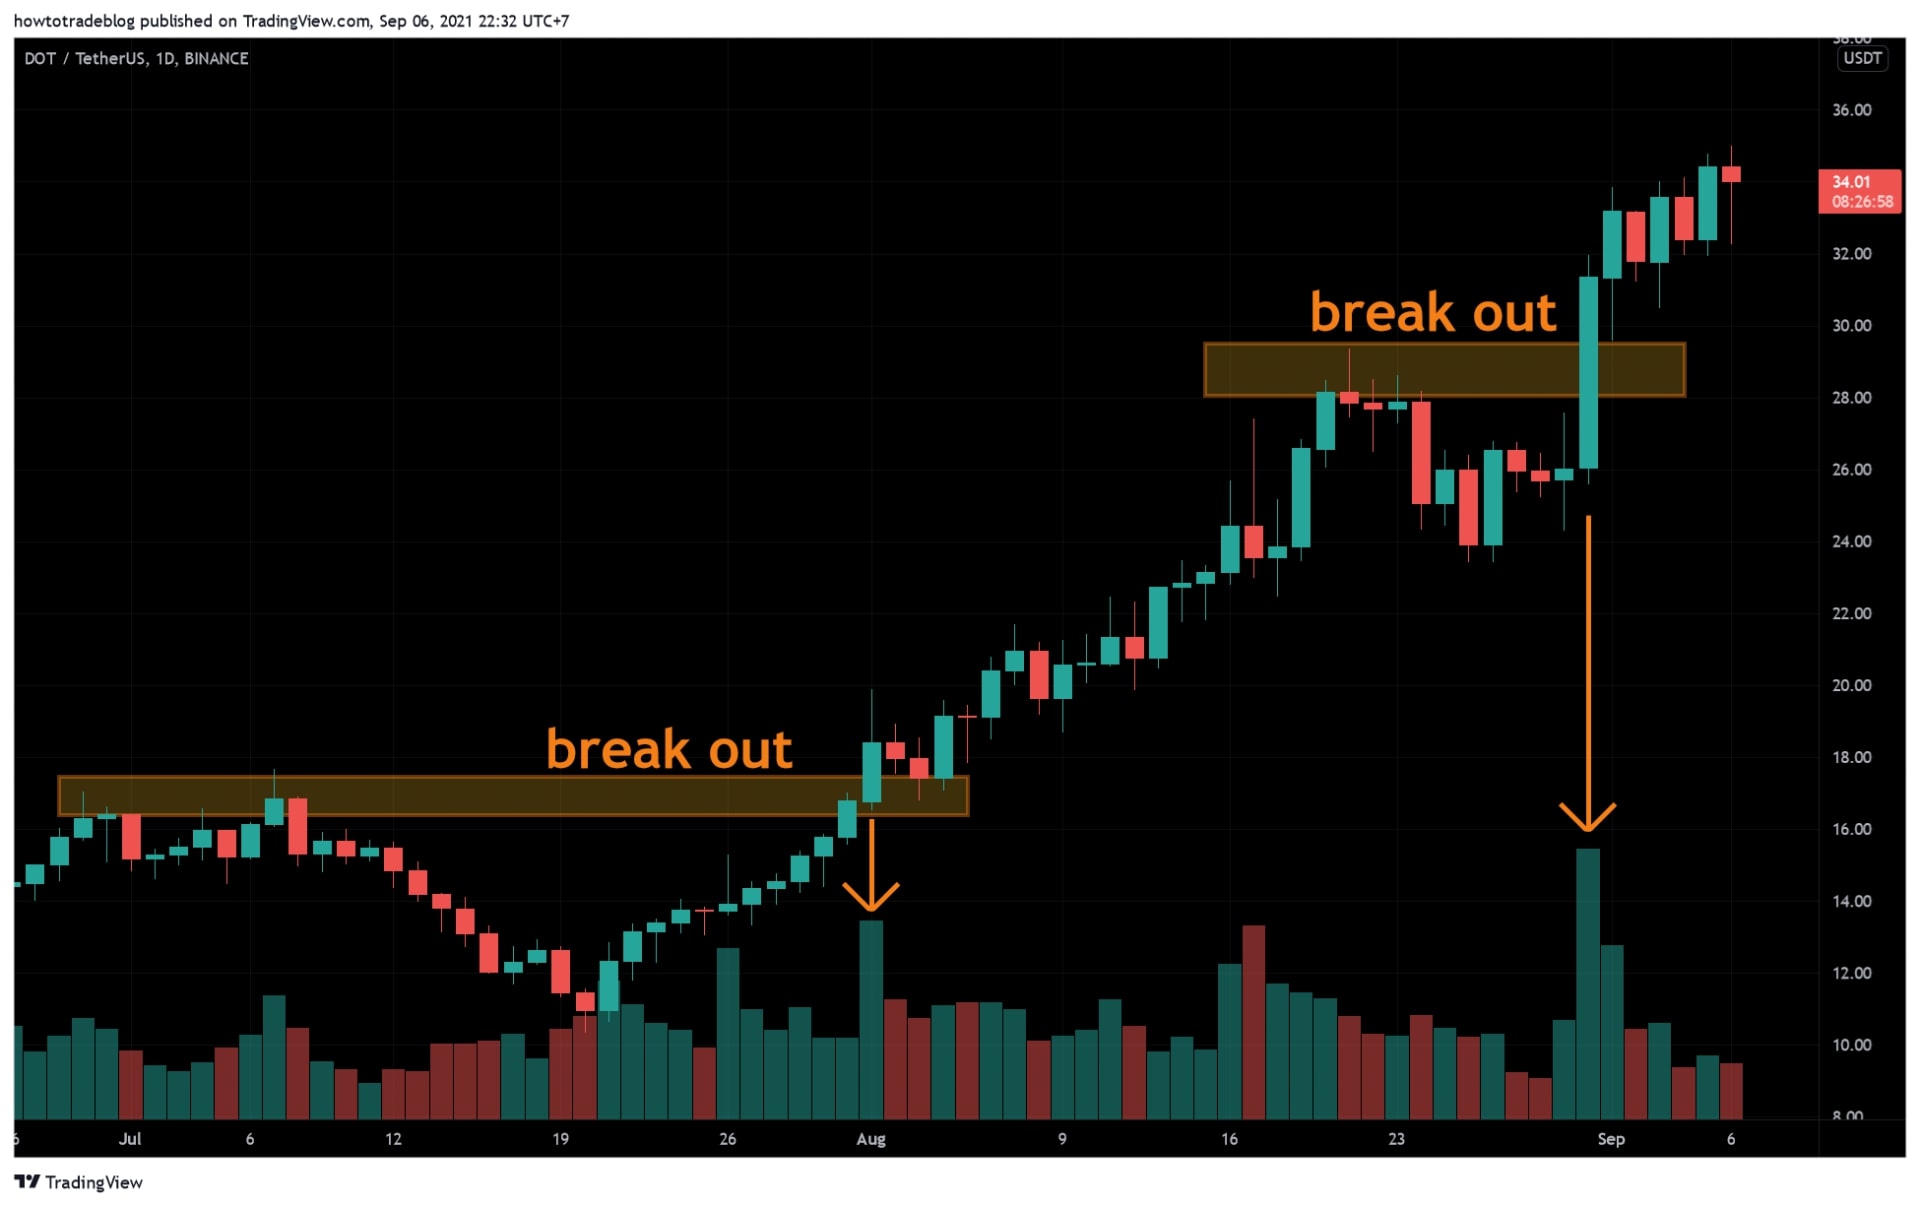
Particularly for Coin, Price Action Breakout trading or long bullish candlesticks signaling the end of the retracement must be accompanied by high volume.
For example,
– FTT/USDT token of the FTX exchange. Two breakout candles with increased trading volume are reliable confirmation so that you can enter BUY orders.
Buy FTT Token
– Coin Link/USDT (ChainLink) is similar. You can buy after strong green candles (Breakout), accompanied by a sudden increase in volume.
Buy Link coin
Enter as soon as the confirmation candle closes (a strong price increase comes with a spike in trading volume). Stop loss is placed below the confirmation candle. Don’t set TP. Most of these Coins, I will buy and buy more if there are confirmation candles. I only sell when the market officially enters the downtrend.
With Forex/Gold market
I will use the daily chart to determine the main trend and Key level. The H4 candlestick chart will be used to wait for the confirmation candle.
As I was writing these paragraphs, my account had a EUR/AUD position. I did not follow this order until September 14, 2021.
Daily chart: Uptrend + Retest Key Level
Daily EUR/AUD chart analysis
H4 chart: Confirmation candle (yellow arrow) broke out from the sideways zone and increased.
A Buy EUR/AUD order example
Entered as soon as the confirmation candle closed.
Placed Stop Loss just below the confirmation candle: 70 pips
Take Profit at the next Key Level. This order had a ratio of R:R = 1:2.
Summary
I will have an article to talk about the results of these orders.
Do you know why people use bull images to talk about uptrend?
Simply, you just look at how the bull attacks. It backs to gain the momentum, swipe the legs to create a charge, then lower the head to let the horns act as a combat weapon and stab the target. After that headbutt, the bull will slow down, pick up momentum and attack again.
Bull market (Uptrend)
This is also the characteristic of the Bull market (Uptrend). The long body green candles resemble the image of a bull accelerating, lowering its head and rushing forward. Following the bulls, following the uptrend, and waiting for the confirmation candle to enter BUY orders are considered one of the safest ways for you to survive and make money in the forex market.
There is a funny story about Bitcoin but it’s 100% real.
It is about a guy who bought Bitcoin (BTC) in early 2018.
(A) Well, the brokers “drive” BTC badly. They pushed the price from $20,000 to nearly $10,000. Less than 1/2 already, let’s buy it.
(B) The bull run was terrible but the correction ended. Continue to buy BTC (Average price).
A funny story about Bitcoin
(C) It seemed that there were too many people clinging. The brokers couldn’t pull the price up right away.
(D) I’m a long-term investor. I’ll buy and hold. BTC will surely go up again.
………….
1 year later, holy moly, SELL SELL SELL. Finally, the price has risen enough to sell for breakeven.
LOL because I find myself in this story too. At first, I also thought about lots of conspiracy theories, then consoled myself and became a long-term investor finally. When BTC rose, I sold as fast as I can to run away from this market.
Why do I tell such a long story? To shape you with a mindset. Let’s focus on analysis and act based on it. This is the essence of Price Action. Do not dance around and predict baselessly about brokers’ behavior or the secret of the crowd, etc.
About Flash’s Price Action school
– Analyze the daily chart. Enter orders on the H4 timeframe.
– Question 1: What is the market trend? Look at the daily for the answer.
– Question 2: Where is the key level (Supply and Demand zone)?
Flash’s Price Action school
– Question 3: When the price returns to the Key Level, wait for the signal (H4 chart). If there is a signal, then enter. If not, do nothing.
– When the signal has met enough requirements, enter an order, set Stop Loss (SL) and Take Profit (TP).
– Then what? Just ignore it. At the end of the month, summarize the results first and find a way to do it later.
Learn to analyze and come up with scenarios
Remember: Analyze and give market scenarios. Based on how the price goes, we take that scenario out and act. We don’t just analyze and predict that the market will rise or fall.
It’s very dangerous because when you predict the price to increase, your head only thinks of a buy order. Therefore, it is very easy for you to fall into a state of “crazy buy”. Regardless of the dropping price, you still try to buy and die.
Real trading in Gold (XAU/USD) – September 7, 2021
I will take a real example for you to easily understand.
Daily chart: Downtrend? That’s right. There were lower highs and lower lows on the chart. The current bullish wave (A) was simply a retracement wave.
Gold was in a downtrend daily chart
If and only if the price broke through the critical Key Level (yellow zone), we could conclude that the market would reverse. Currently, gold was still in a downtrend. So, what did we have? Downtrend + Key level => Wait for a bearish signal => Our setup has met all requirements => Enter a SELL order.
Gold price at the Key Level in the downtrend
Signal – H4 chart: After the breaking candlestick signal, the price would plummet. Remember to act only after the candlestick closes.
SELL gold order: 1815
SL: $14 (140 pips).
TP: $35 (350 pips) at the nearest Key Level.
SELL gold order example
Identify the main Trend
Uptrend or Downtrend? Use your eyes with simple thoughts. Don’t do conspiracy theories, predictive news. It is crap. Please do not confirm trend reversal points and don’t attempt to use the top or bottom fishing strategy either. Let the fools do it. Your job is to identify the trend and follow it.
As I said from the beginning, Key Level = Supply/Demand zone. For many others, Key Level could be support and resistance, or the nearest high/low. It’s depending on you.
Uptrend + Demand zone
Uptrend and Demand zone
Downtrend + Supply zone
Downtrend and Supply zone
Entry signal? I’ll leave it for later (Part 5). We will spend a whole long article talking about 2 patterns, Marubozu and Pin Bar. There are some common price patterns too.
This is the foundation of technical analysis, the foundation of all markets – Dow Theory. Before you enter the series of learning and practicing Price Action, you must understand the nature of the market and the psychology of trading. That’s why I have to write this article.
Commitment: This is going to be a long post but your time spent on it won’t be wasted. I will use the Gold and Crypto markets to describe this theory.
Through this article, I will prove that Dow Theory is not just a theory. It has existed for hundreds of years and it is true for all markets.
What is Dow Theory? And its 6 main tenets
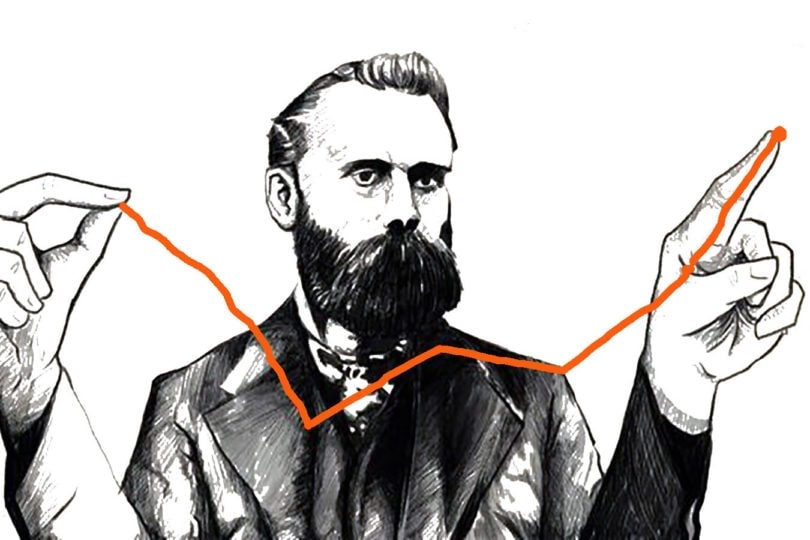
Dow Theory is a series of theories expressing Mr. Charles H.Dow’s beliefs about how the stock market works.
Later, many experts in the financial field also recognized this theory as a standard for all markets. Therefore, they took his name to name the largest stock index in the US – Dow Jones.
What is Dow Theory?
Let’s read through these 6 tenets once. Then I will go into each of them to explain for you to fully understand each issue.
1st Tenet: The price discounts everything.
2nd Tenet: Primary and secondary trends.
3rd Tenet: 2 primary trends and 3 phases of the market.
4th Tenet: Averages must confirm each other.
5th Tenet: The price must be accompanied by volume.
6th Tenet: The main trend is maintained until there are clear signs of reversal.
For convenience, I will present the following order – (1), (3), (2), (4), (5), (6). In this way, it will be easier for you to understand.
I will also take the example of the Gold market (XAU/USD) for tenets (1), (2) and (3). But from tenets (4) and (5), I will move on to talk about the Crypto market.
Tenet 1: The price discounts everything
The information you know from psychology, data on inflation, interest rates to wars, epidemics, etc, all have been reflected in the price.
The price discounts everything
This is the first tenet for you to accept the Dow theory. Once we have used technical analysis, the only thing we will focus on is price. The market tells its own story through the price. The factors that have been and are or will even happen are already in the price.
Tenet 3: 2 primary trends and 3 phases
Do not confuse with 3 trends bullish, bearish and sideways. According to Dow Theory, there are 3 movements of the market including primary trend, secondary trend and daily fluctuation. But in this price action series, we only mention 2 primary trends. They are bullish (Uptrend) and bearish (Downtrend).
Look at Gold’s monthly chart and imagine this.
The plan of the brokers
(A) There is a certain force that controls the market, which I call the brokers. First, they push down the price to buy gold at a cheap price. Therefore, at this phase, the price will move sideways for a certain period.
(B) After buying enough gold, the brokers pull the price up continuously.
(C) Start distribution to all investors (including me and you) to realize profits.
(D) After the distribution process, the brokers push the price down again. Organizations and individuals will cut their losses, run away, and sell gold all at a cheap price.
Push the price down and buy gold again
(A) In the end, the brokers proceed to buy again and start a new cycle. Then everything goes back to the way it is.
Ok! Now we will go deeper.
Uptrend (Bull market)
In this trend, the market has 3 main phases including accumulation, explosion and transition.
3 phases of an uptrend
(1) Accumulation phase
This is the beginning of a new market cycle.
After the sharp drop, all the worst news was out. Everyone sold out and the market entered the accumulation phase.
Sign: The price moves sideways within a certain range.
Accumulation phase
This is the most difficult phase to recognize because investors all felt fear, apprehension and a little doubt at the end of the downtrend of the previous cycle. So they almost stand out during this phase. Meanwhile, the media and news also are not interested in the market.
(2) Explosion phase
Boom! Something big explodes (Of course in the brokers’ calculations).
Sign: A breakout candlestick appears on the chart, exiting the accumulation phase. The price starts to rise continuously.
Explosion phase
Features: This is the easiest money-making phase of the market. What you need to do is to buy, partial profit-taking, hold. You can find new entry points to repeat this process several times during this phase. However, if you try to surf, buy and sell uncontrollably, you will lose money without a doubt.
The good news such as injections, wars, pandemics, etc, are released every day. All eyes are on gold and money flows to gold.
(3) Transition phase
I usually call this the sprint phase. The price pulls quickly and strongly to the “finish line” – a specific target level in the brokers’ pre-calculated scenario.
Sign: The price increases rapidly and strongly. In phase 2, the price will increase in the pattern of a ladder pattern, in which it rises then rests, gaining momentum to increase further. But in phase 3, the price will increase vertically, triggering greed and excitement of the crowd.
Transition phase
Features: FOMO sentiment is pushed up. Experts start saying “Gold will increase to $3000 – $5000”. Many non-traders and fresh buyers also begin to enter the market. Roughly, this is the time when “everywhere you go, you hear about the gold price”.
This stage is very happy and super excited. Just buy and win. Newspapers and media report good news about gold every day. And, whatever comes, must come.
Downtrend (Bear market)
A downtrend also has 3 phases. It begins with a distribution phase, followed by a sharp decline and finally a desperate phase.
(1) Distribution phase
It is strange because the good news about gold comes out continuously but the price does not increase.
Sign: The market will usually go sideways.
Features: The price often fluctuates strongly during this stage. The more positive information is pumped out, the transaction is also more active. Experts begin to say the market would increase even more. But the most important thing is that the market is not bullish.
Distribution phase
Remember: Distribution phase is a long period. It is not a 1 or 2 days affair. It spans multiple sessions in a row and gives you enough signals to notice.
(2) Sharp decline phase
This is a terrible time for the buyers. Boom! The gold price breaks down from the horizontal channel of the distribution zone. The crowd begins to panic.
Sign: The price falls sharply and breaks out of the previous support levels.
Features: For professional investors, they will quickly cut their losses and leave the market. What about “chicken”? They begin to hope and pray for the price to return.
Sharp decline phase
Unlike the bullish boom phase of the uptrend. this sharp decline phase is catastrophic. The price drops like a train plunging. The more you try to stop it, the more you “disintegrate”. If you don’t get out when the price breaks down (officially entering the downtrend), then you almost don’t dare to sell at this point.
(3) Desperate phase
After the massacre, those who still “hold the goods” will still expect the price to increase again. Therefore, the brokers will begin to take them from one hope to another, only to drown them all in despair.
Features: The market stops falling sharply. There are some retracements. This is like the landing of a ping pong ball, bouncing up and down, then bouncing again…
Sign: Buyers wait for the price to bounce back to exit all BUY positions. But as soon as the price rises, it falls again. Many fresh ones enter the market with the psychology of buying and waiting for high prices to sell. Now they become reluctant holders, who are desperate and praying.
Desperate phase
So the market has ended a cycle consisting of one uptrend and one downtrend. Each trend consists of 3 phases. Of course, the biggest beneficiary is still the brokers. The preys here are traders, investment funds, etc, and especially chickens (newbies).
Tenet 3 is one of the best things about Dow Theory. It combines all the quintessence of technical analysis and market sentiment. Now I’m back to tenet 2.
The market does not fly like a rocket. It moves slowly. Therefore, in a primary trend (level 1), there are always secondary trends (level 2).
Primary and secondary trends
In an uptrend, the primary trend will be bullish. At the same time, a temporary downtrend in an uptrend will be called a secondary trend. A level 1 trend is considered to continue when the price continues to rise above the old high. The market makes higher highs and higher lows.
You can imagine it like a cow. After running for a while, it will walk slowly or stop to take some rest. Then, it steps back to gain momentum and sucks its head to rush forward.
Do you know what this principle means? Let me explain.
(i) This is the wave-in-wave theory. In a large bullish wave, there will be many rising and falling waves within it. And of course, all the small waves inside respect tenet 2 (there are bullish and bearish waves and 3 phases for each wave).
Meaning of the tenet 2
(ii) Don’t be in a hurry! If you missed a trade when the market broke out into the Uptrend, wait for the secondary trend to buy.
Have you discovered anything yet? Dow theory’s tenet 2 is the foundation of the Elliott wave theory, the Fibonacci retracement method and price action, etc. More benefits are still behind. Take your time to read. I believe your thinking after this article will change.
Tenet 4: Averages must confirm each other
Good stocks are only placed in a good market. In other words, If the Dow Jones increases, stocks like Walmart, Google, Apple, etc, will increase.
Or like when Bitcoin (BTC) increases, other Altcoins can benefit and increase accordingly. Now we will take the example of the Crypto market.
Averages must confirm each other
When money flows into the market, it spreads to other coins. So, when BTC rises, other small coins will also increase. Even the junk coins and Shitcoins also increased sharply. This is the spillover effect of cash flow.
The opposite is also true. When BTC falls, money flows out of the market. Other altcoins also sell off. It’s kind of like the Domino effect or herd mentality, running away from the market together.
When you decide to invest in a stock or a certain coin, analyze the general market. You need to see the big picture before investing your precious money.
A coin or a stock is only good when it is placed in a good market.
Tenet 5: Trend must be confirmed with volume
This is one of the pinnacles of Dow Theory – trend and volume. Very few traders understand and know this. What they look at is just a chart. But everything is explained by volume.
This is the reason why I can’t explain with the gold price. I’ll use any top coin so you can see its trading volume.
Trading volume is the money pouring into the market.
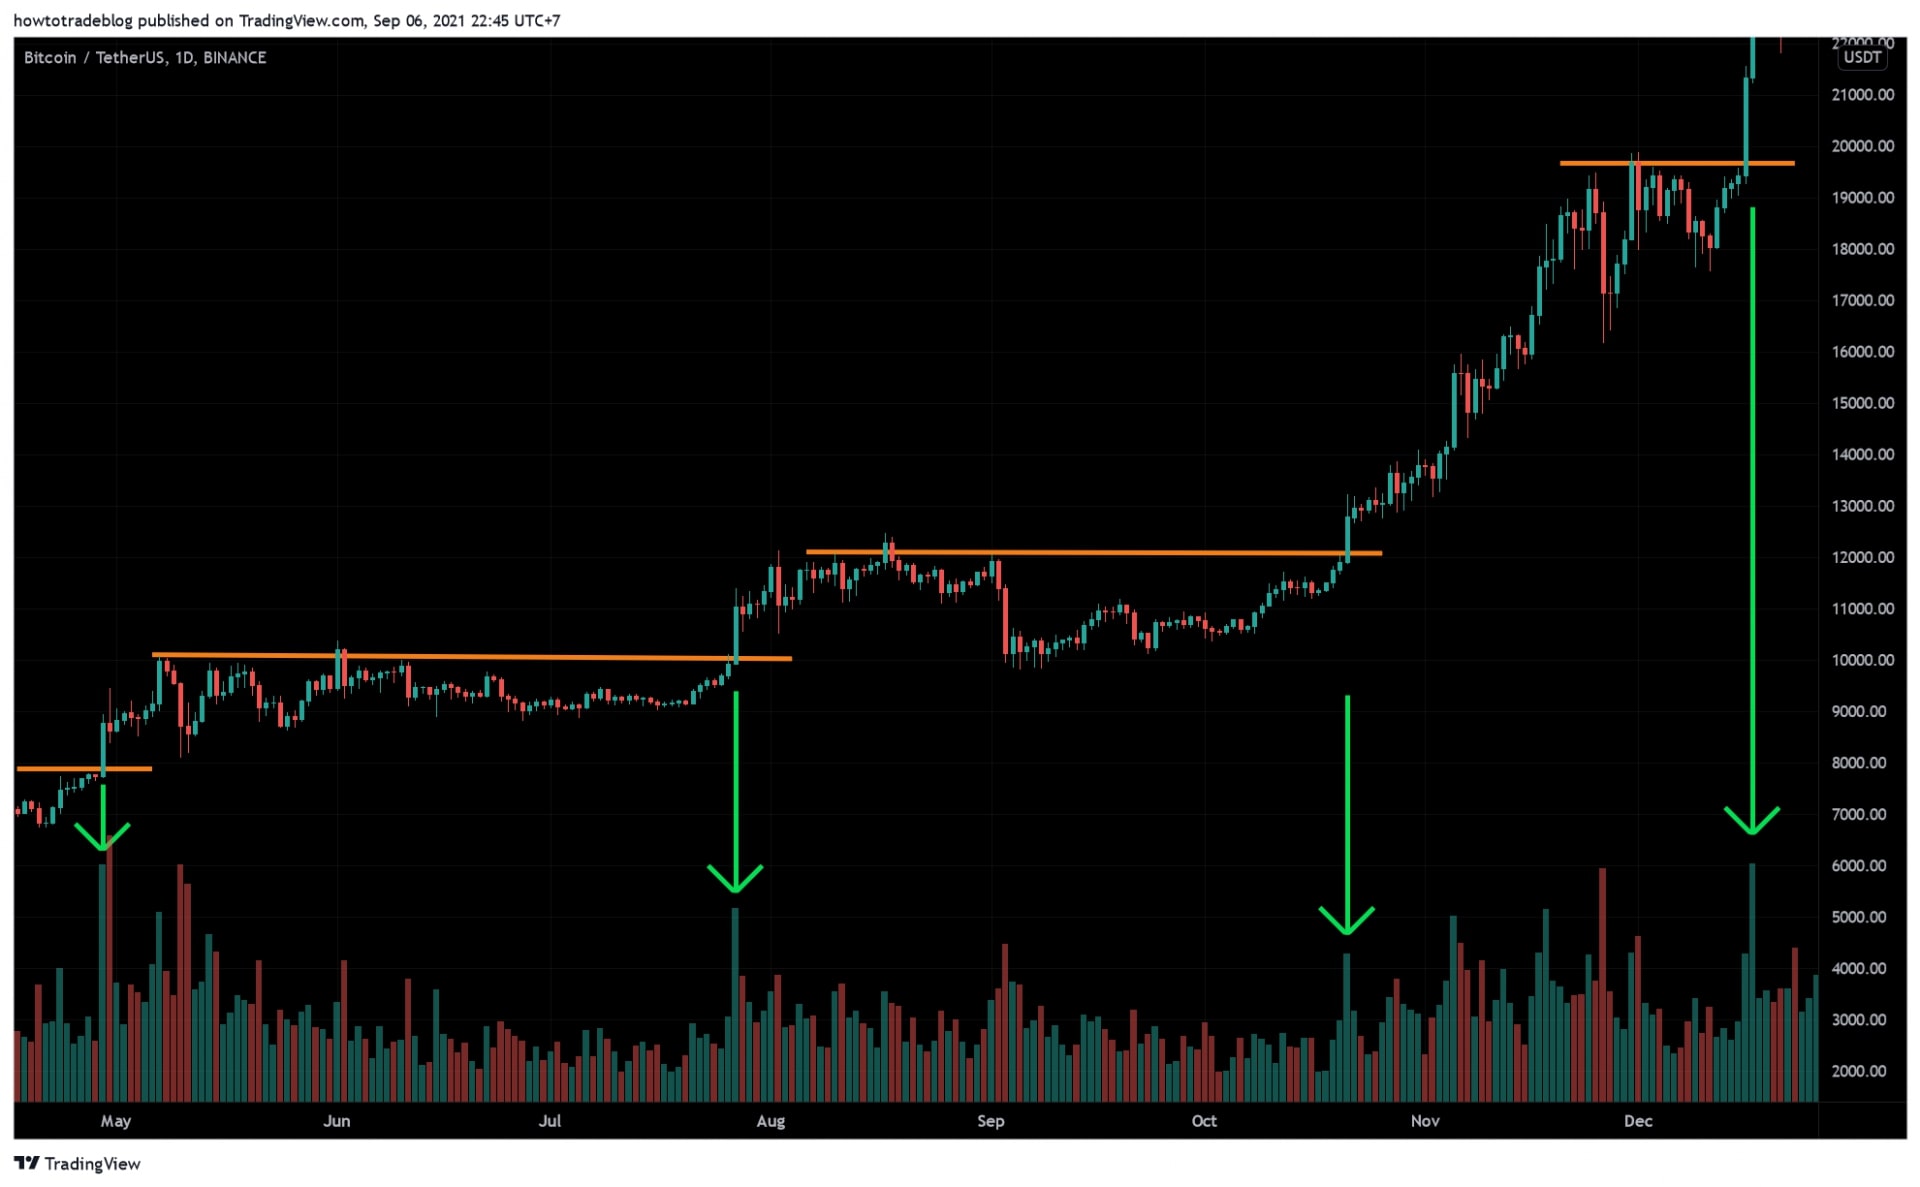
I will take an example with Bitcoin (BTC/USDT on Binance exchange). Take a close look at the Breakout points. What do you see? The uptrend must be accompanied by increased volume. This is a manifestation of the money flowing into BTC. The buyers overwhelm the sellers. Both the volume and the price increase.
Trend must be confirmed with volume
Don’t just look at this example solely. Now, you can turn on the chart and goes to some good stocks or good coins. Open the Volume indicator to immediately verify what you have just read. See if I’m right?
There’s a lot more to the volume, which is the foundation of the VSA method. I will save it for later articles in this series.
Remember that a Breakout is only convincing when there is an increase in cash flow, which is volume.
An uptrend must be accompanied by increased volume
Tenet 6: The main trend is maintained until there are clear signs of reversal
There is a classic saying “Trade what you see, not what you think”. It is alluding to this theory.
Everything is maintained only until there is a clear sign of reversal. Nothing is ambiguous and everything is very clear. Uptrend only ends when the market has finished distributing. There are signs of strong decline and breaking the trend. On the contrary, a downtrend only ends when the market accumulates, reverses the trend with a breakout candle and enters the uptrend.
Clear reversal signal
Dow Theory does not encourage you to buy low and sell high. Dow Theory only encourages you to trade most safely. That is to buy when the market has entered an uptrend and sell when the market has entered a downtrend.
This proves that even Mr. Dow cannot predict the top and bottom of the market. Nobody can do this. Don’t try to buy low and sell high. I’ll repeat it again. What you need to do is to buy when the price enters the explosion phase, hold until the distribution phase and sell when there is a sign that the uptrend has ended.
Remember that two major trends and 3 phases are a long process. It doesn’t happen in 1 or 2 days. This process is very clear and you can completely use your knowledge to analyze and identify.
Summary
Many people say that Dow Theory is just a theory, has a lag, and is not practical.
Wrong! Dow Theory is the source of all technical analysis. It even includes market sentiment in it. You try to look at the picture below to see the emotional development of a trader in trading. Is it similar to Dow Theory? I will have another post to talk about this topic.
Trader’s state of mind
The market has one time or another. The bull/bear cycle is sometimes fast and sometimes slow. But human psychology for hundreds of years has never changed. This is the depth that Dow Theory wants to convey.
After 3 articles, I have finished sharing all the necessary background knowledge. In the next ones, we will only go into practice. From here on, what I quote will lie mainly in this article.
If you’ve been reading till this line, turn on Tradingview and test it out. Test to see if what this DOW theory teaches is correct? See if the market really has 2 trends and 3 phases? Is it true that all breakout points come with high volume? Give it a try. I guarantee you’ll learn a lot more.
This is probably going to be the most important article in this Price Action series. I’ll highlight the words “most important” again because it’s practical. Trading plan is a must-have for any trader in the market.
In all my articles, I always emphasize the word SURVIVE. Therefore, my preparation and planning are aimed at a single goal: SURVIVAL. Believe me, as long as you SURVIVE, you will naturally earn money.
No, the question should be: How much are you willing to lose to enter this market?
Answer: Each person has an income level. You should only put it in the market that is within your reach. The game of money is a game of psychology. A plan on capital and risk management will help you reduce the pressure from psychology.
For example,
+ My income level is $30,000/month => The total capital I am willing to put into my account is $15,000. And for each trade, I only accept a maximum loss of $300. Do you wonder why I can earn 30k USD a month? There will be a separate series to talk about this.
Capital plan and risk management in trading
+ So now, I know in advance the risk when I make the wrong decisions: $300.
+ I will manage capital according to the R/R ratio (1R = 300$).
Psychology preparation in a trading plan
Lower expectations
The easiest way to make a lot of money is to import heroin and sell it to addicts.
The fastest way to get rich is to go to the nearest bank, show a gun and… tell that you are a robber.
The market is definitely not a place to make easy money and get rich quickly. Certainly not. So, if you come here with the illusion of “financial freedom”, it’s almost 99.99% that you will lose money.
Stop fantasizing about trading
The game of money is the game of those with knowledge, patience, and discipline. Without 1 of the 3 things above, you are forever just a “prey” of the market.
So, the first goal will be SURVIVAL. Do everything to survive in the market. Believe me, as long as you exist, money will come naturally. Throughout this series, you will see that. I can lose 5-7 trades in a row, but as long as the account has money, just 1 correct trade I will recover all the losses.
Get used to the fears
– How much will you lose when you are wrong?
Answer: 2% of the account. Is it too big for you? If yes, reduce that number to the lowest level which makes your mind comfortable.
In case you find it difficult to lose $200, reduce it to $20. If you still can’t accept the loss of 20$ for 1 trade, reduce it to 2$. It doesn’t matter, the important thing is that you feel comfortable.
Get used to the fear
– Losing money is the biggest risk in trading?
Answer: No. Losing money is part of the plan and the biggest risk is when you go wrong with the plan.
Experience: Fear of losing money is the biggest reason you let loose your discipline. Don’t dare to cut losses and always take profit early. The more you fear losing money, the more money you lose. So, instead of being afraid, make it a part of the game, face it, accept it and get used to it.
Learn to control everything with reason
Things in the market will always go like this. The price fluctuates => Your account money fluctuates => Your emotions move too. At this point, all previous plans will become superfluous and in the end, you lose everything to the market.
Personal experience: Enter orders correctly with what you have planned and ignore them.
Of course, there are many other traits such as patience, discipline, restraint, etc. But I will include it in later posts in this series.
Diary of September 3, 2021
Deposit $15000 into Exness exchange and $5000 into Binance to prepare capital for this Price Action series. In the next article, we will start to go into the real battle.
Capital in crypto exchange Binance
You should read below articles to prepare for the next one.
– About trend: Uptrend, Downtrend, Sideways, and Retest. The market trend is always the first factor that you and I need to pay attention to. Either follow the trend to make money, or go against the trend and die.
– 2 basic candlestick patterns: Pin Bar and Marubozu. The appearance of these 2 candlesticks in the Supply or Demand zone will be a signal for me to enter an order.
– My favorite time frames for analyzing and predicting price trends are Chart D1 and H4.
– Drawing tool: Tradingview. Entry tool: MT4.
Chart D1 and H4 on Tradingview
– I will trade on every currency pair, gold, and Crypto market using the Price Action method. This will be a long series of practical trading combined with theory. You should re-read some of the articles I list out to be able to better understand what’s next.