I will start this article with an example. You predict that the gold price (XAU/USD) will increase shortly and enter a BUY order. However, the price goes against your prediction and falls. But the more it falls, the more you BUY and even enter with larger trading volumes. As soon as the price rebounds, your account will break even and become profitable.
In Forex trading, I call the above action Loss-holding and stuffing. In contrast to the Profit-holding strategy, Loss-holding is like a suicide mission.
Why do we talk about this dangerous method? Because I have seen a few people make profits from this style of capital management and want to share some points of view about it.
Register an Exness account NowGet $1,000 Free for beginners
What is Loss-holding?
This is a capital management style that does not set Stop Loss (SL). When the price goes against your prediction, you will continue to enter orders to average the price. When the price goes right, you will break even or become profitable.
Scenario 1: Loss-holding + stuffing BUY orders
I enter a BUY order and the price decreases but I decide not to use the stop loss. The more the price drops, the more I continue to open BUY positions. When the price bounces back, I get the breakeven point and close all BUY orders.

Scenario 2: Loss-holding + stuffing SELL orders
On the contrary, the more the price decreases, the more SELL orders I enter. Then I wait for the price to rise again and close all orders.

How to trade with this capital management
The biggest problem of Loss-holding strategy is timing. When will you enter new orders and what is the suitable trading volume? This is a specific case.
For instance, I trade XAU/USD and stuff based on the Fibonacci indicator.
The gold price is on a downtrend in the daily chart. What I need to do is wait for the price to pull back to enter a SELL order. Of course, with the way of capital management, I will not put Stop Loss on this SELL order.

As soon as I enter the SELL order, the price keeps going up. Now it’s time for me to use Fibonacci retracement to determine the next SELL entry price zones. Then I start the process of loss-holding and stuffing.
I continue to open 2 SELL orders at the Fibo 38.2 and Fibo 50. Finally, when the price falls back and my orders are breakeven, I close all 3 SELL orders.

EA capital management (auto trading bot)
Loss-holding and stuffing strategies are one of EA’s trading methods (in short of Expert Advisor, also known as Trading bots). I have met many successful cases of using EAs to make money in this market.
There are many methods of using EAs with Take Profit but without Stop Loss. You can see a simple example below.
EA stuffed orders with only 1 currency pair EUR/USD.
BUY and SELL EUR/USD. After looking at the picture you will understand. All orders have only Take Profit point but no Stop Loss.

The lower the price, the EA will use the loss-holding strategy and stuff more BUY orders with the larger trading volume. As long as the price retraces to touch TP, all orders will be closed.
Of course, this method can only be used for a certain number of currency pairs. Besides, the trading capital must also be large to cover losses. But in general, until now, this is still considered a way to make money in the Forex market.
Evaluate the Loss-holding strategy
Ignore the above because it’s basically just writing, speaking, and talking on paper. When you use this way of capital management to actually trade in the market, your account will burn sooner or later.
You need to read to avoid using it later.
Account status
I usually divide the account status when trading Forex into 5 categories:
(1) Big loss
(2) Small loss
(3) Break even
(4) Small win
(5) Big win
With this capital management method, your account can only fall into 4 states from (1) to (4).

Every trader when using the loss-holding strategy just wants to break even as quickly as possible. So, if you are lucky, you will only break even or win a small amount. On the contrary, if you are unlucky, you have no money left in your account.
Psychological factors
Why do you use this method in the first place? Is it because of your trading strategy or because you are afraid of losing money?
Inexperienced traders often think like this. “If I don’t close the order, it means I still don’t lose any money. The market always goes up and down. Sooner or later, I will break even and gain some profits.”
So, they embrace two things in their minds. Fear of losing money and hope. At this point, their money will be decided by the market and they no longer hold the initiative in their hands. Of course, Mr.Market never ignores delicious preys like them.
Market factors
“Go against the trend + Loss-holding + Stuffing = Suicide”.
If you have experienced it, you will understand immediately when I write the above formula. It’s okay a couple of times when you’re lucky enough to win. But if you repeat the above formula over and over again, you’ll lose every penny in your pocket for sure. Here is a specific case.
In early November 2020, the US Presidential election event occurred. This is an account that placed SELL positions, used Loss-holding and stuffing strategy. The account holder even topped up more money to hold those orders. Result: Lost nearly $30,000 in just 2 days.

To conclude
My advice is that you shouldn’t use the Loss-holding method to manage your money in Forex. This strategy will give you negative emotions in trading. They are the fear of losing money and the hope that the price will return to help you meet the breakeven point. You won’t be able to do anything but observe the price constantly on MT4 or other trading platforms.
If you use this method for EA trading, I have no opinion. But if you use it yourself, I believe that sooner or later your account will go on fire. So my last line is don’t try to use it and regret later.
Register an Exness account NowGet $1,000 Free for beginners
The post Loss-Holding – An Insane Money Management Method In Forex Trading appeared first on How To Trade Blog.
source https://howtotradeblog.com/loss-holding-money-management-method-forex/


 This is a whole chapter about real trading. I will talk more about money management and trading psychology. Moreover, I will also share my personal experiences when trading with the strategy: Trend + Supply Demand zones.
Of course, since it is real trading, we will have a more meticulous way of entering orders. Please read chapters 1, 2, 3 that I wrote earlier for better understanding.
Registe...
Source from :
This is a whole chapter about real trading. I will talk more about money management and trading psychology. Moreover, I will also share my personal experiences when trading with the strategy: Trend + Supply Demand zones.
Of course, since it is real trading, we will have a more meticulous way of entering orders. Please read chapters 1, 2, 3 that I wrote earlier for better understanding.
Registe...
Source from :  “Following the footsteps of Big Boys or big organizations in the market,
you will make money.”
This is the motto of those who prefer the school of trading according to the Supply and Demand zones.
This is one of the best trading systems you need to know. Let's start from chapter 1 to chapter 4. I believe you will have useful knowledge after reading this series.
Register an Exness account No...
Source from :
“Following the footsteps of Big Boys or big organizations in the market,
you will make money.”
This is the motto of those who prefer the school of trading according to the Supply and Demand zones.
This is one of the best trading systems you need to know. Let's start from chapter 1 to chapter 4. I believe you will have useful knowledge after reading this series.
Register an Exness account No...
Source from : 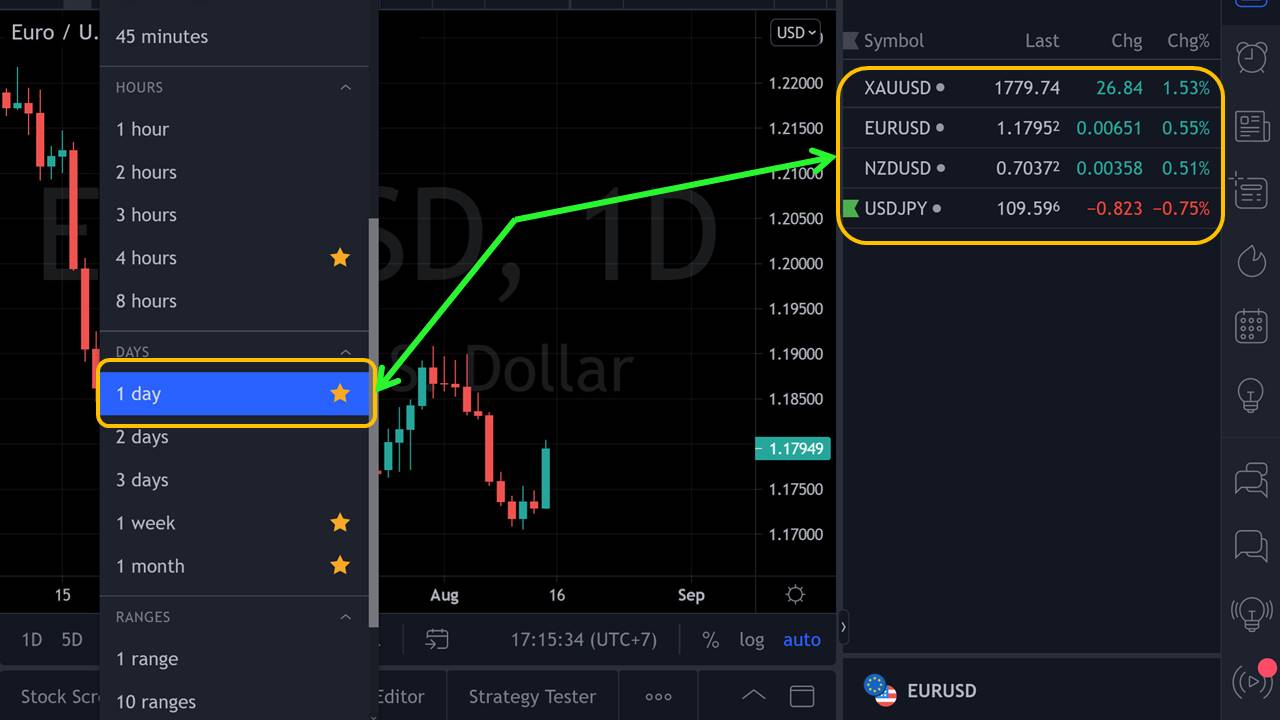 Trading conditions for Trend and Supply Demand strategy[/caption]
- I manage money according to the Risk/Reward ratio (R/R). There is a specific guide below to help you set up Stop Loss (SL) and Take Profit (TP).
If you still don’t understand the uptrend and downtrend clearly, please read the two articles below.
+
Trading conditions for Trend and Supply Demand strategy[/caption]
- I manage money according to the Risk/Reward ratio (R/R). There is a specific guide below to help you set up Stop Loss (SL) and Take Profit (TP).
If you still don’t understand the uptrend and downtrend clearly, please read the two articles below.
+  How to enter BUY orders[/caption]
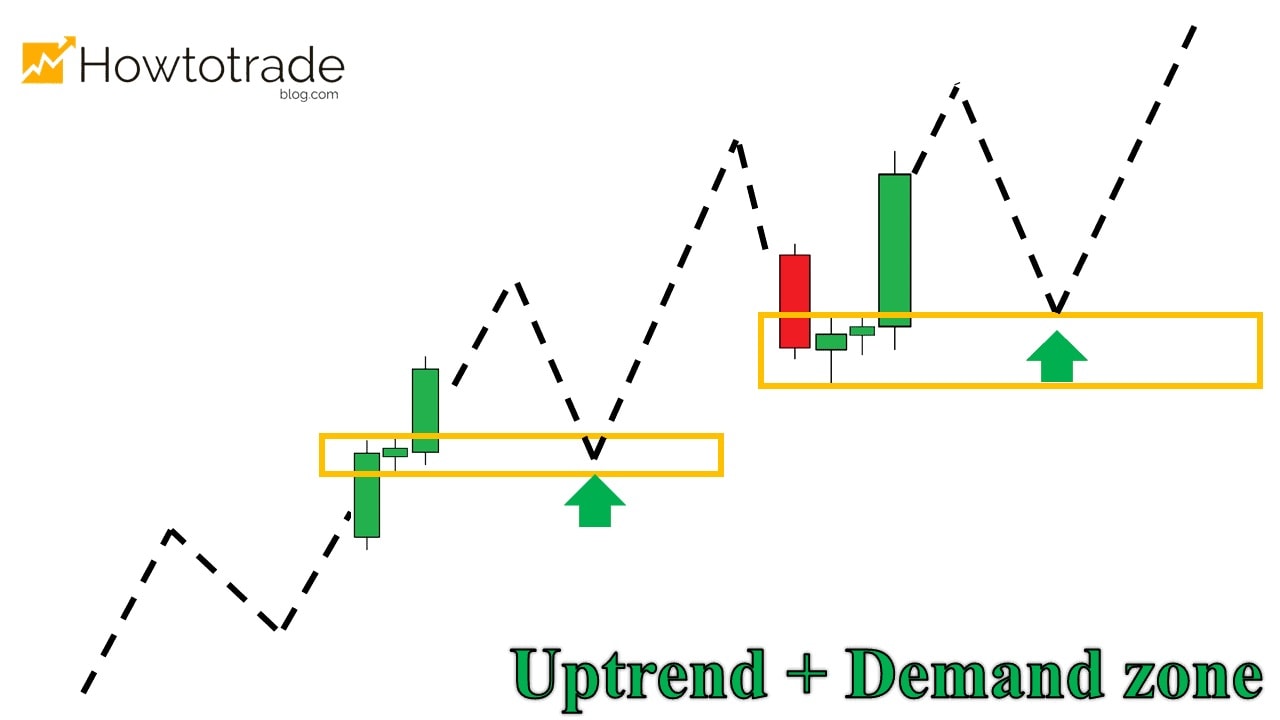
For detailed example with USD/JPY (from January 27, 2021 to February 17, 2021)
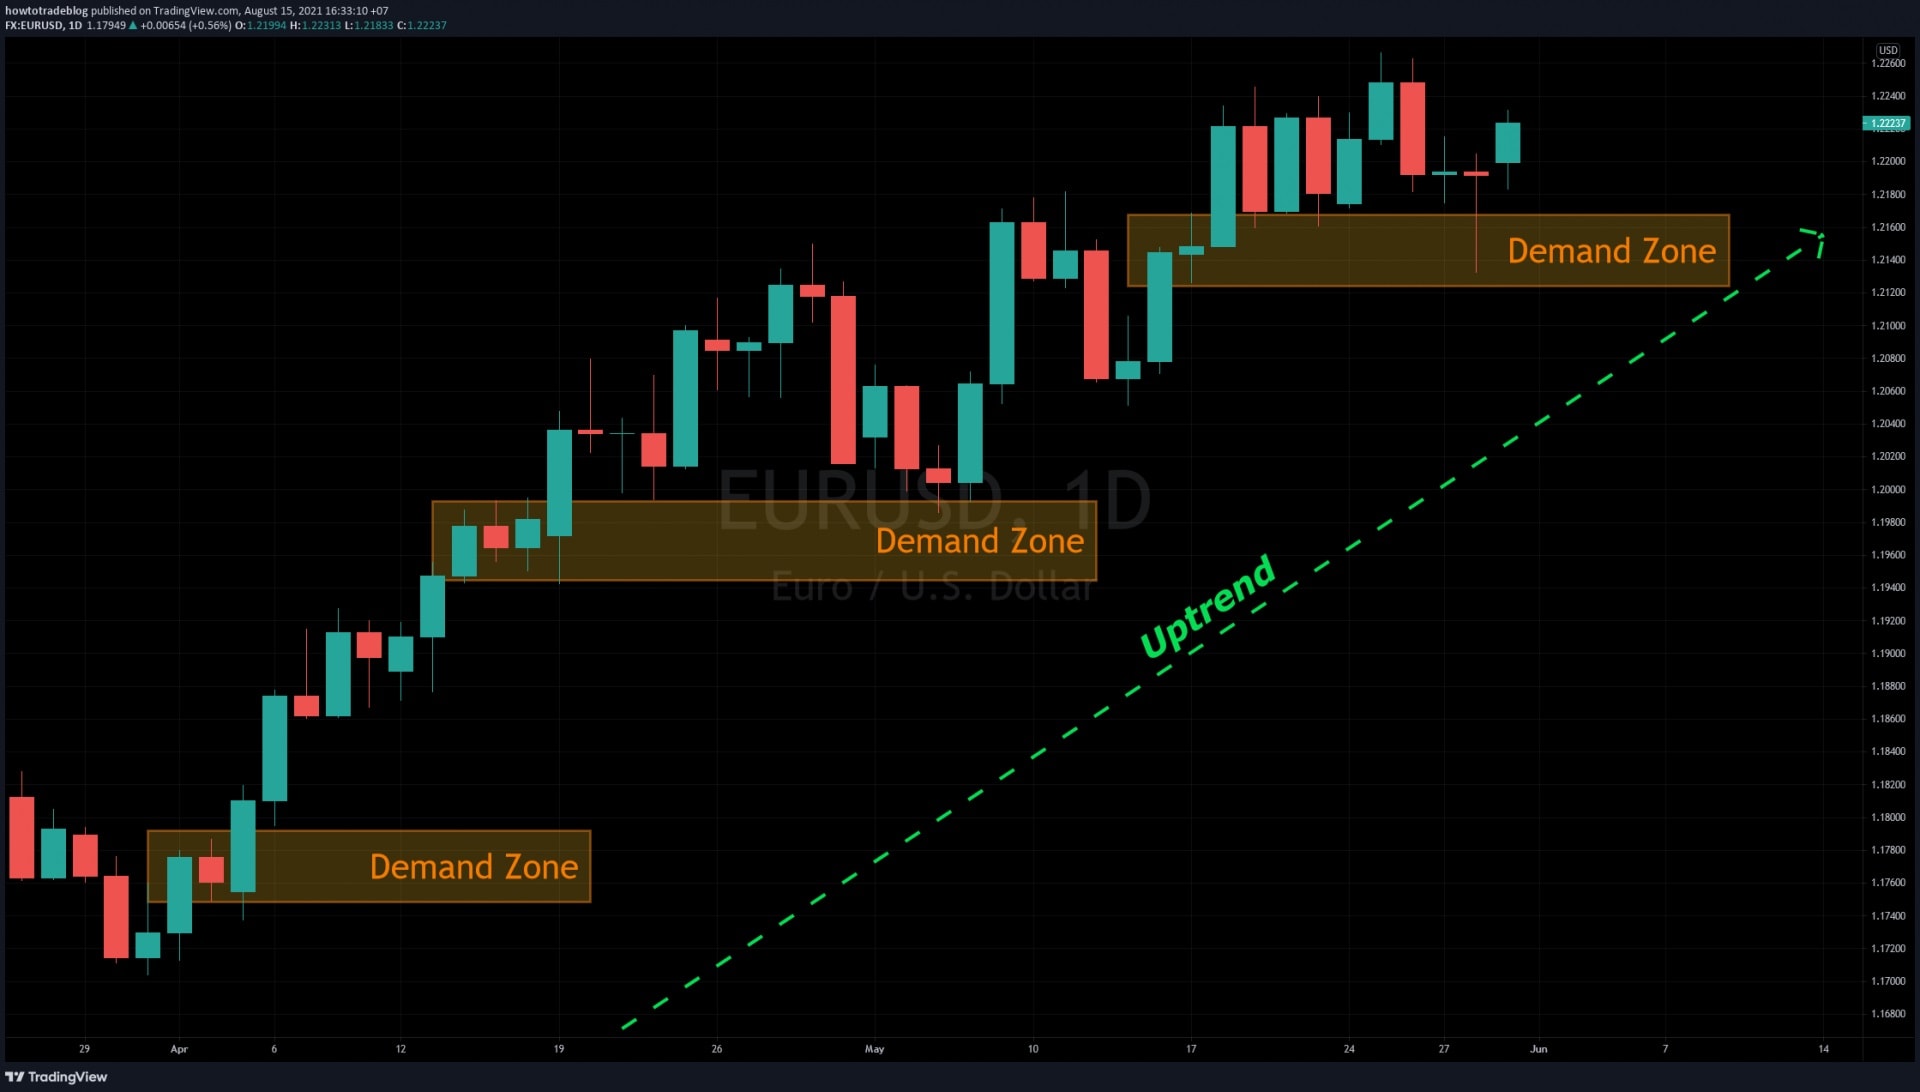
The USD/JPY entered an uptrend period.
Identified and drew the Demand zone on the chart (yellow area). My job was to wait for the price to come back and retest this zone and open a BUY order.
[caption id="attachment_16589" align="aligncenter" width="1920"]
How to enter BUY orders[/caption]
For detailed example with USD/JPY (from January 27, 2021 to February 17, 2021)
The USD/JPY entered an uptrend period.
Identified and drew the Demand zone on the chart (yellow area). My job was to wait for the price to come back and retest this zone and open a BUY order.
[caption id="attachment_16589" align="aligncenter" width="1920"]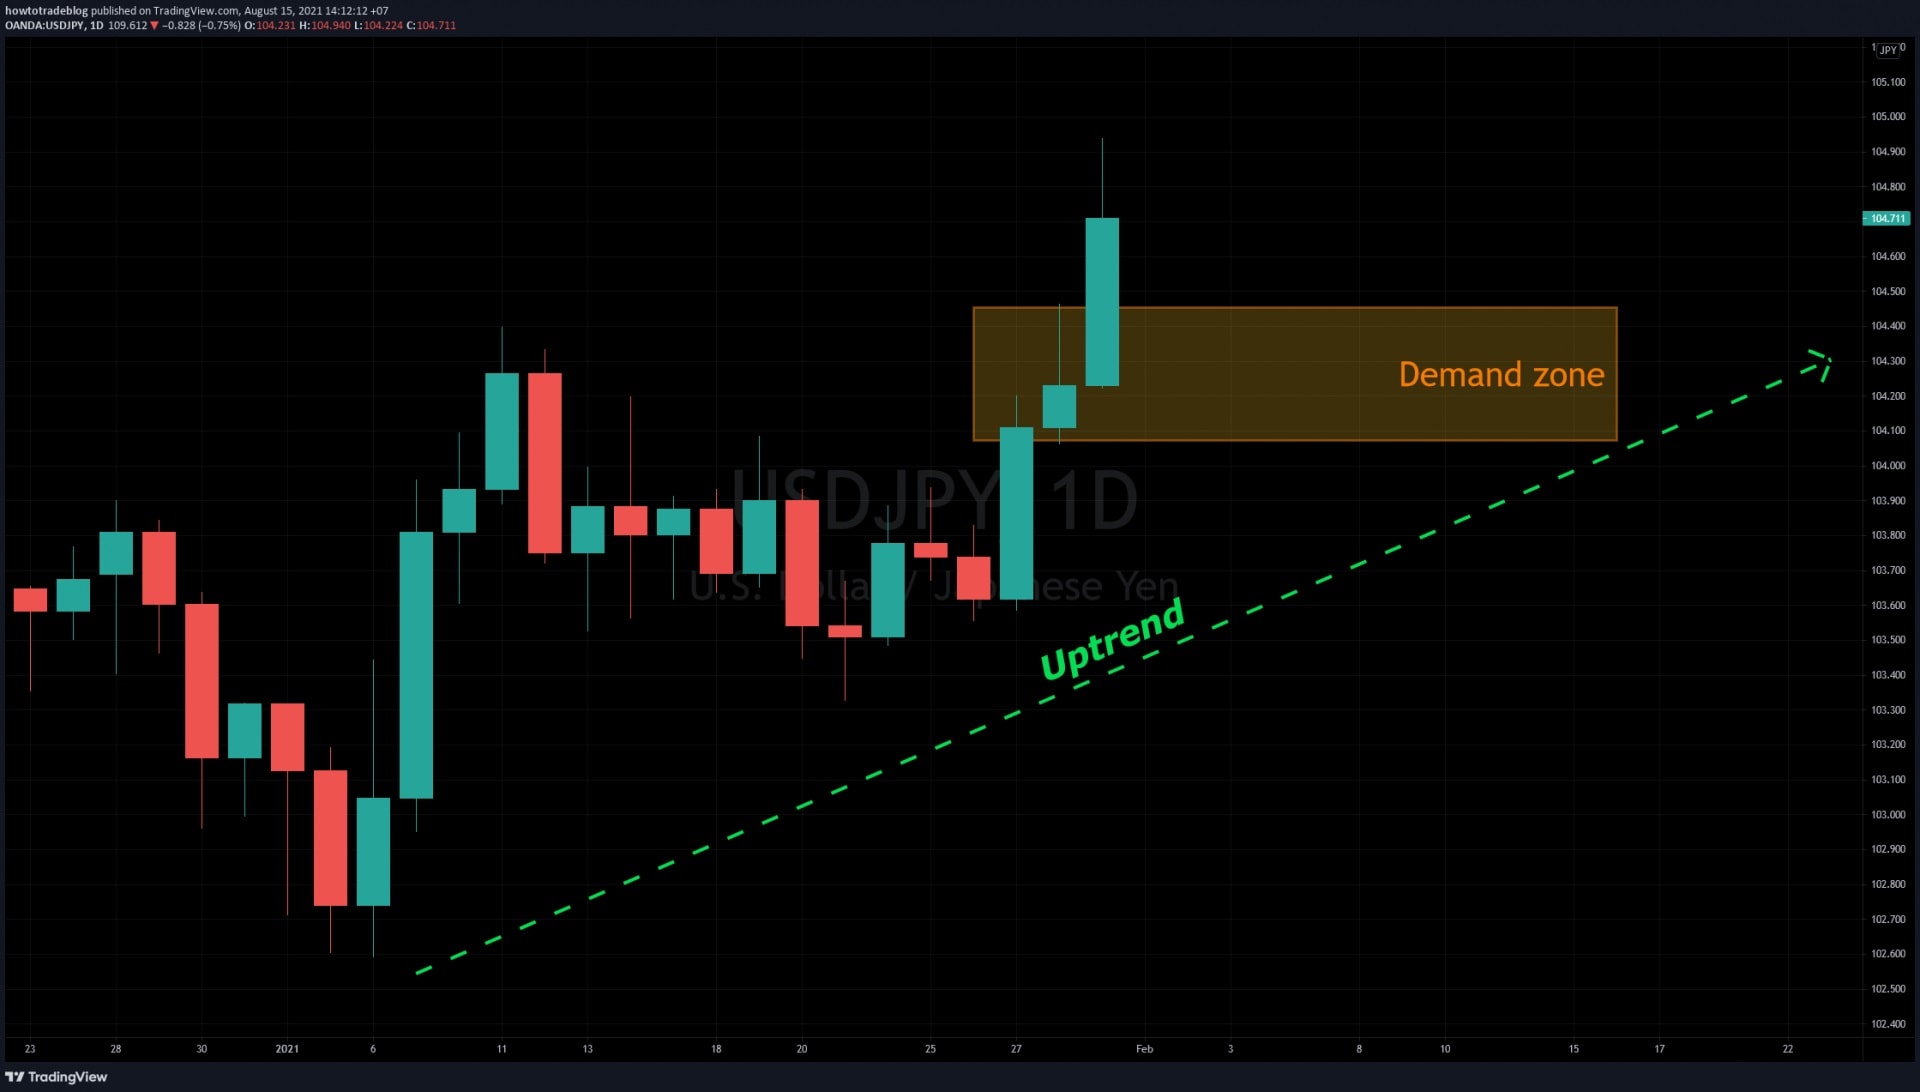 Identify the Demand zone in the Uptrend[/caption]
The price retested the Demand zone that I drew and created a trading signal with a Doji candlestick.
+ Opened a BUY order right away.
+ Set the SL below the Demand zone.
+ Set the TP at the previous top.
[caption id="attachment_16590" align="aligncenter" width="1920"]
Identify the Demand zone in the Uptrend[/caption]
The price retested the Demand zone that I drew and created a trading signal with a Doji candlestick.
+ Opened a BUY order right away.
+ Set the SL below the Demand zone.
+ Set the TP at the previous top.
[caption id="attachment_16590" align="aligncenter" width="1920"]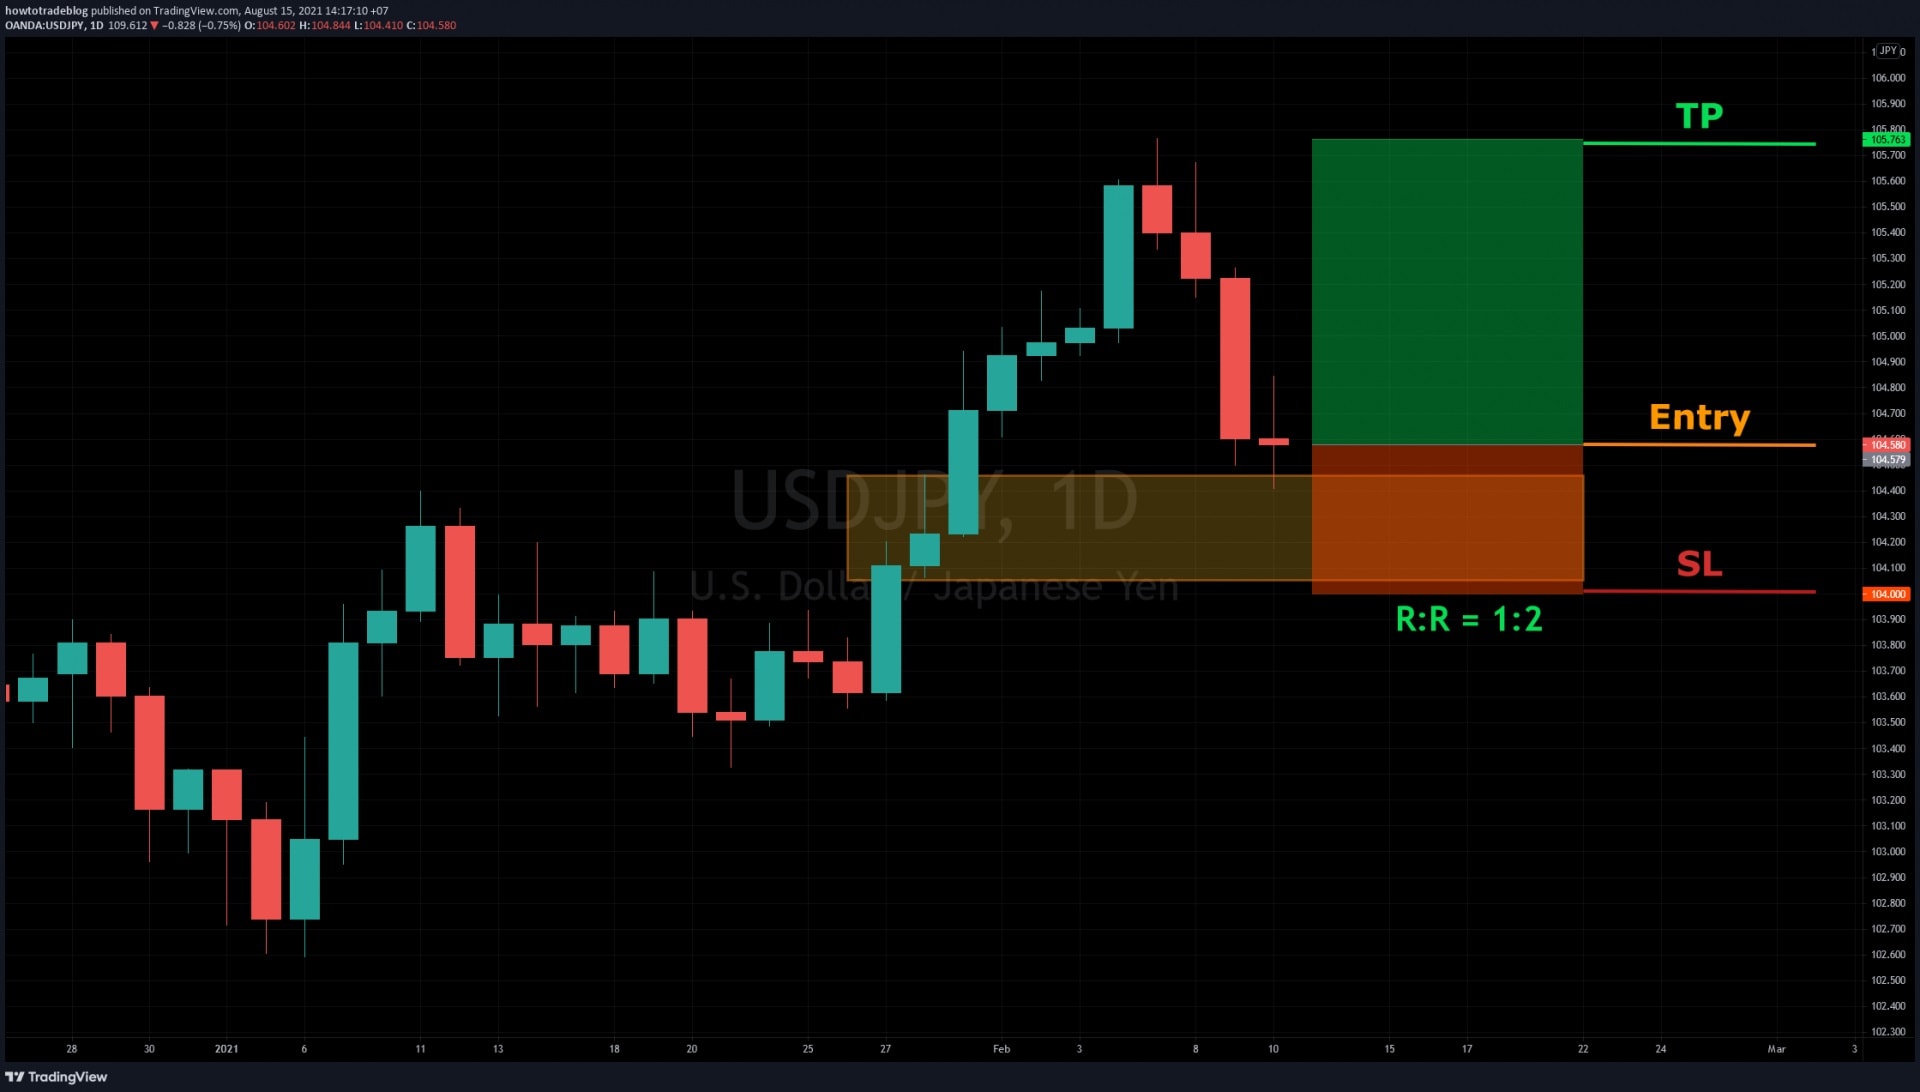 Open a BUY trade[/caption]
The price bounced back to the TP point. In this trade, I won 2R.
[caption id="attachment_16591" align="aligncenter" width="1920"]
Open a BUY trade[/caption]
The price bounced back to the TP point. In this trade, I won 2R.
[caption id="attachment_16591" align="aligncenter" width="1920"]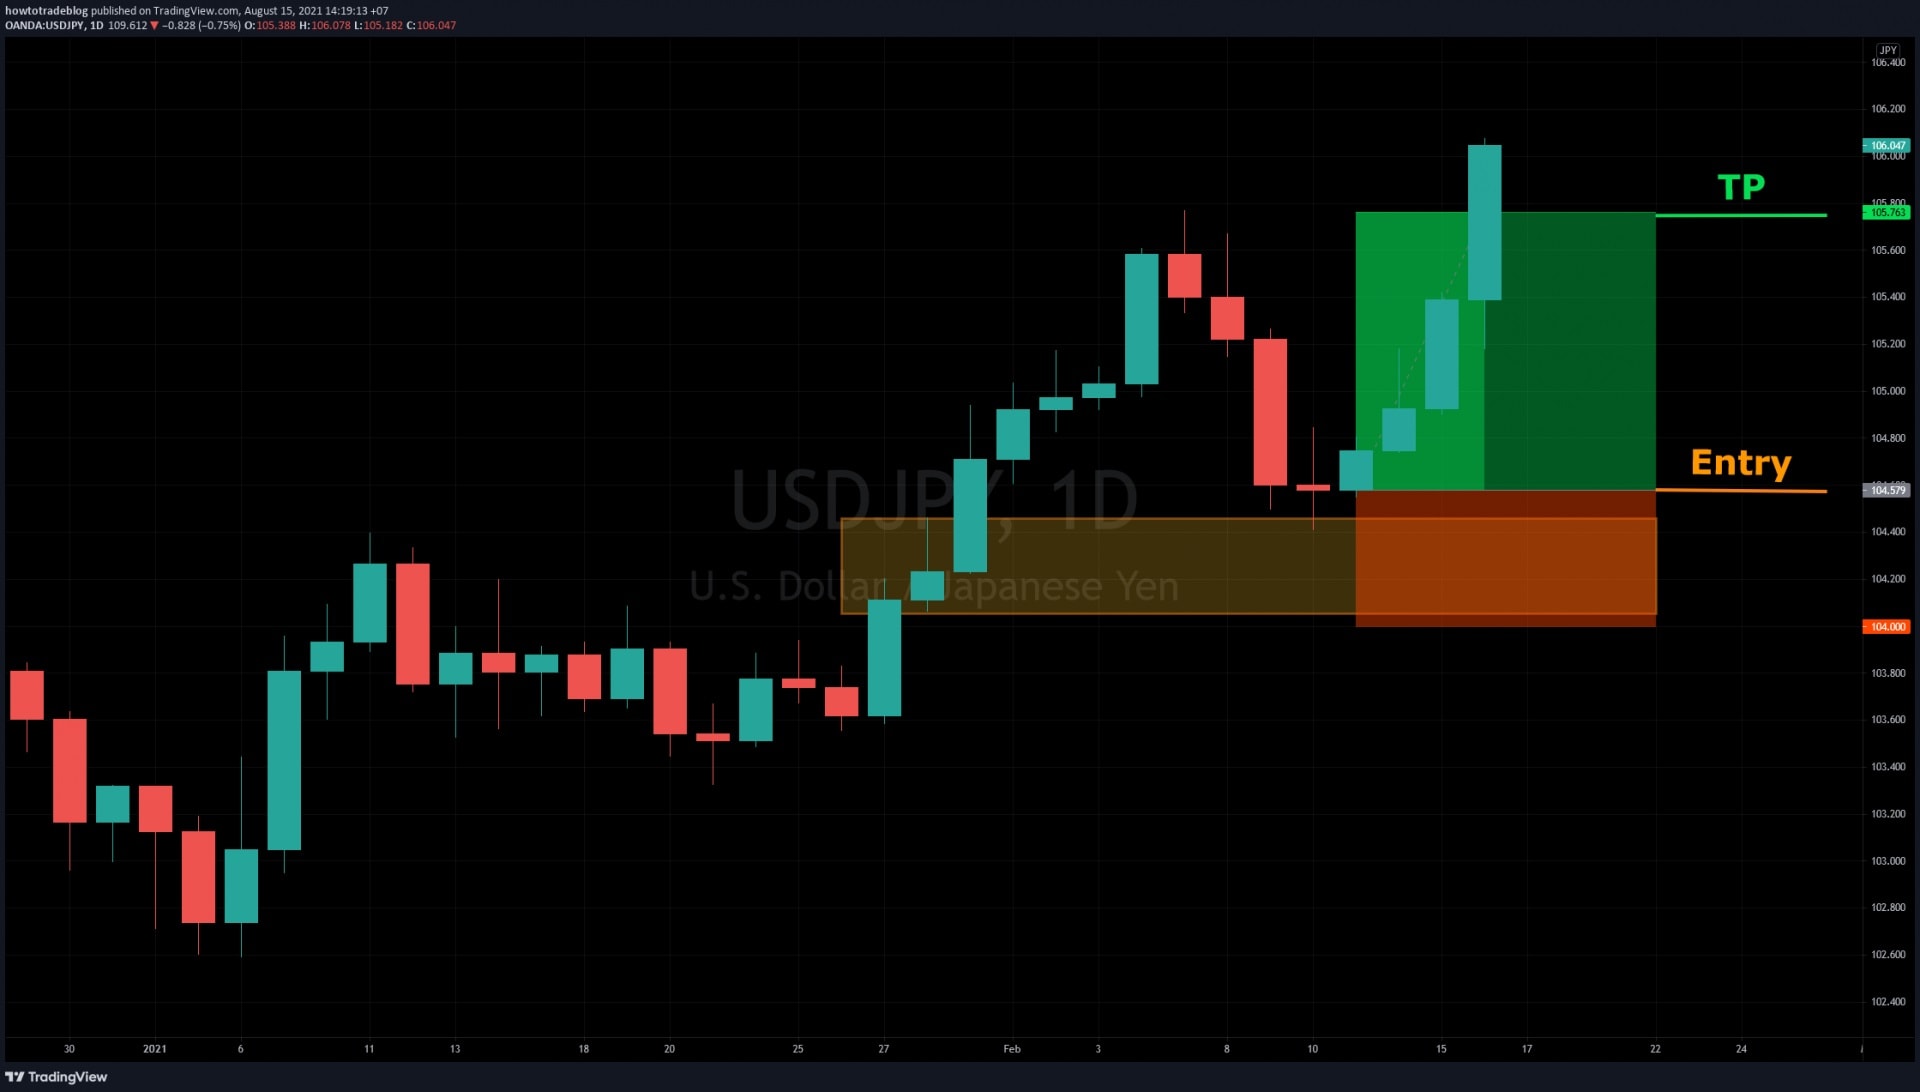 A nice result with 2R profit[/caption]
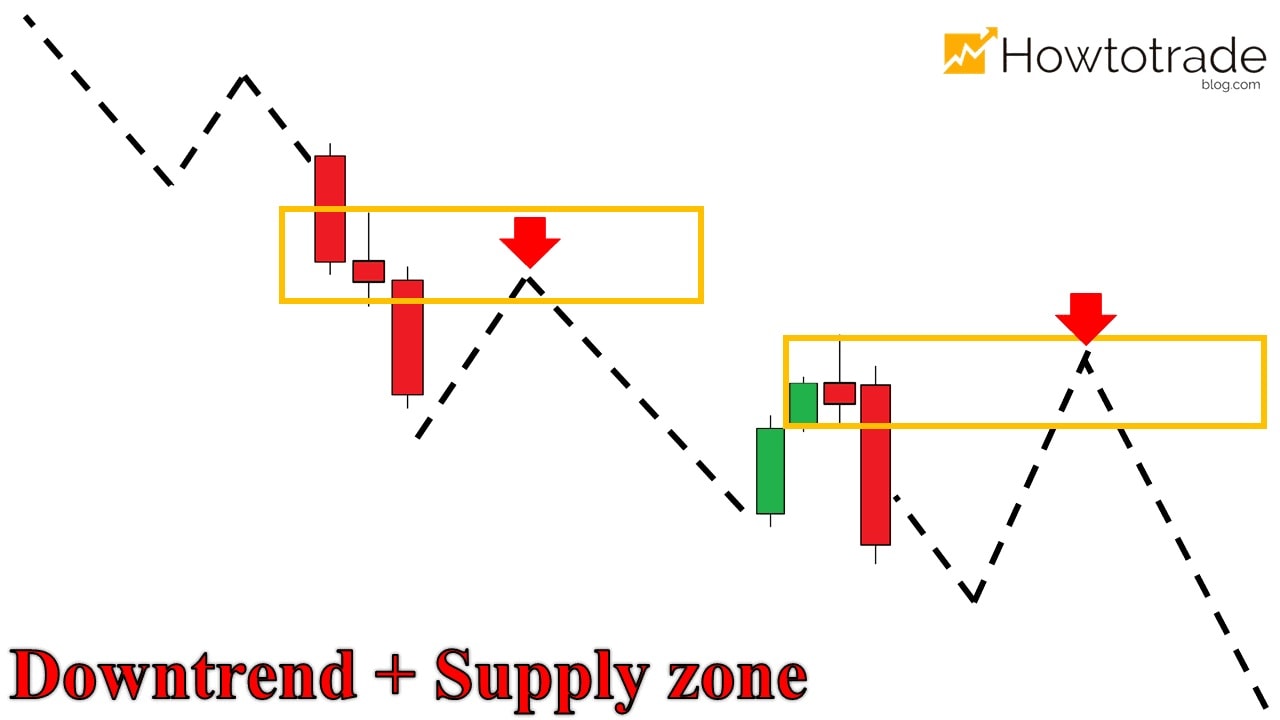 How to open SELL orders[/caption]
For specific example with USD/JPY (from July 5, 2021 to August 5, 2021)
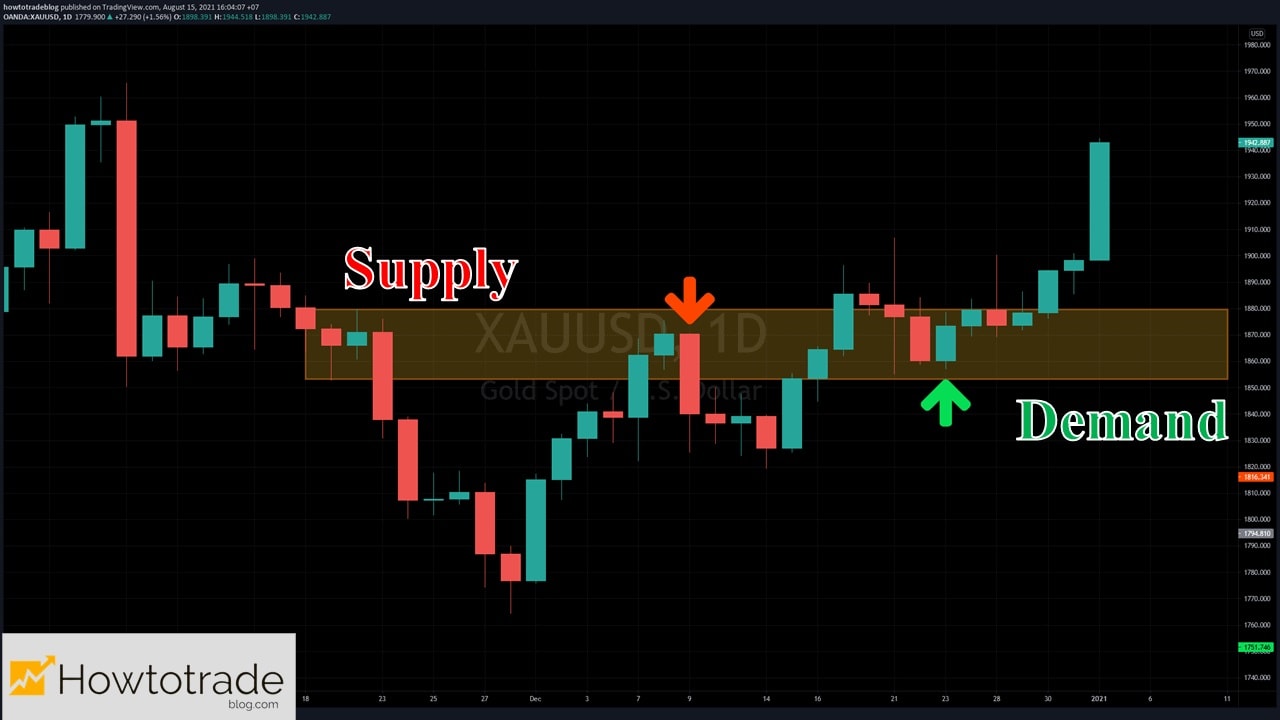
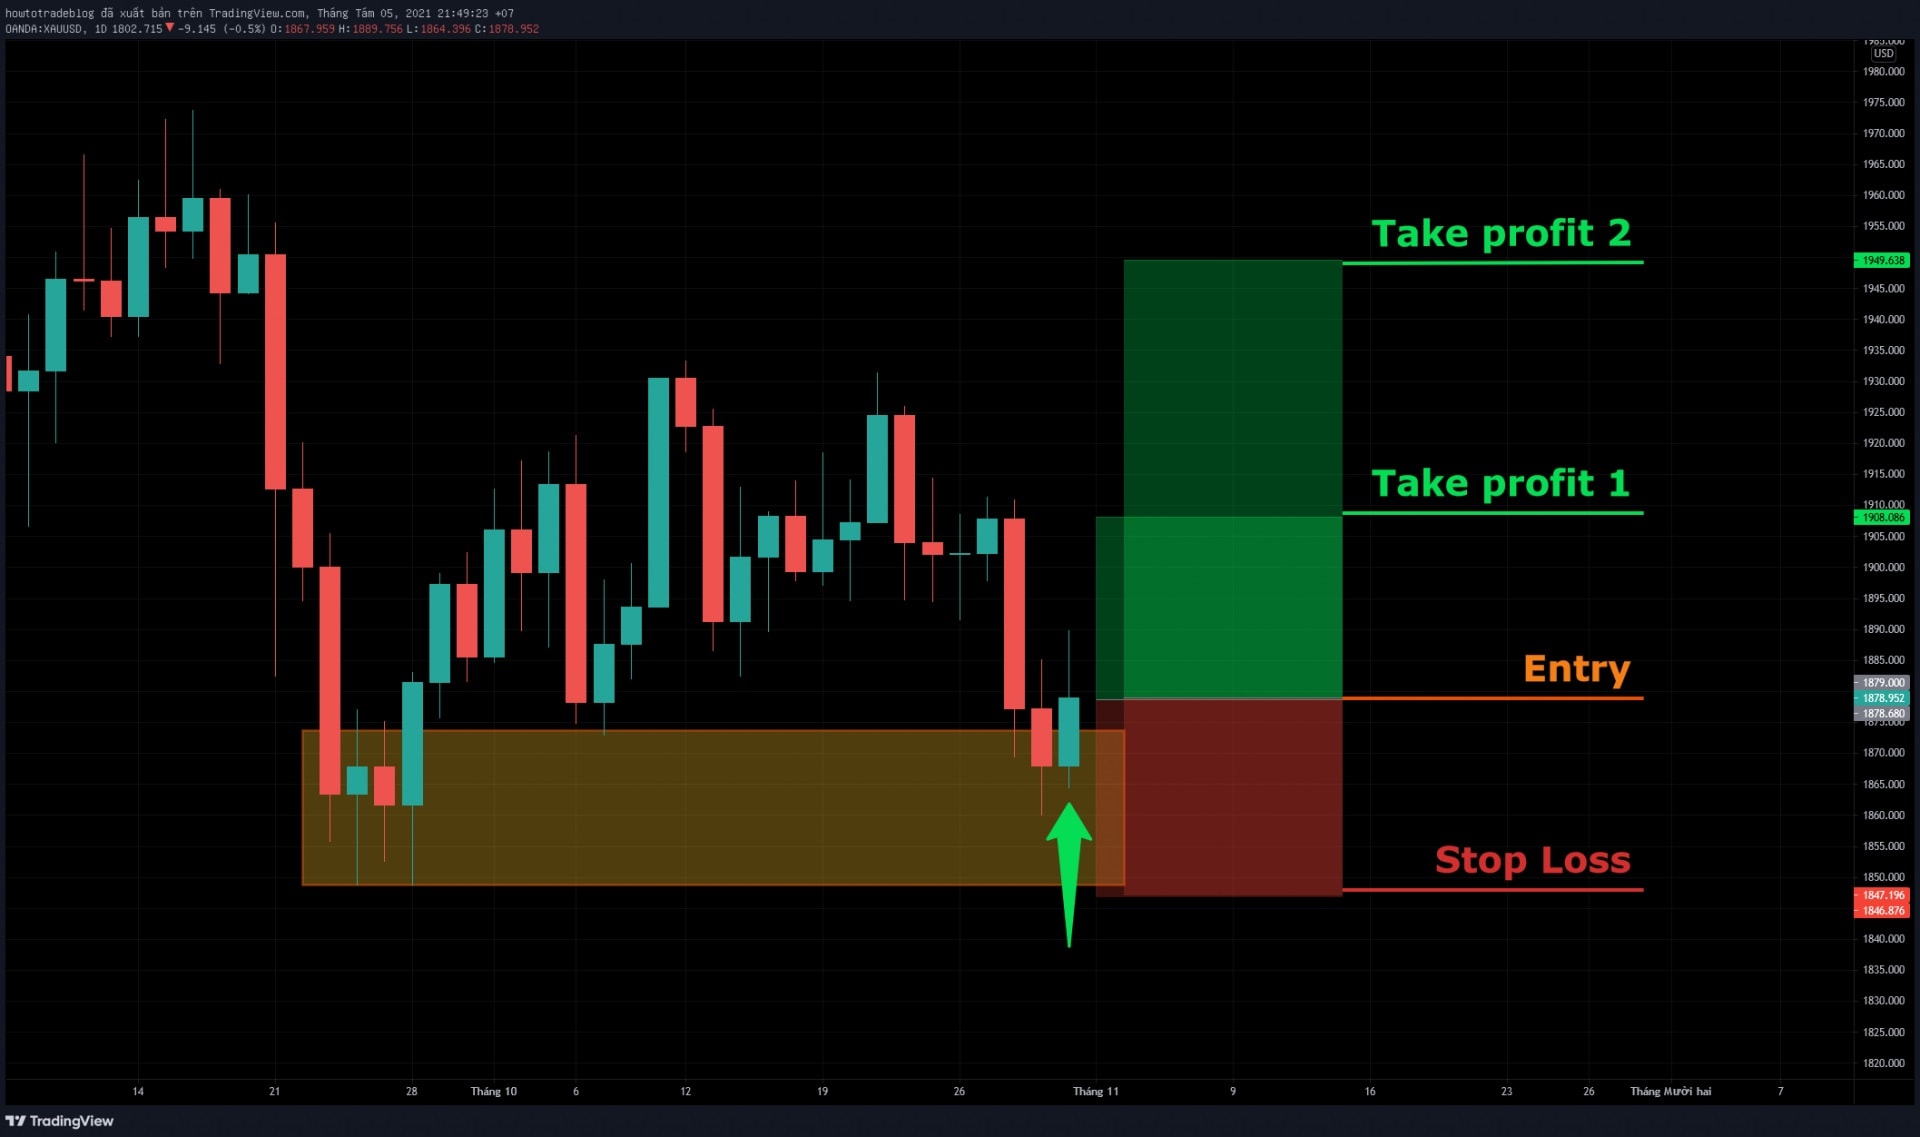
USD/JPY was in a downtrend. This decreasing process created the Supply Zone (yellow area) on the chart. This was the main zone I waited for a SELL order.
[caption id="attachment_16593" align="aligncenter" width="1920"]
How to open SELL orders[/caption]
For specific example with USD/JPY (from July 5, 2021 to August 5, 2021)
USD/JPY was in a downtrend. This decreasing process created the Supply Zone (yellow area) on the chart. This was the main zone I waited for a SELL order.
[caption id="attachment_16593" align="aligncenter" width="1920"]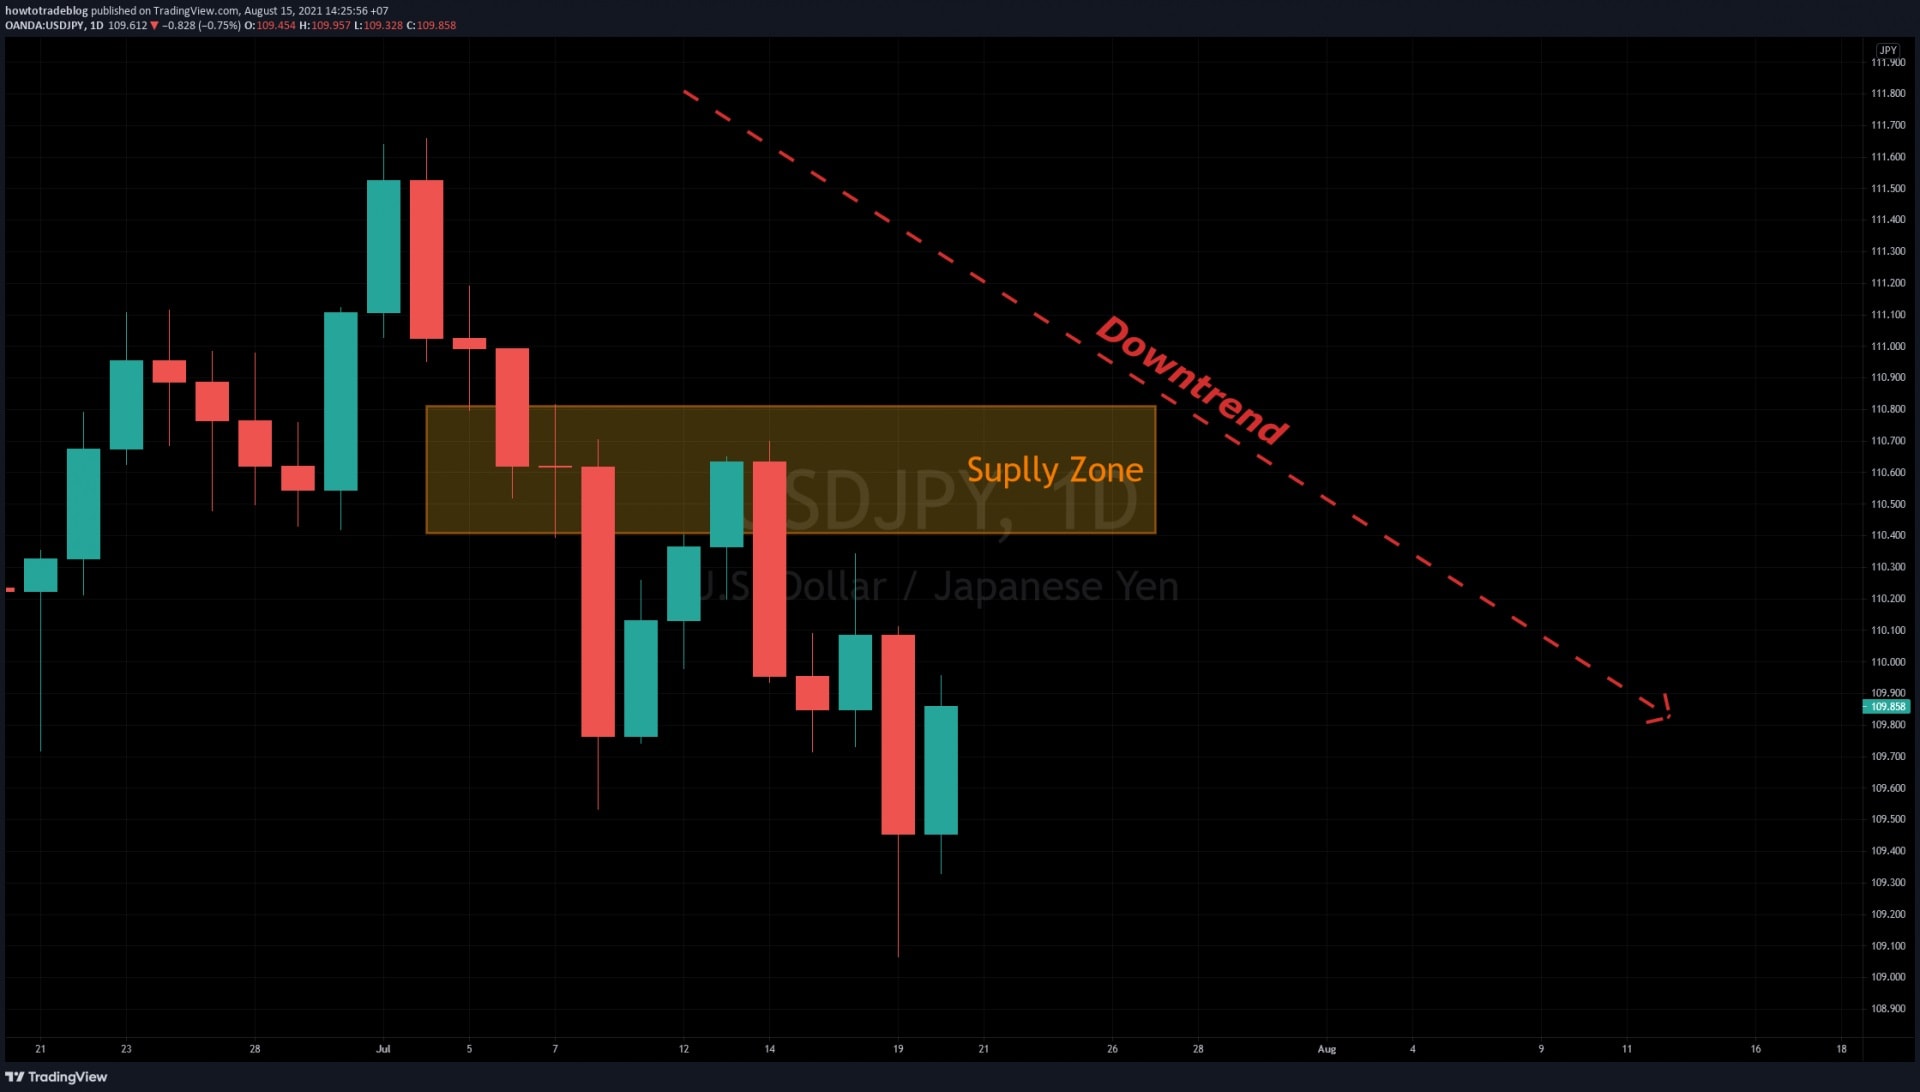 Identify the Supply zone in a downtrend[/caption]
The price moved back to the Supply zone and showed signs of reversal.
+ Entered a SELL order here.
+ Set the SL above the Supply zone.
+ Set the TP at the previous bottom.
[caption id="attachment_16594" align="aligncenter" width="1920"]
Identify the Supply zone in a downtrend[/caption]
The price moved back to the Supply zone and showed signs of reversal.
+ Entered a SELL order here.
+ Set the SL above the Supply zone.
+ Set the TP at the previous bottom.
[caption id="attachment_16594" align="aligncenter" width="1920"]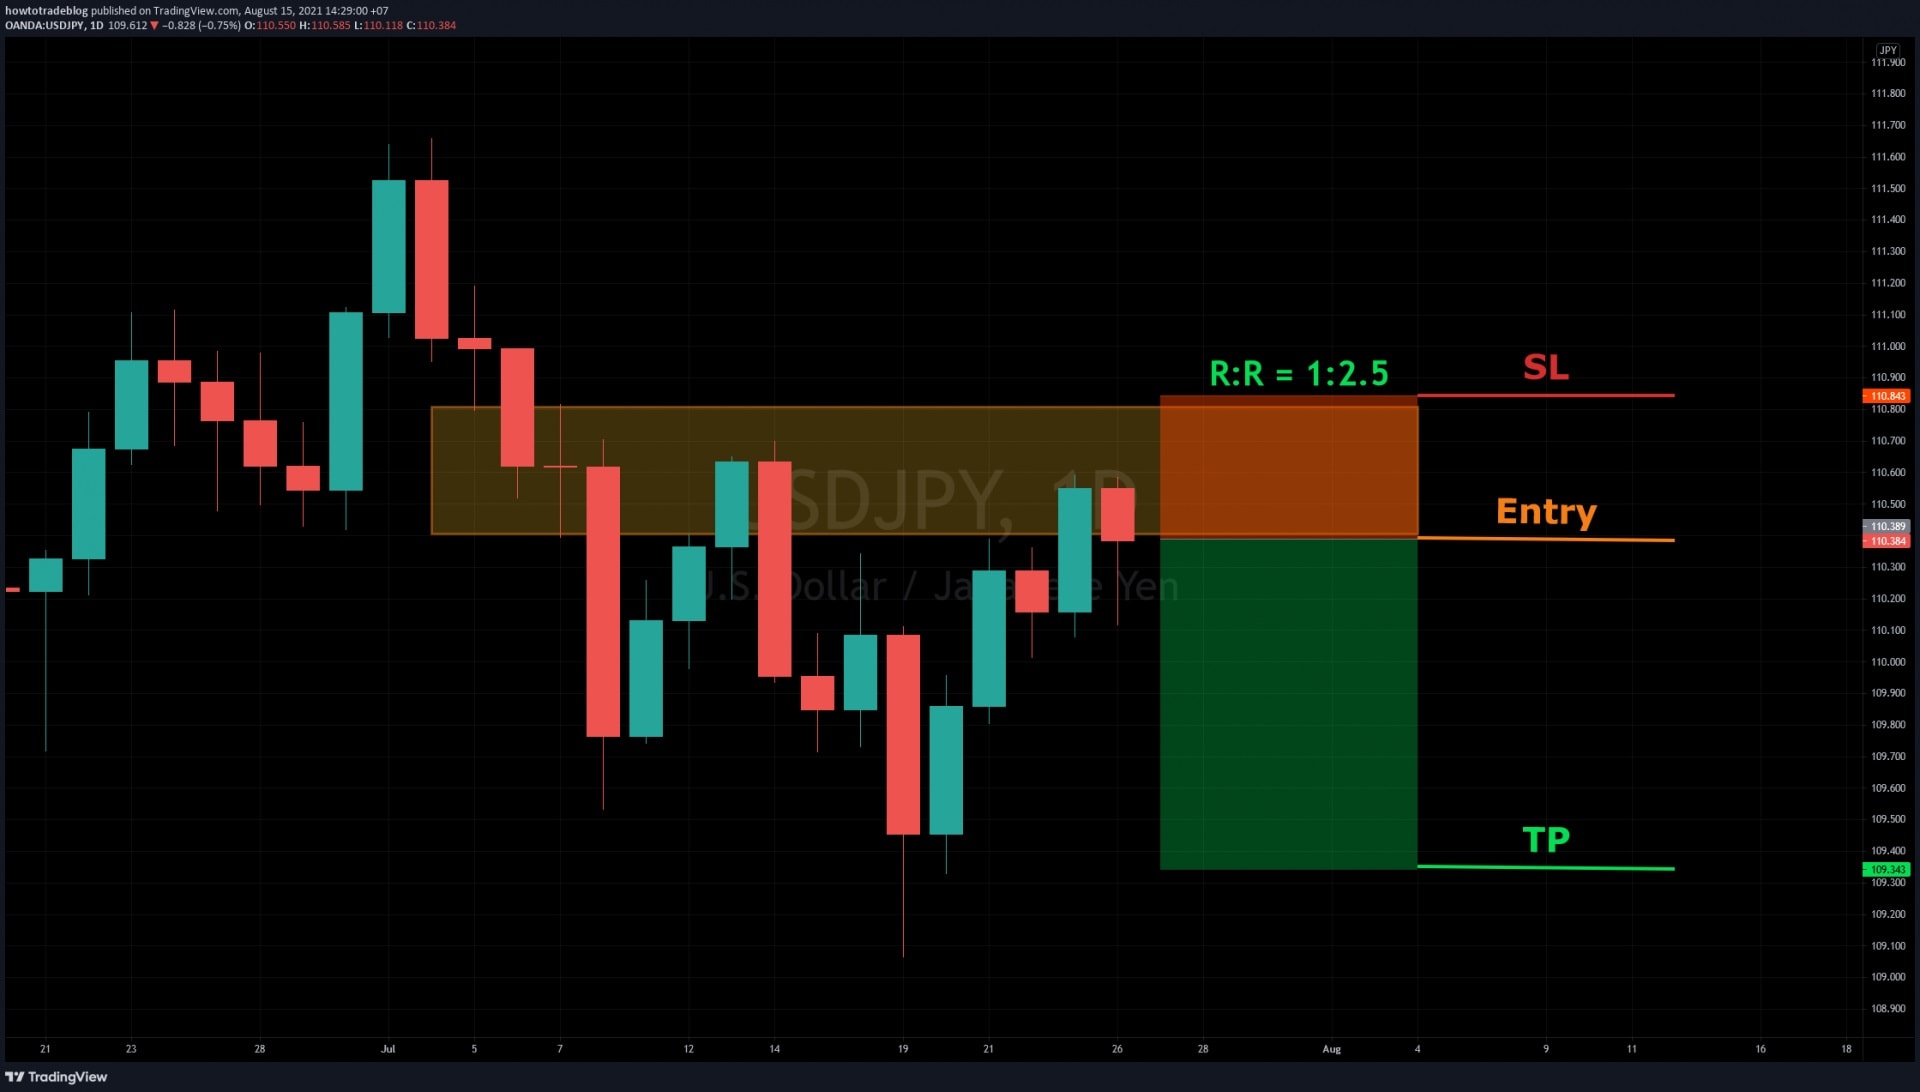 Enter a SELL order in the Supply zone[/caption]
Result: This SELL order has reached the TP with 2.5R.
[caption id="attachment_16595" align="aligncenter" width="1920"]
Enter a SELL order in the Supply zone[/caption]
Result: This SELL order has reached the TP with 2.5R.
[caption id="attachment_16595" align="aligncenter" width="1920"]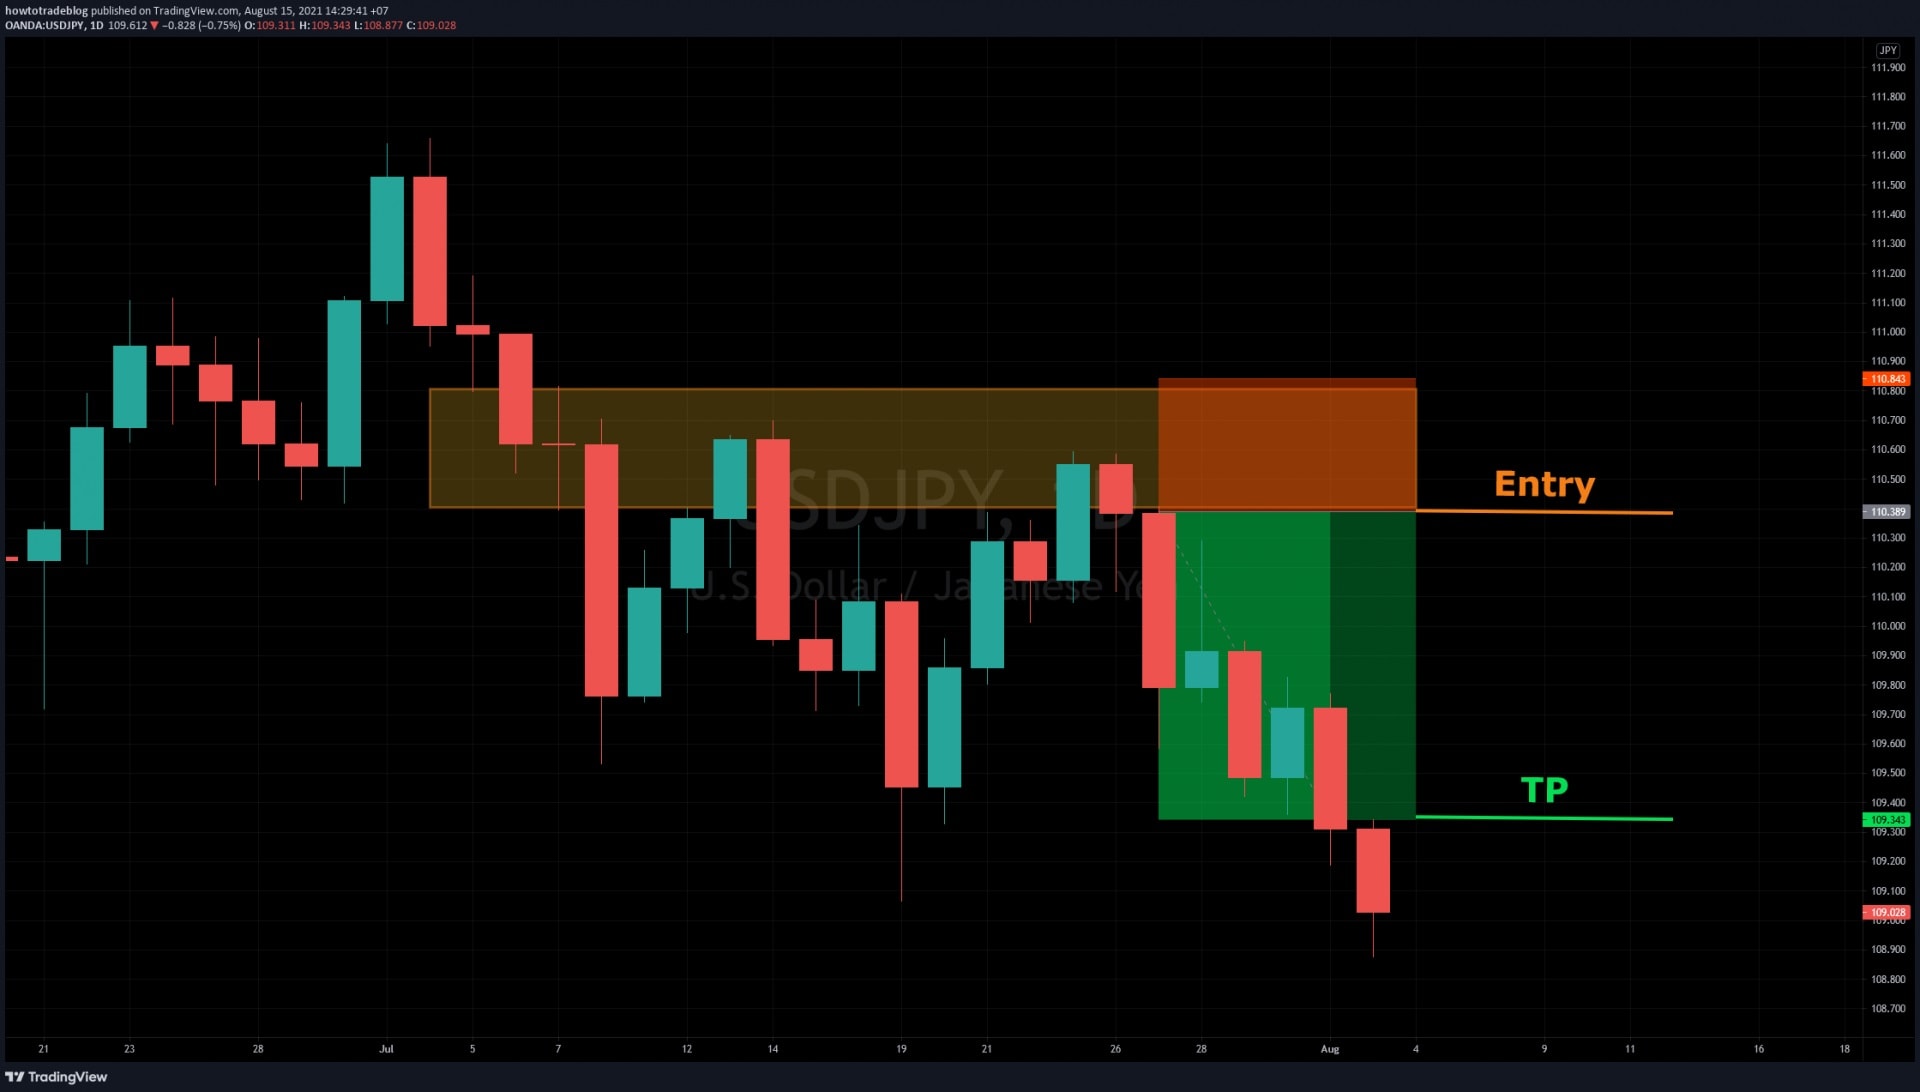 Sell order results with 2.5R profit[/caption]
 Identifying the main trend of the market is the top priority[/caption]
 The signal when Supply and Demand zones could be broken[/caption]
 Swap between Supply and Demand[/caption]
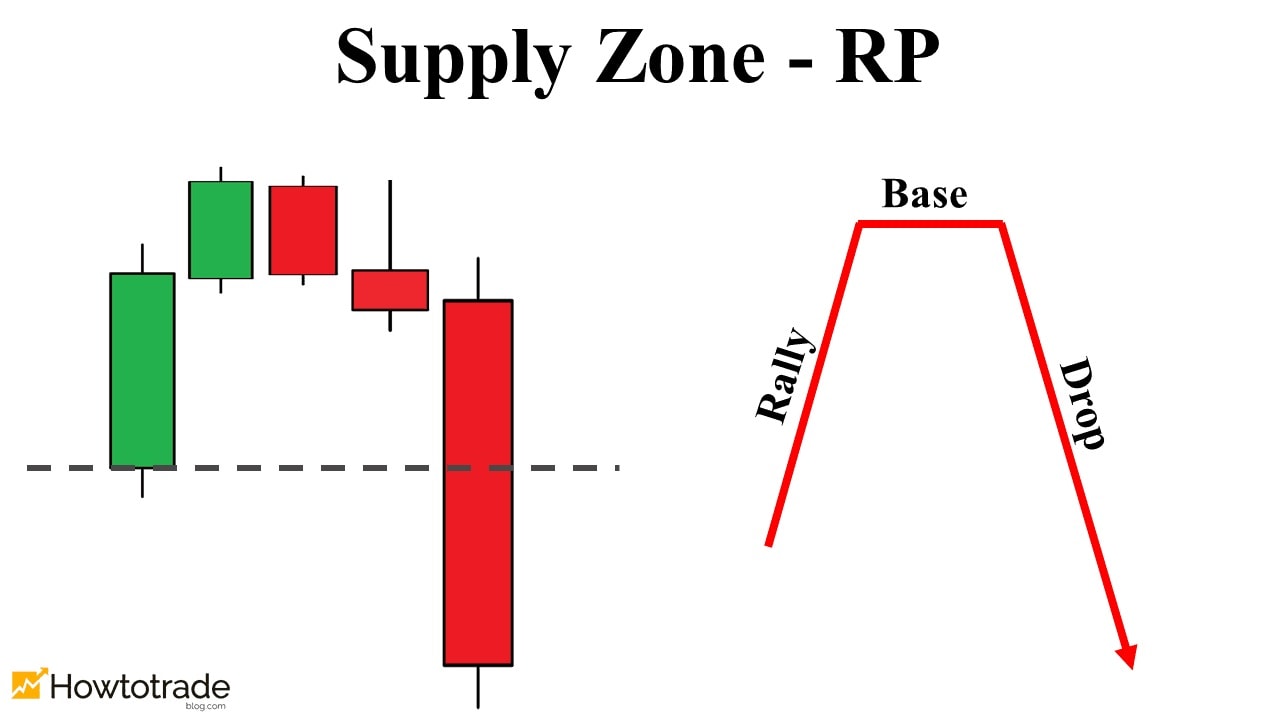 Reversal Supply pattern[/caption]
The price moves sideways after an uptrend and creates a sideways candlestick zone called the Base. Then it falls dramatically with a long body candlestick. This Base is the reversal Supply zone (RP).
For example:
[caption id="attachment_16530" align="aligncenter" width="1920"]
Reversal Supply pattern[/caption]
The price moves sideways after an uptrend and creates a sideways candlestick zone called the Base. Then it falls dramatically with a long body candlestick. This Base is the reversal Supply zone (RP).
For example:
[caption id="attachment_16530" align="aligncenter" width="1920"]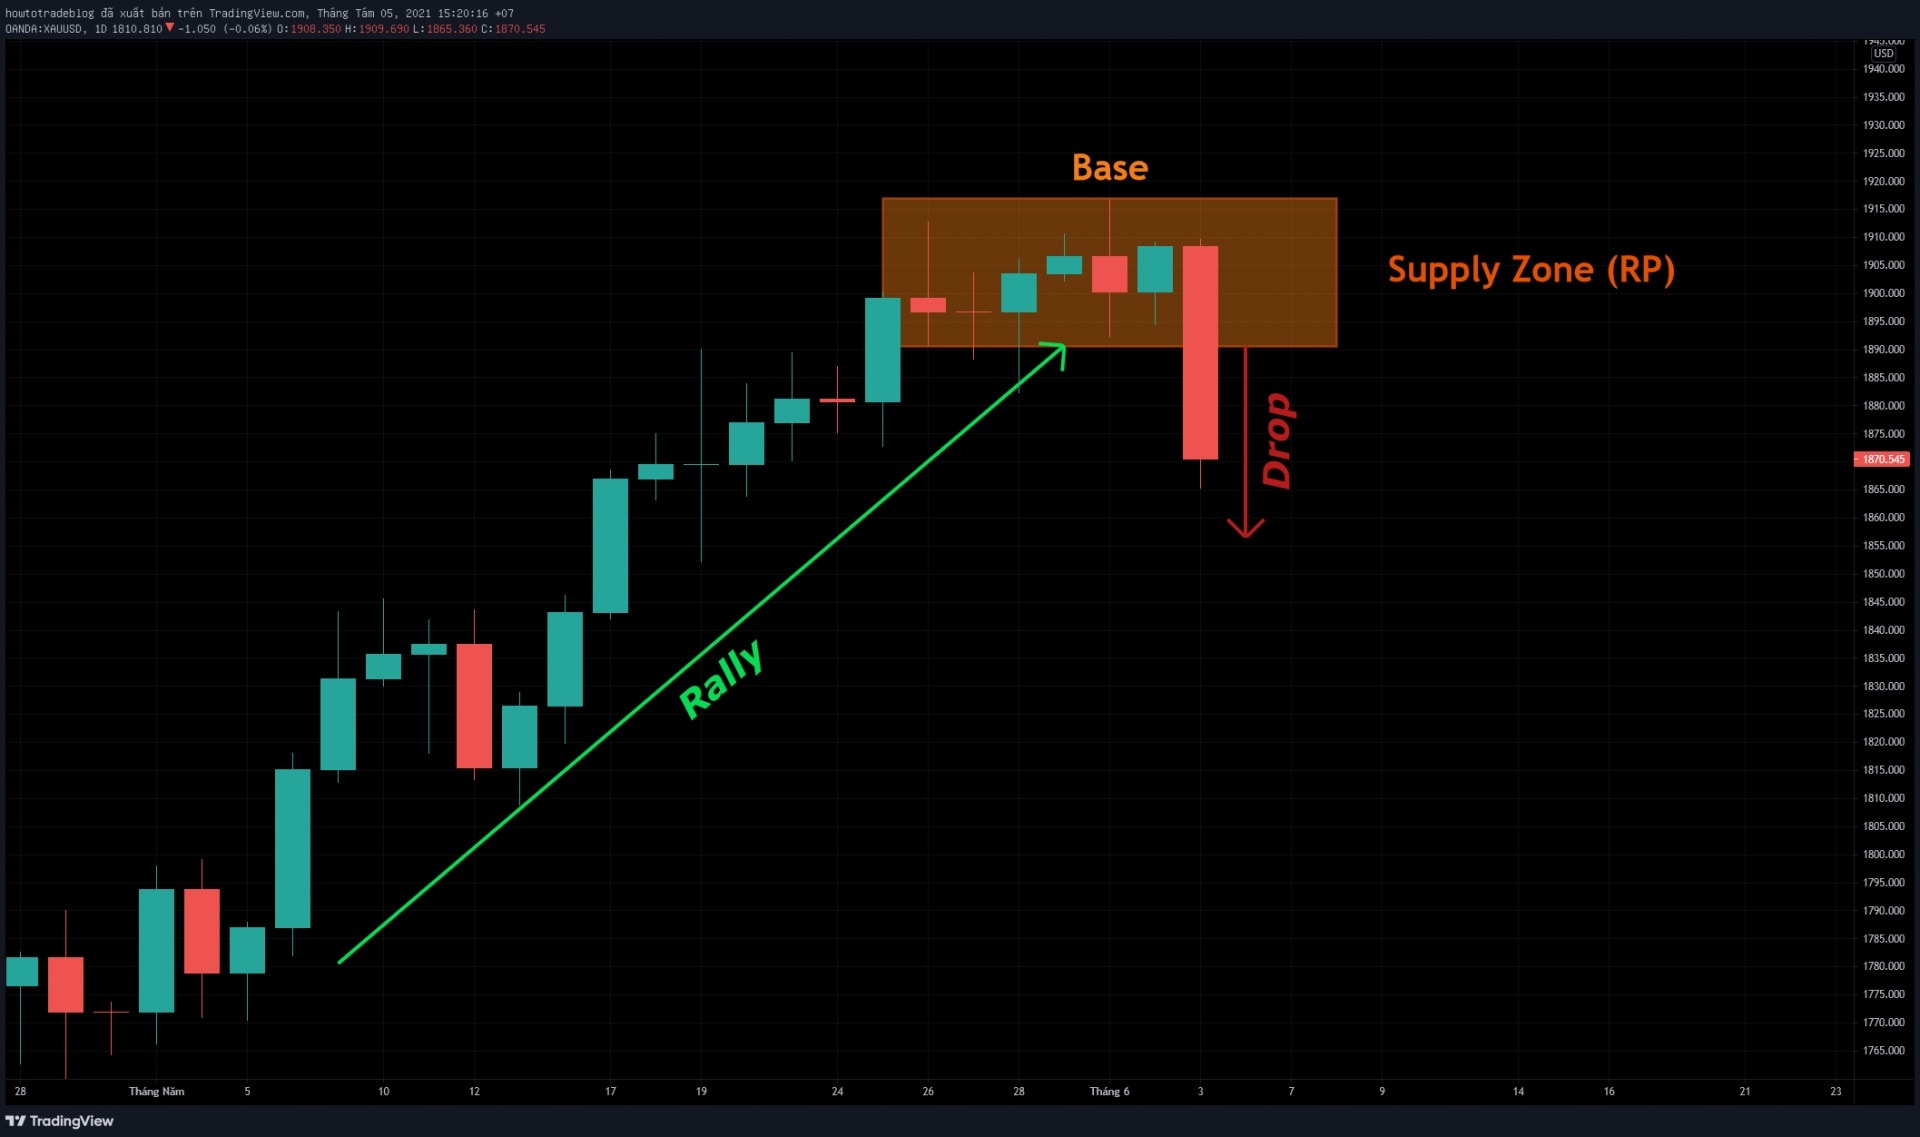 An example of the reversal Supply pattern[/caption]
The 6 candlesticks moving sideways in the image above are the Base. When the gold price falls sharply and creates a red candlestick with a long body, this Base becomes the reversal Supply zone.
(2) Continuation pattern (CP): Drop – Base – Drop
[caption id="attachment_16531" align="aligncenter" width="1280"]
An example of the reversal Supply pattern[/caption]
The 6 candlesticks moving sideways in the image above are the Base. When the gold price falls sharply and creates a red candlestick with a long body, this Base becomes the reversal Supply zone.
(2) Continuation pattern (CP): Drop – Base – Drop
[caption id="attachment_16531" align="aligncenter" width="1280"]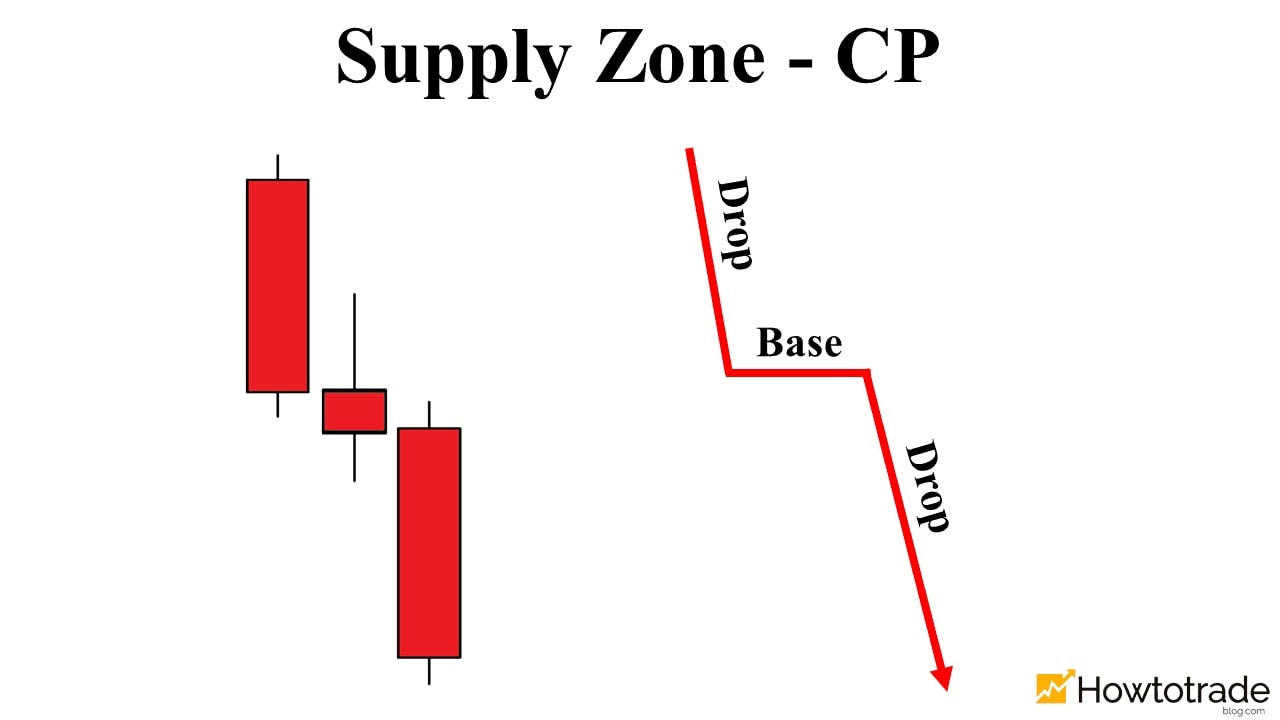 Continuation Supply zone[/caption]
The price stops decreasing and creates sideways candlesticks. Then it continues to fall significantly. The sideways zone (Base) in this process will be the Supply zone.
Detailed example:
[caption id="attachment_16532" align="aligncenter" width="1920"]
Continuation Supply zone[/caption]
The price stops decreasing and creates sideways candlesticks. Then it continues to fall significantly. The sideways zone (Base) in this process will be the Supply zone.
Detailed example:
[caption id="attachment_16532" align="aligncenter" width="1920"]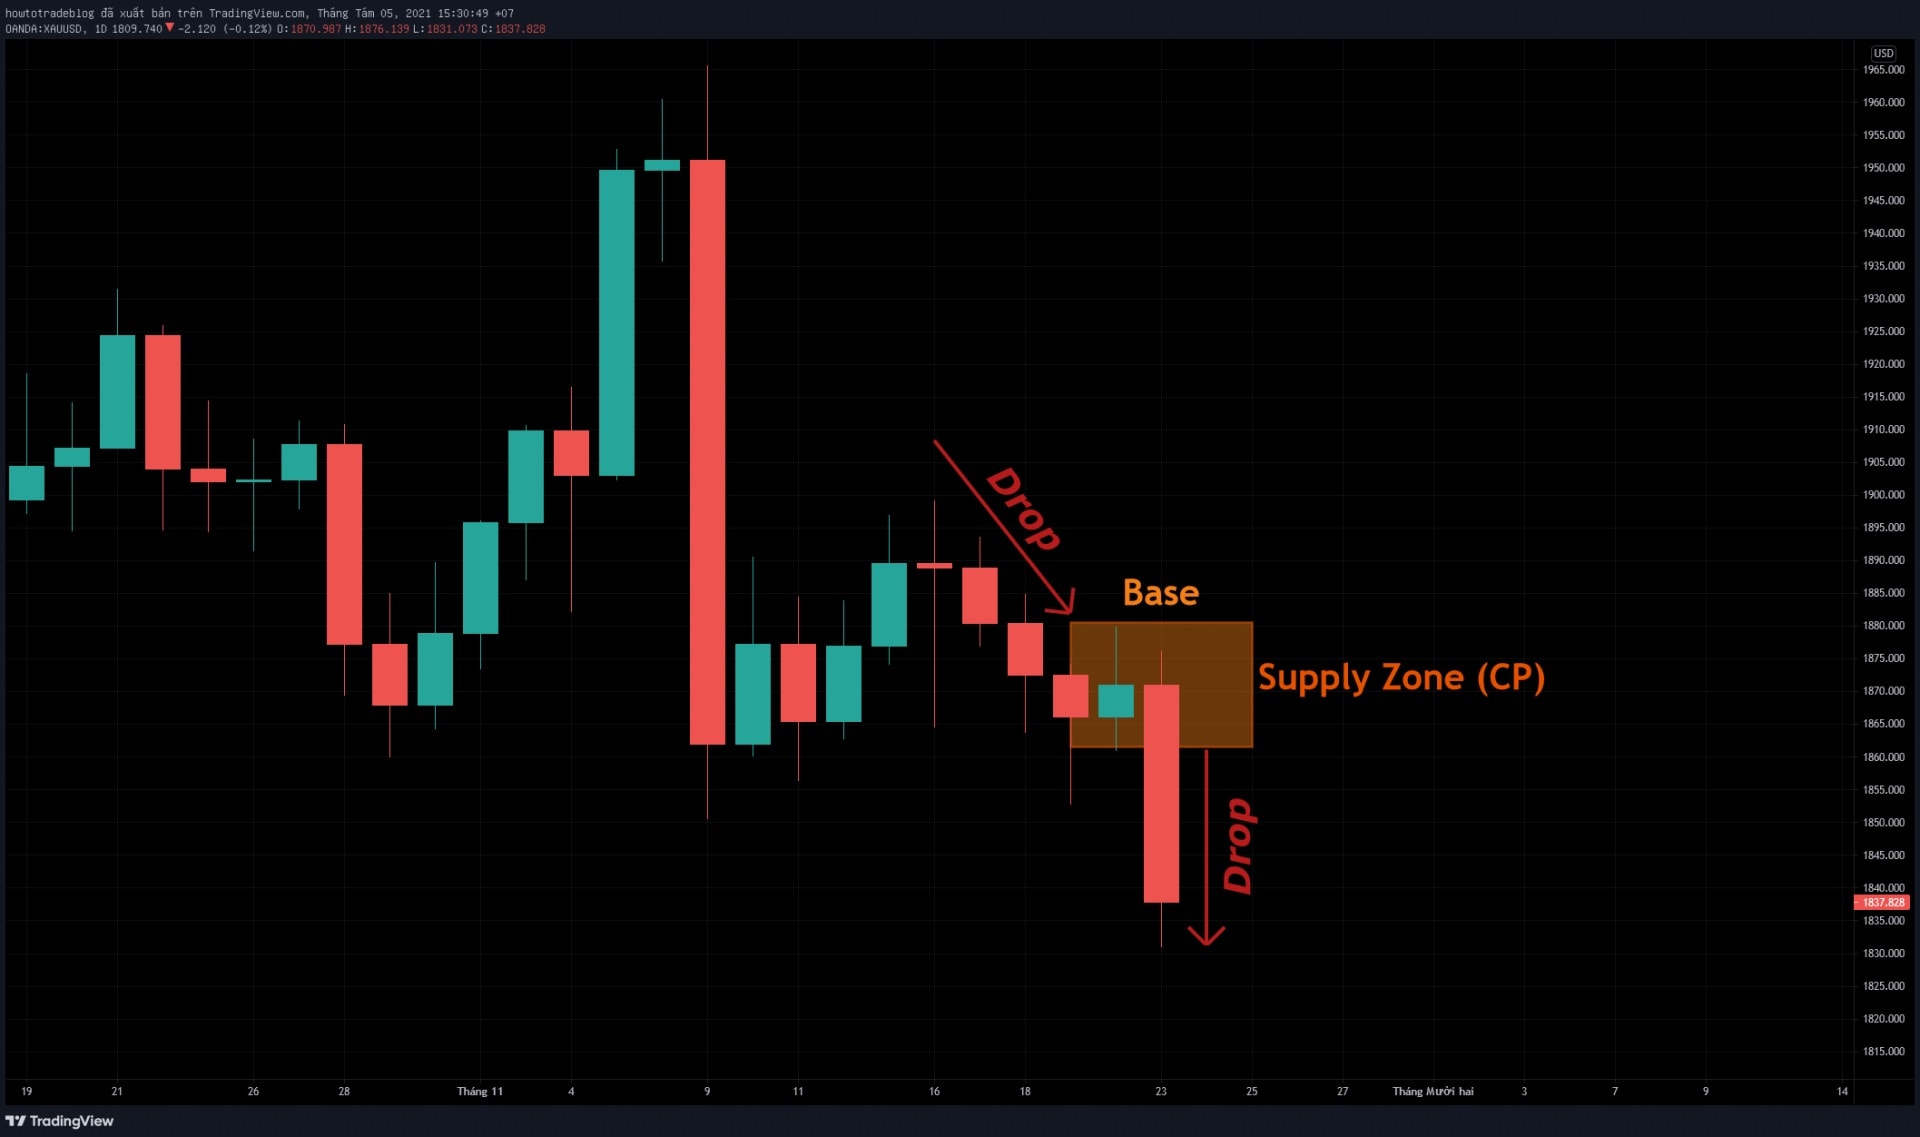 An example of the continuation Supply pattern[/caption]
 Reversal Demand pattern[/caption]
For example:
[caption id="attachment_16534" align="aligncenter" width="1920"]
Reversal Demand pattern[/caption]
For example:
[caption id="attachment_16534" align="aligncenter" width="1920"]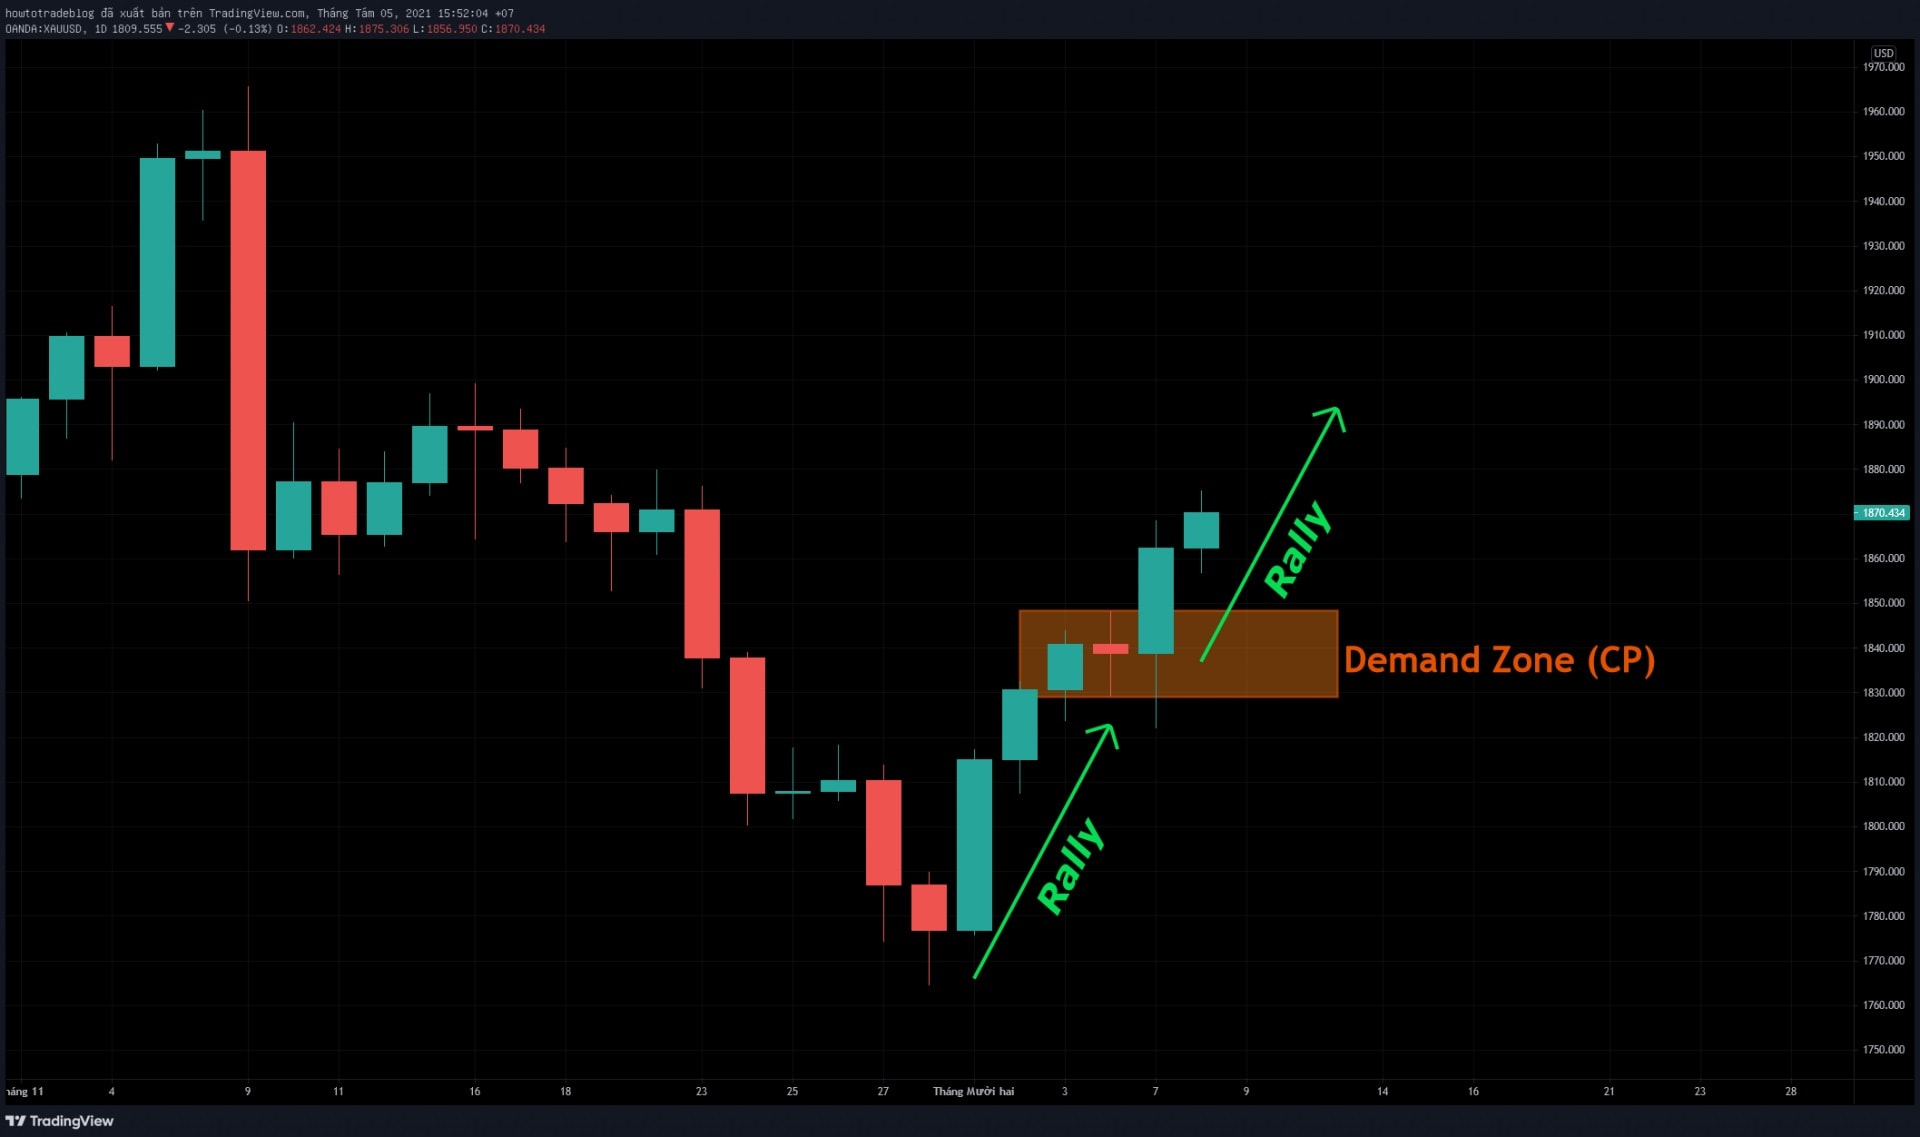 An example of the reversal Demand pattern[/caption]
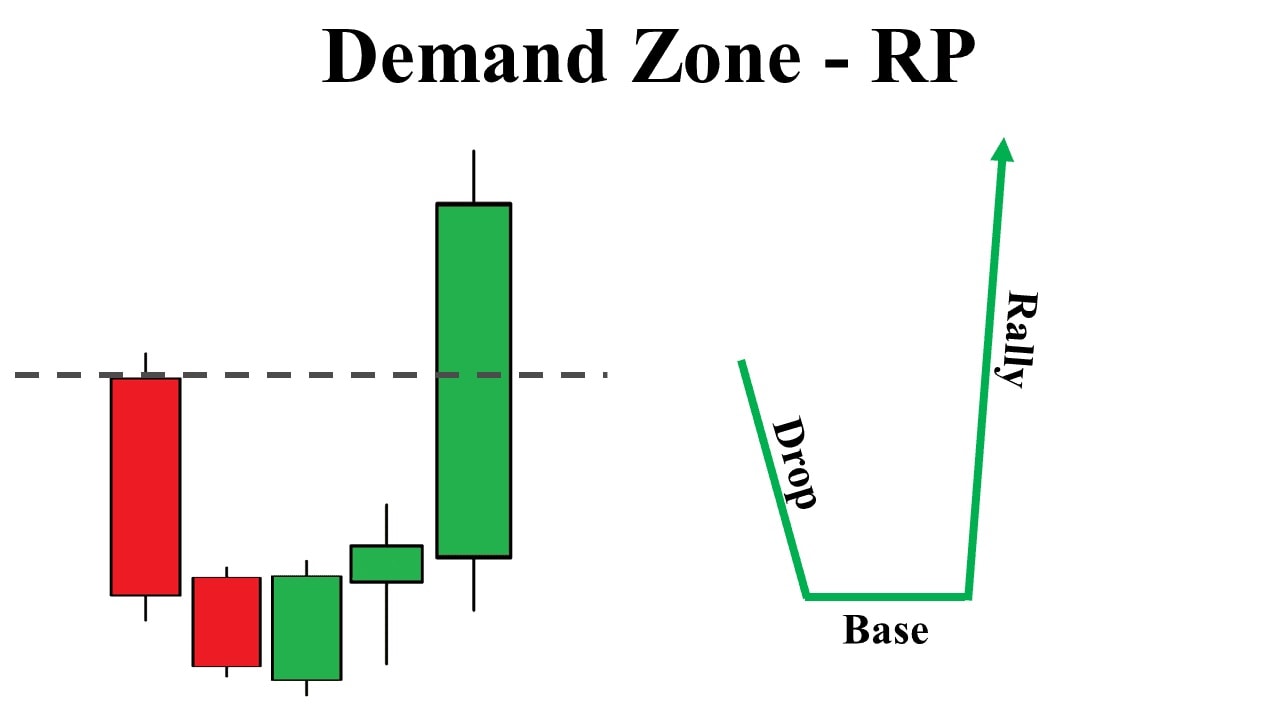
When the market bounces back, it creates a long green candlestick. Then the Base will be the Demand zone (RP).
(2) Continuation Demand pattern (CP): Rally - Base - Rally
[caption id="attachment_16535" align="aligncenter" width="1280"]
An example of the reversal Demand pattern[/caption]
When the market bounces back, it creates a long green candlestick. Then the Base will be the Demand zone (RP).
(2) Continuation Demand pattern (CP): Rally - Base - Rally
[caption id="attachment_16535" align="aligncenter" width="1280"]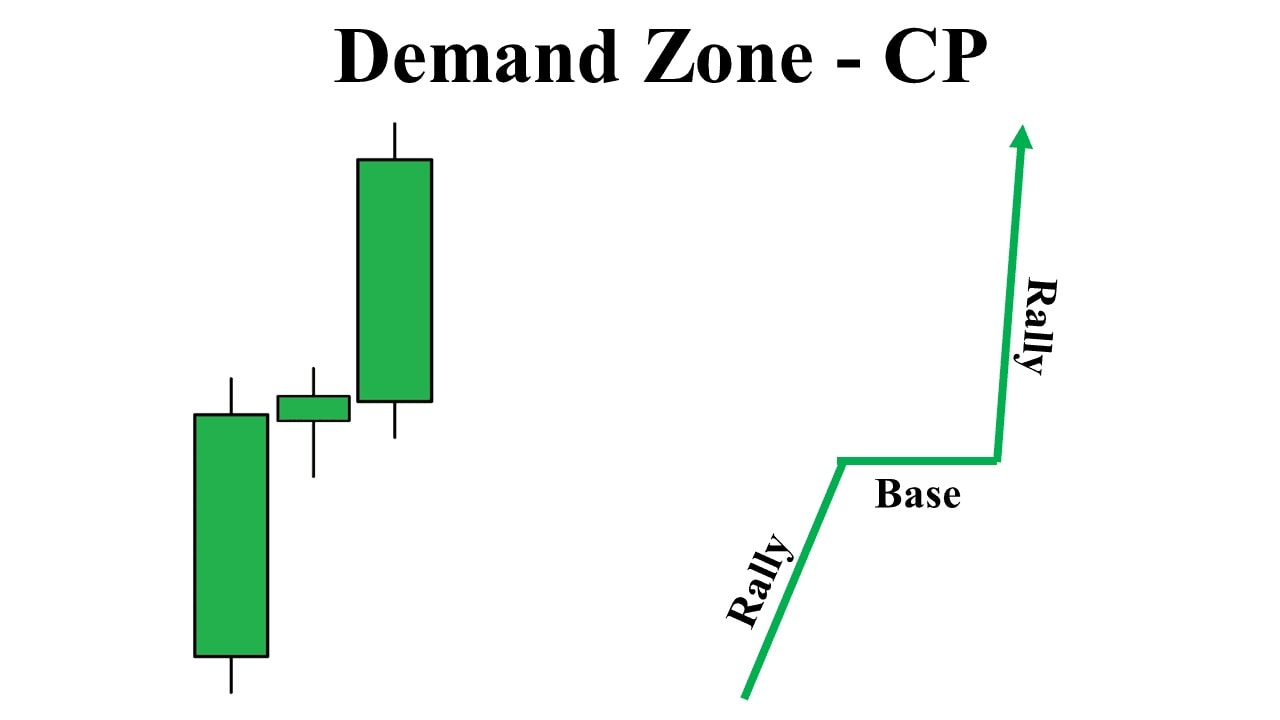 Continuation Demand pattern[/caption]
Detailed example:
[caption id="attachment_16536" align="aligncenter" width="1920"]
Continuation Demand pattern[/caption]
Detailed example:
[caption id="attachment_16536" align="aligncenter" width="1920"]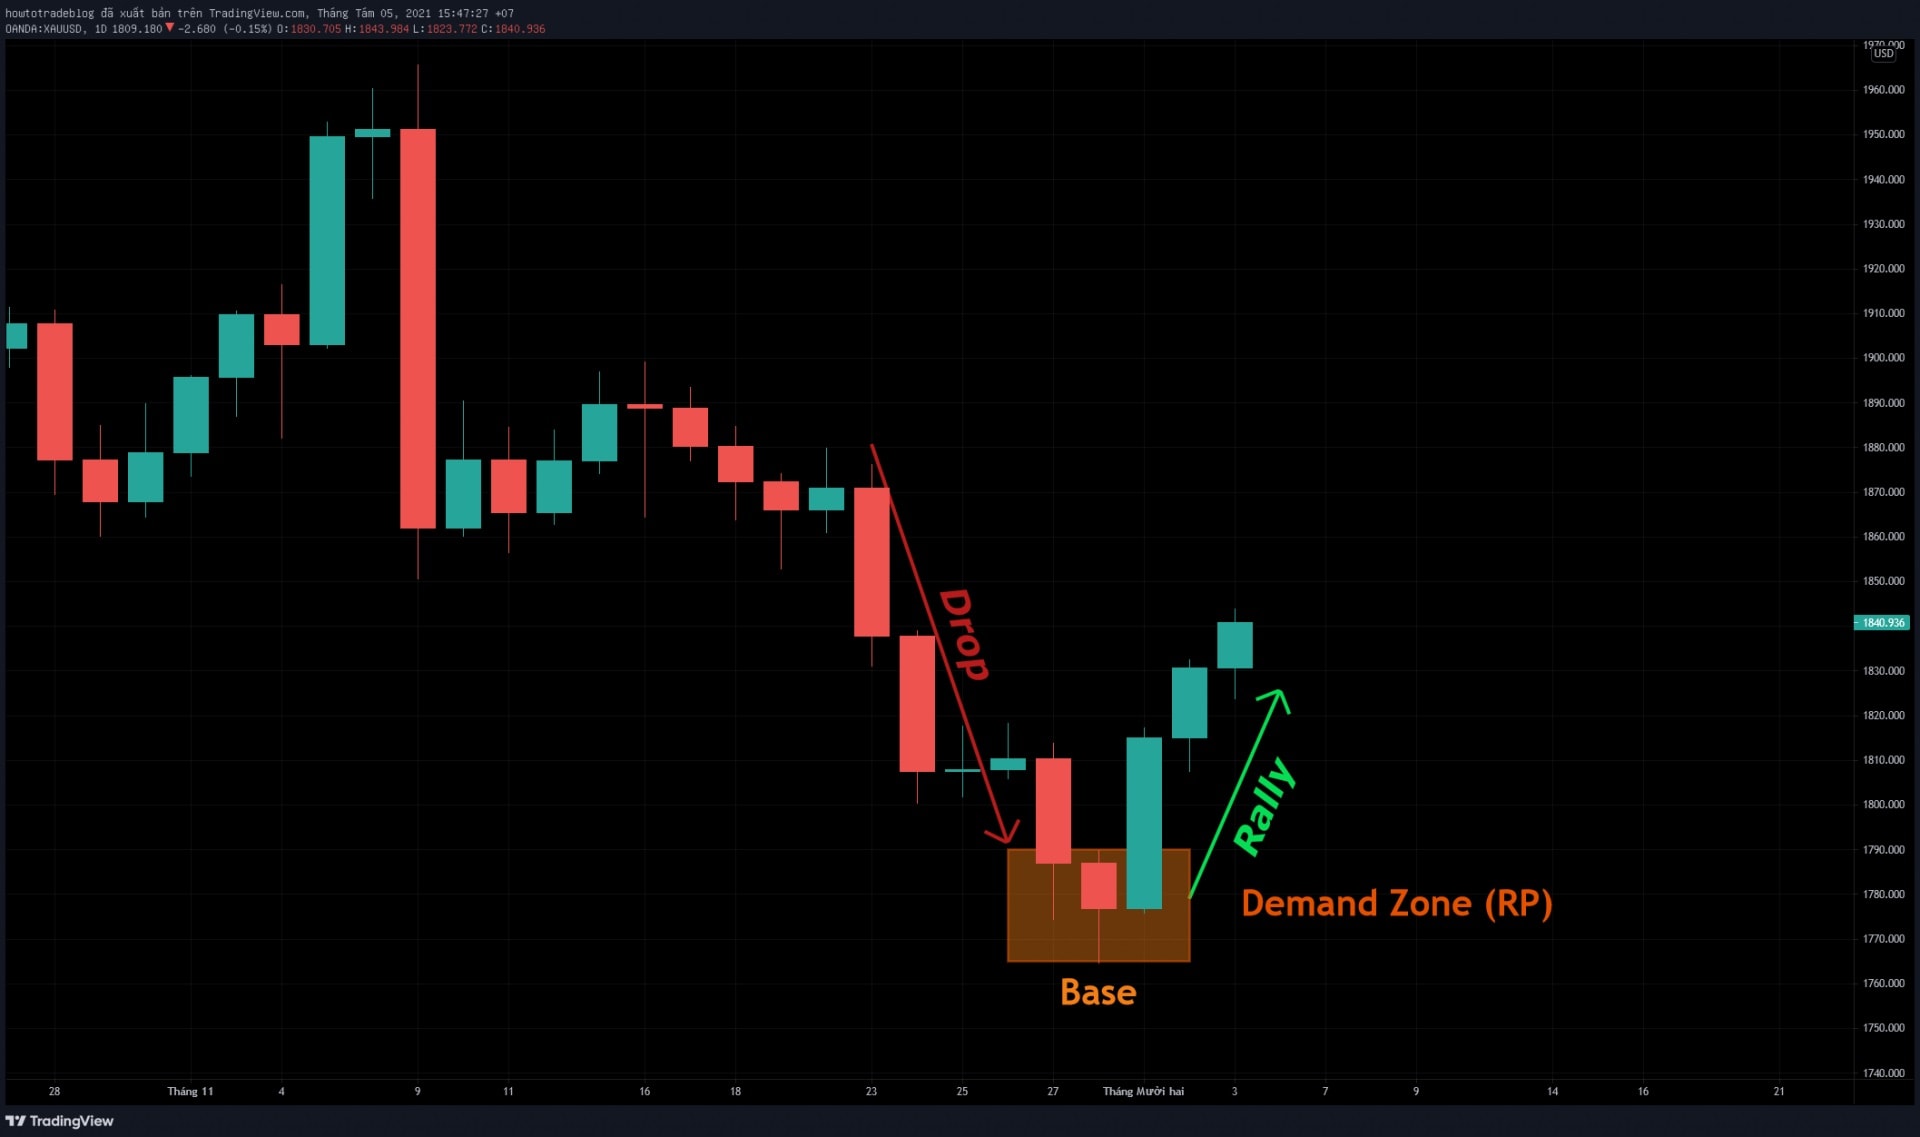 An example of the continuation Demand pattern[/caption]
 Trading with the Supply zone[/caption]
(2)
Trading with the Supply zone[/caption]
(2)  Trading result with the Supply zone[/caption]
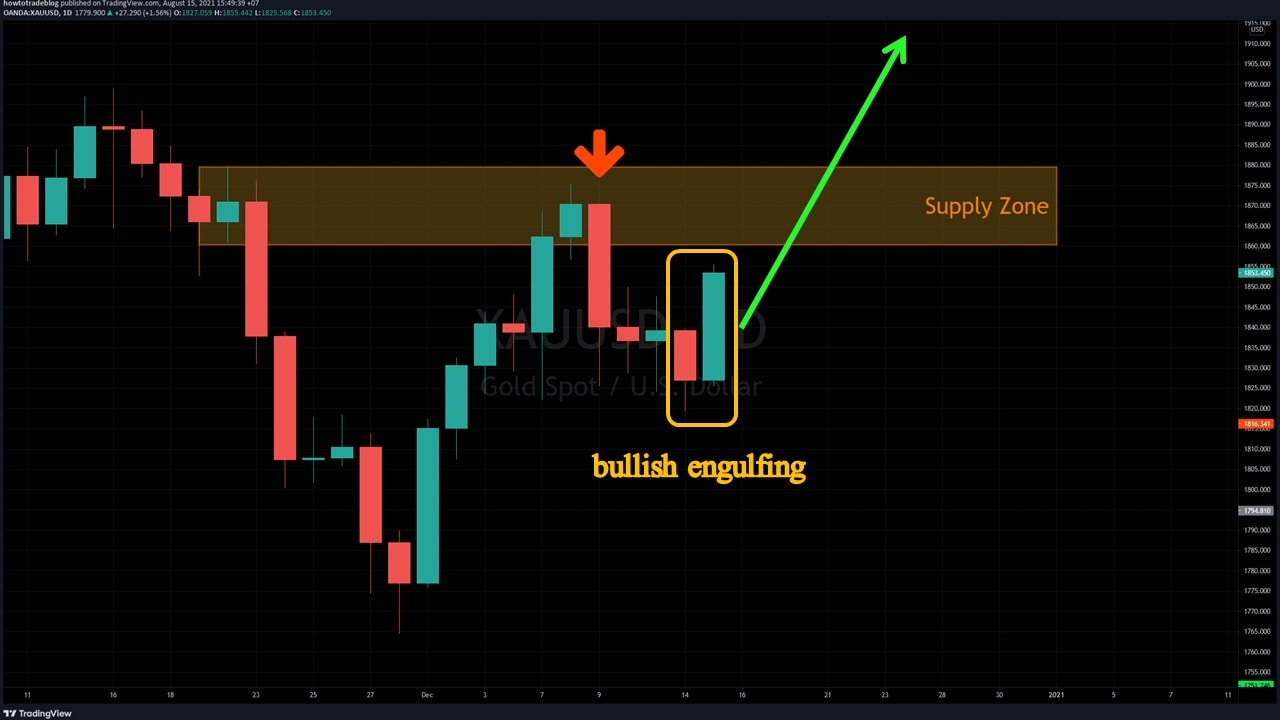
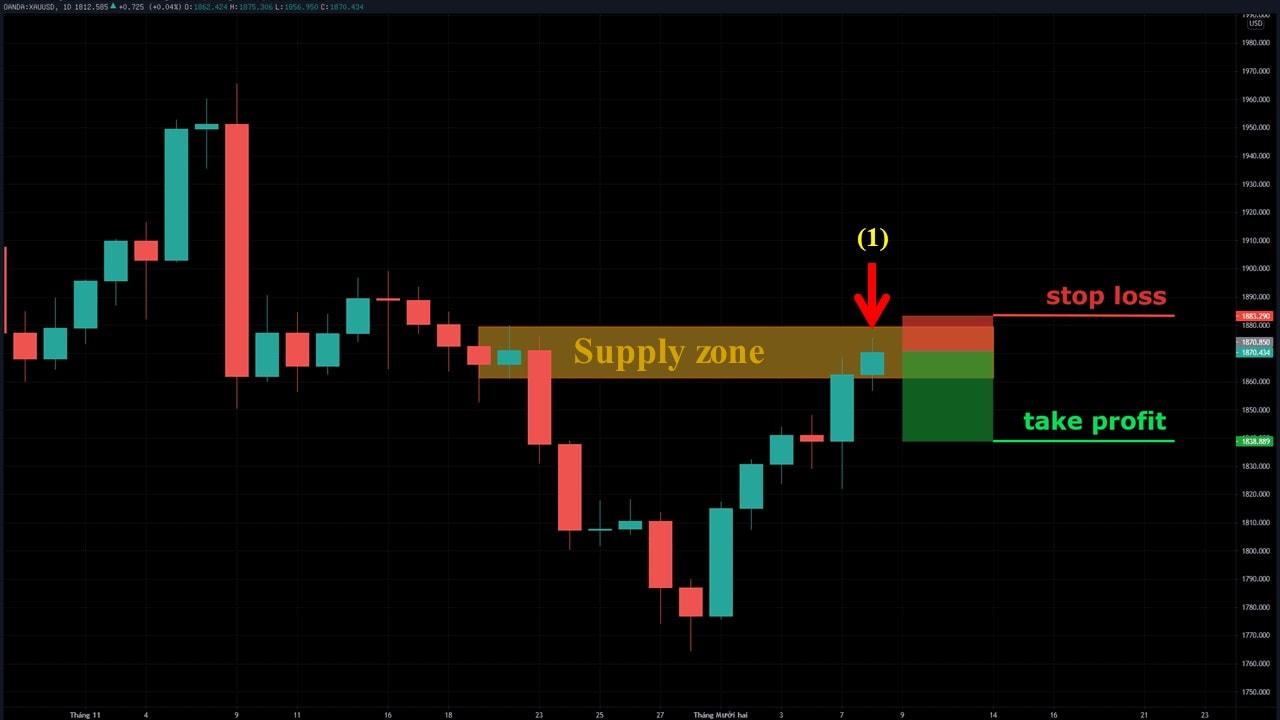
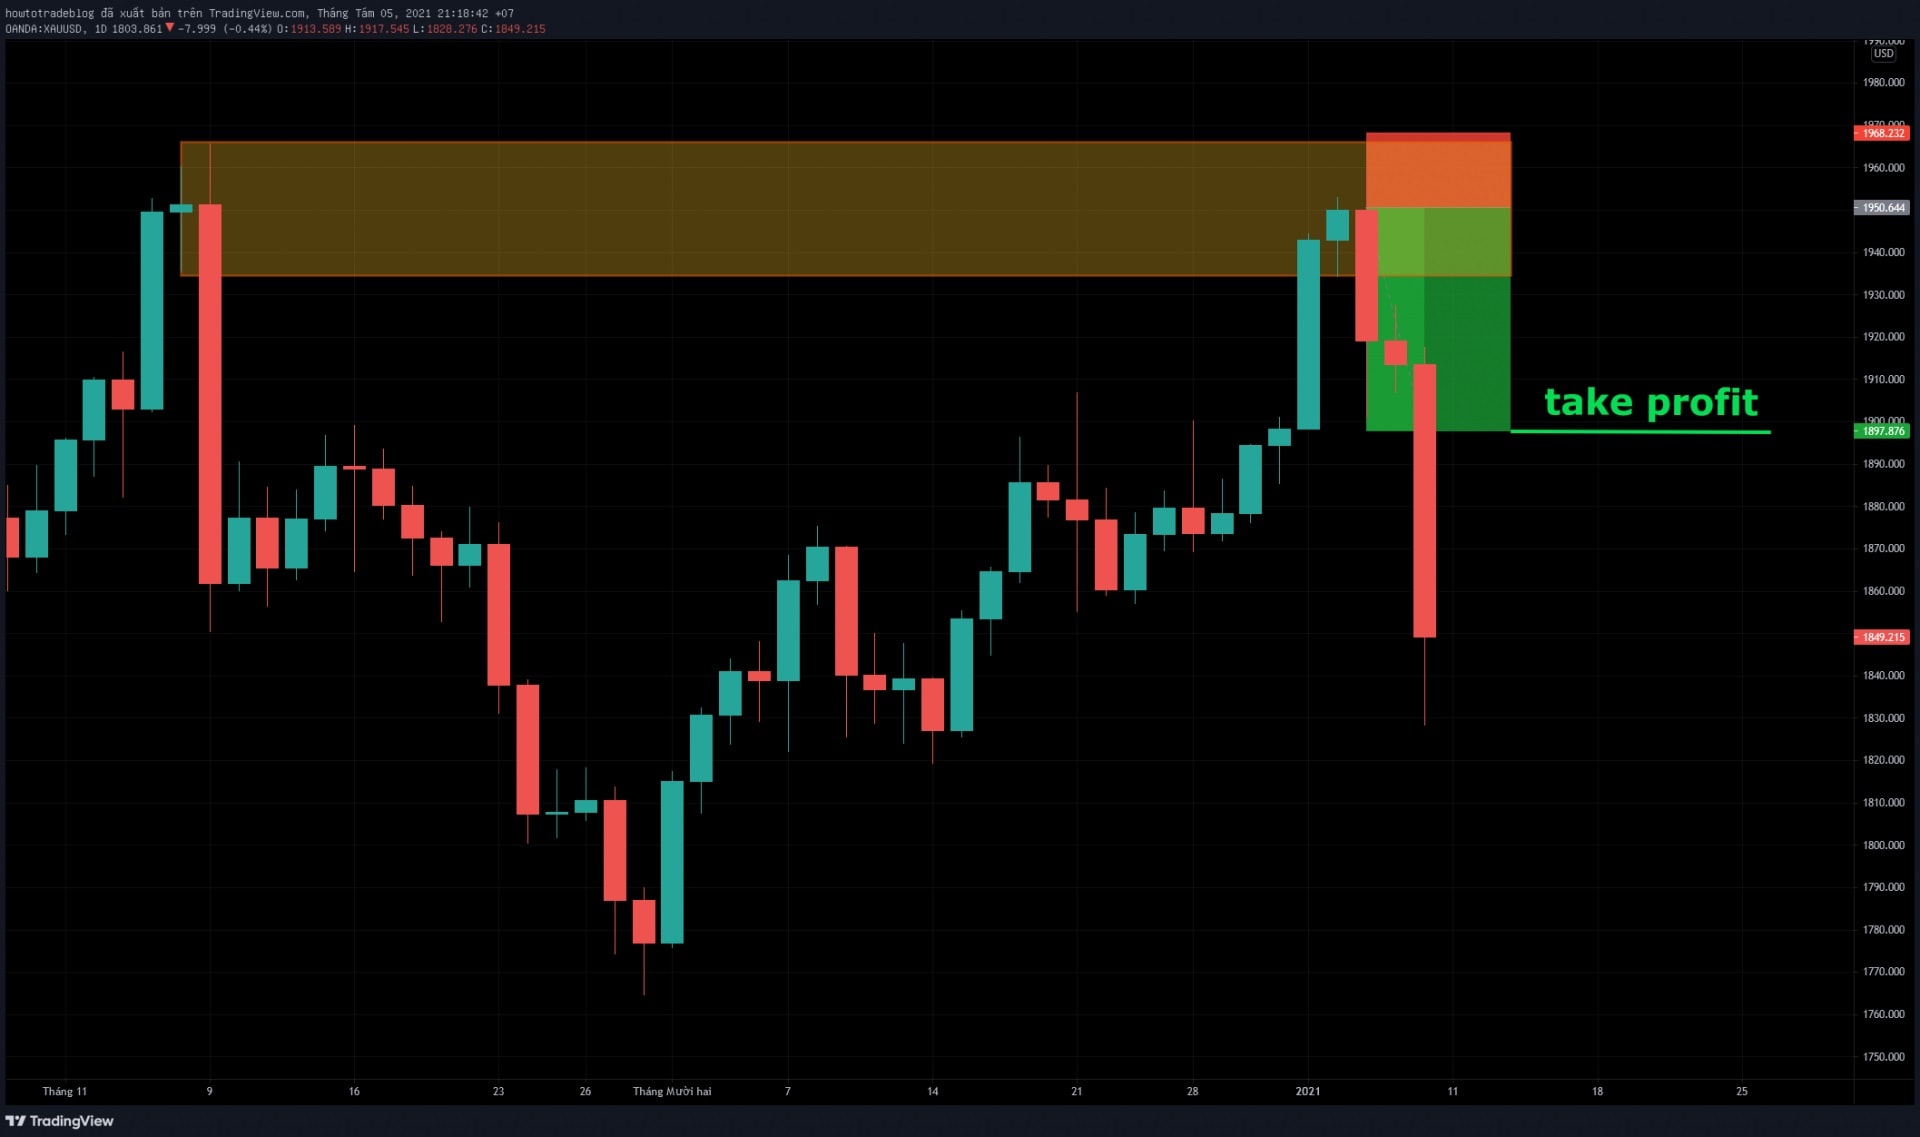
I have another example about the gold price.
(1) The price increases and enters the Supply zone. Then it begins to show a slow increase signal with a small green candlestick.
[caption id="attachment_16539" align="aligncenter" width="1280"]
Trading result with the Supply zone[/caption]
I have another example about the gold price.
(1) The price increases and enters the Supply zone. Then it begins to show a slow increase signal with a small green candlestick.
[caption id="attachment_16539" align="aligncenter" width="1280"]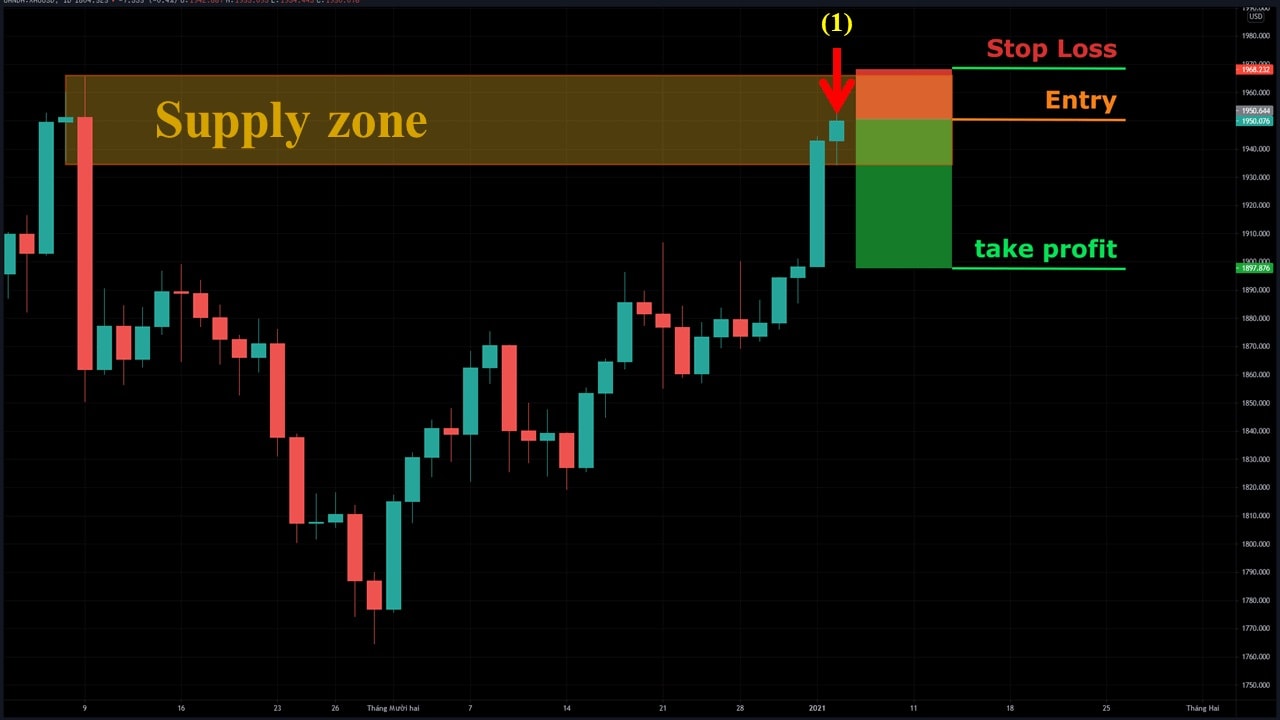 Sell Gold at the Supply zone[/caption]
(2)
Sell Gold at the Supply zone[/caption]
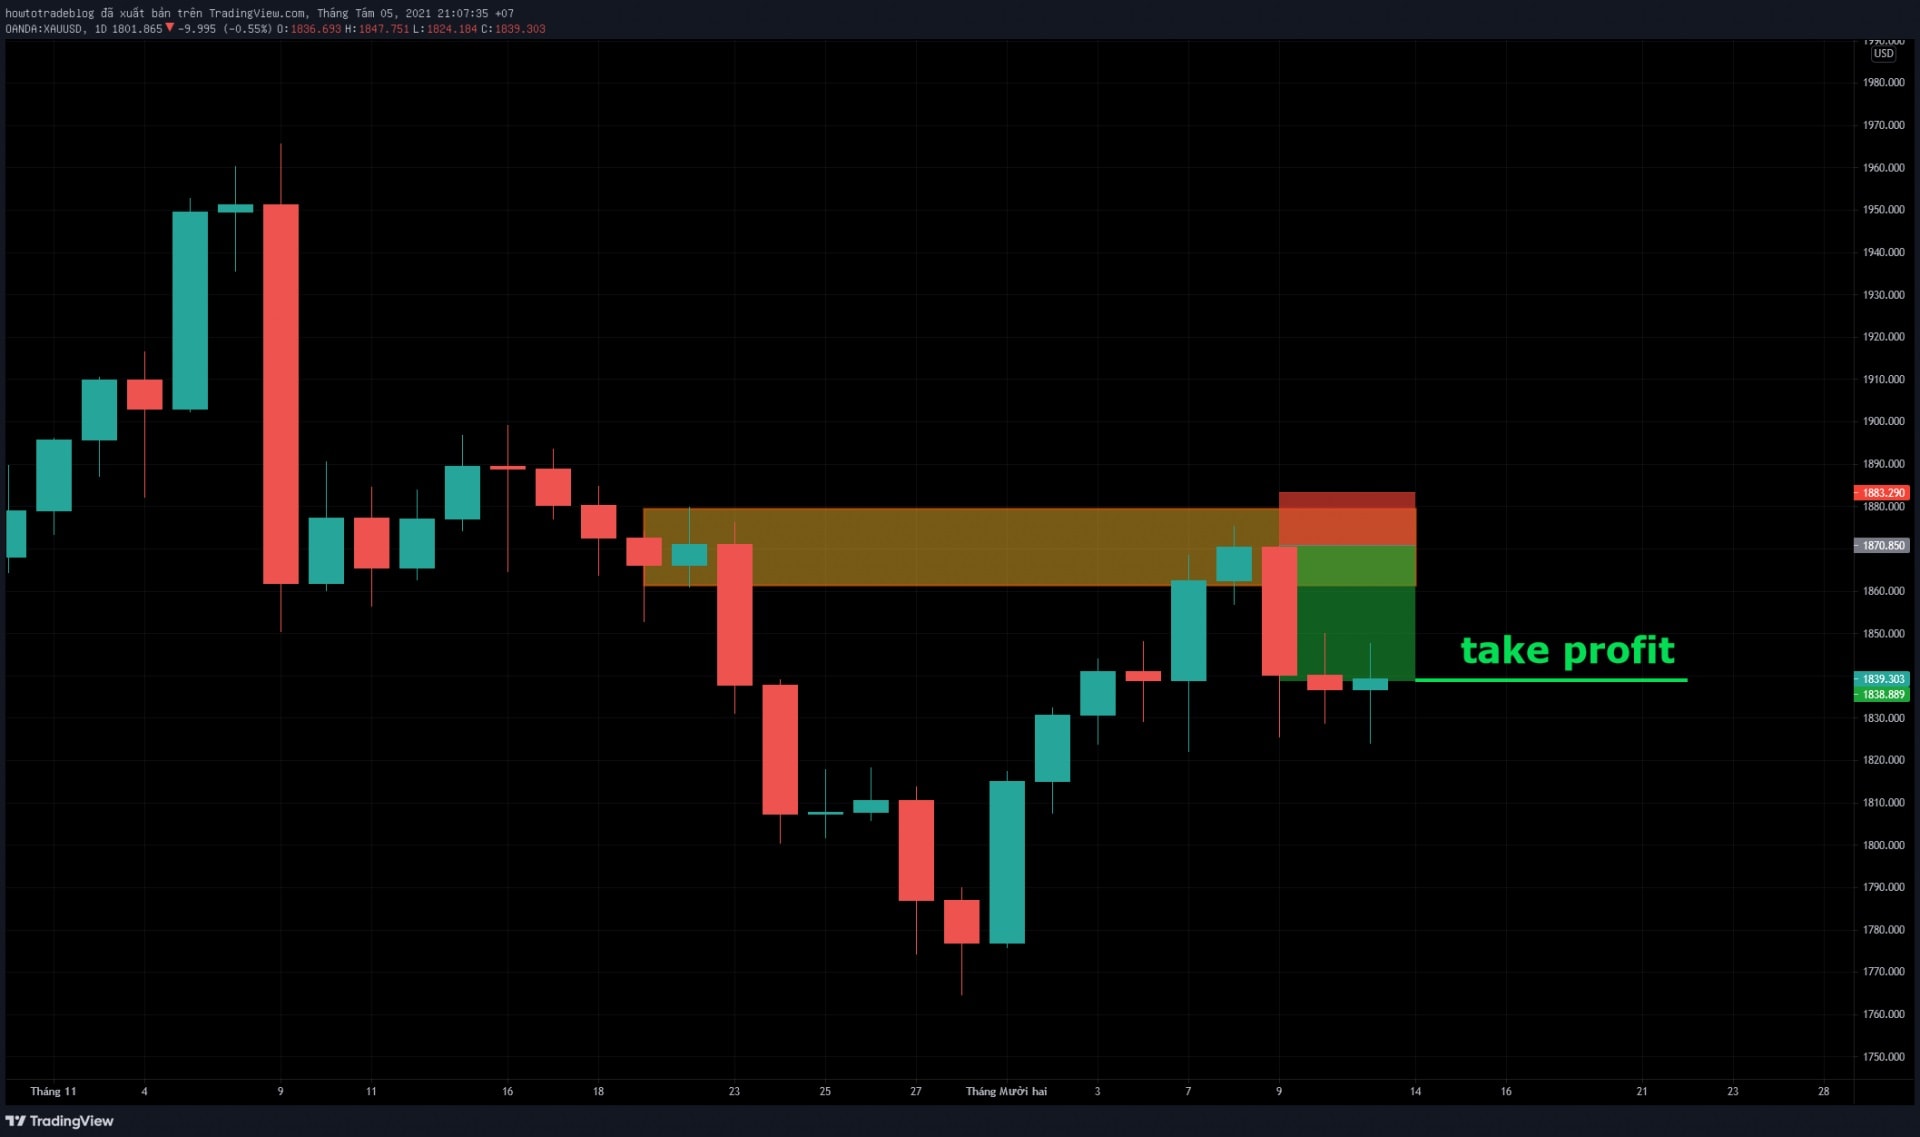
(2)  Trading result with the Sell order[/caption]
 How to trade with the Demand zone[/caption]
 Result of the BUY order[/caption]
It is already quite long so I'll save the real trading experiences for the next article. We’ll also learn the reason why you should use a daily chart and when the Supply and Demand zones are no longer make sense.
Result of the BUY order[/caption]
It is already quite long so I'll save the real trading experiences for the next article. We’ll also learn the reason why you should use a daily chart and when the Supply and Demand zones are no longer make sense.