The trend is a favorite dish of professional traders. As long as the market has a clear trend, they will probably make money. In the previous article, I mentioned everything about an uptrend. And now, I’ll introduce you to the downtrend and how to open safe Forex orders with a downtrend.
Register an Exness account NowGet $1,000 Free for beginners
What is a downtrend in Forex? What are its common features?
A downtrend is the bearish trend of the market. The price keeps falling for a long time. It creates lower troughs after troughs and lower peaks after peaks.
In technical analysis, a downtrend is also known as the Bear market.

Common features of a downtrend
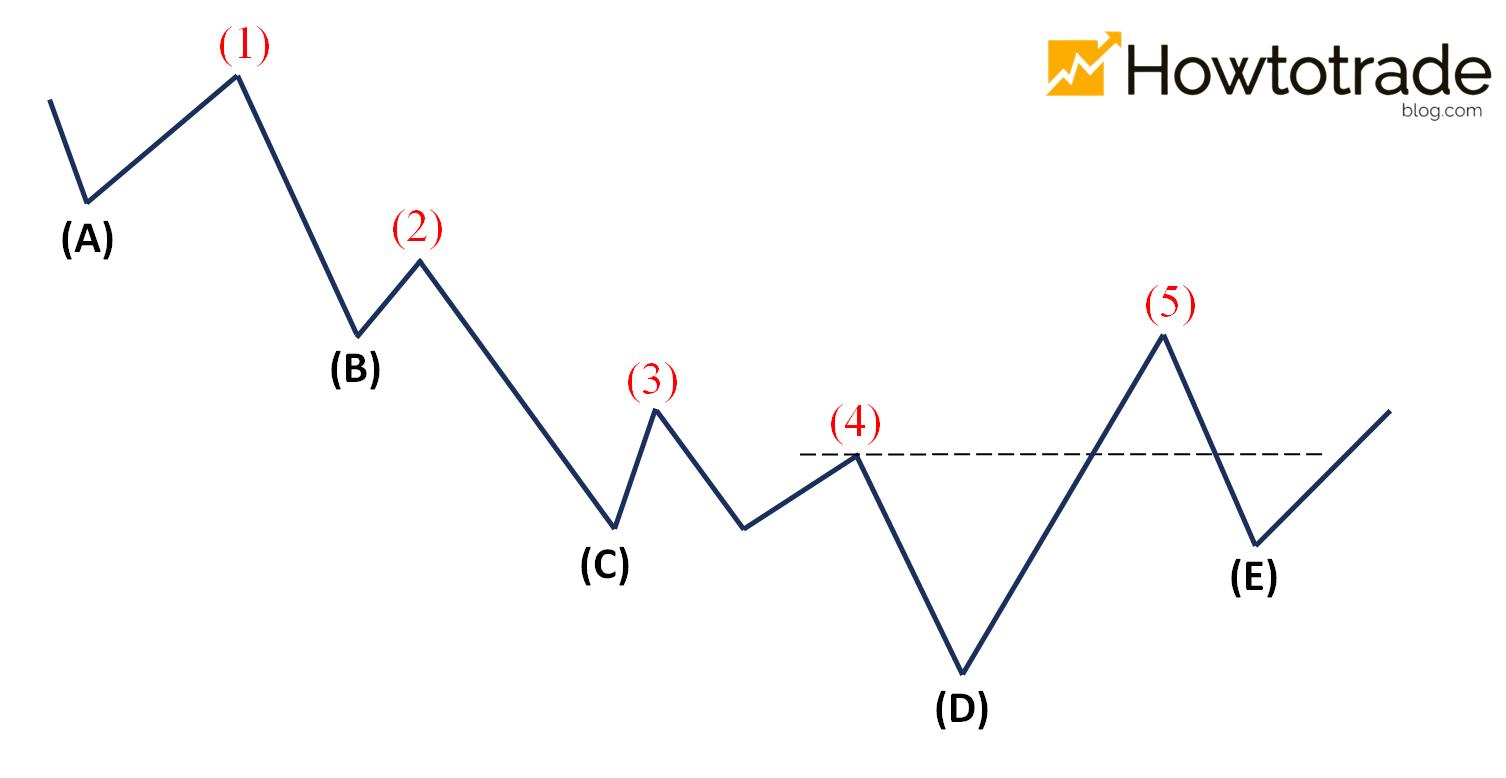
+ The following trough is lower than the previous trough. Trough (B) is lower than trough (A) and trough (C) is lower than trough (B). Just like that, the following troughs will be lower than the previous ones.
+ The following peak is lower than the previous peak: Peak (2) is lower than peak (1) and peak (3) is lower than peak (2). The market continuously creates lower peaks after peaks.
When both signals appear, you can be sure the market has entered a downtrend.

Common patterns of a downtrend
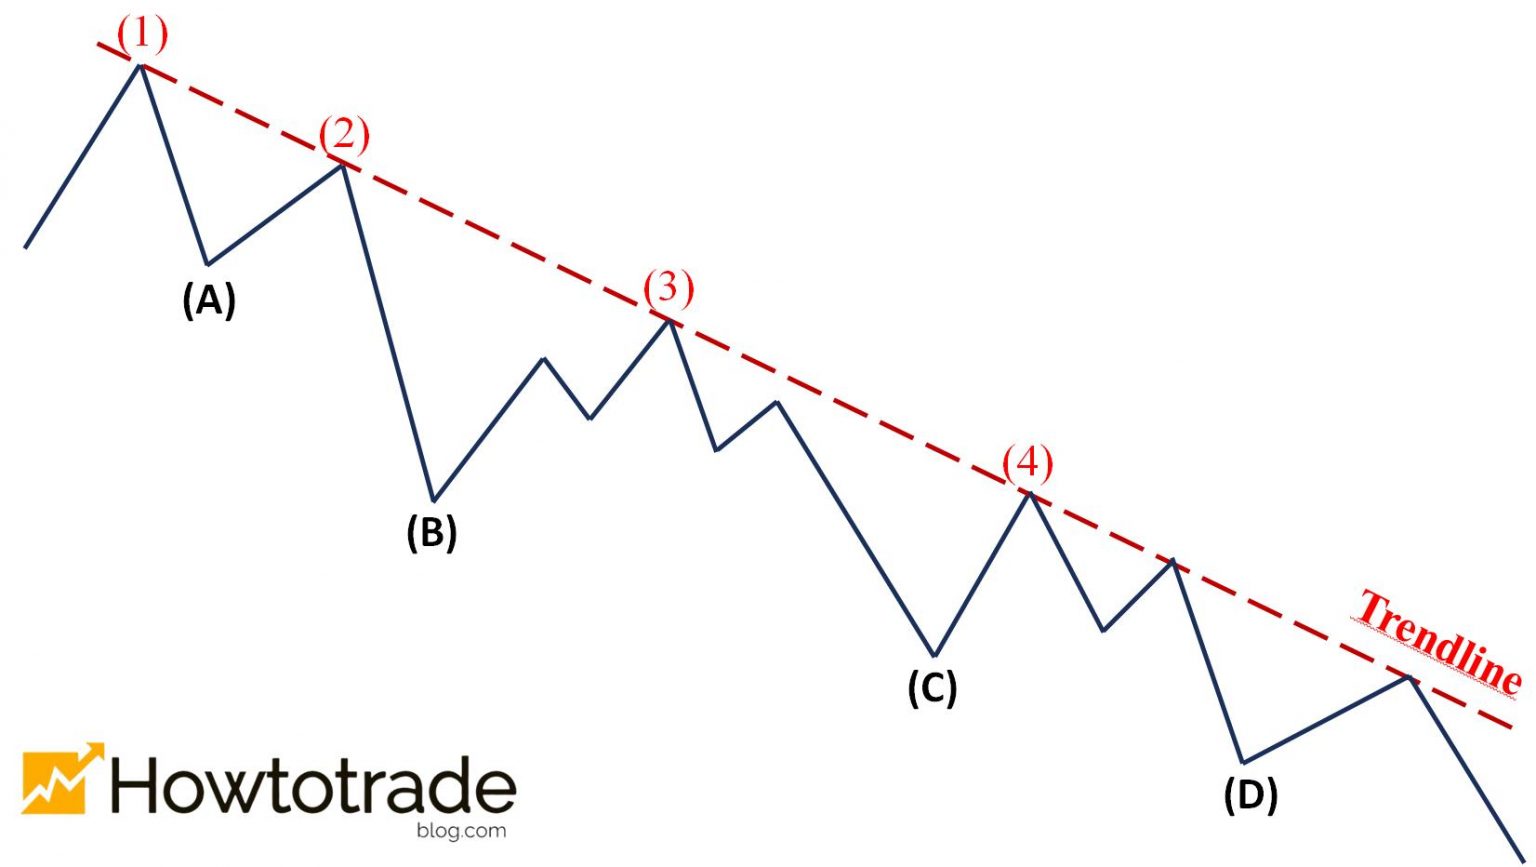
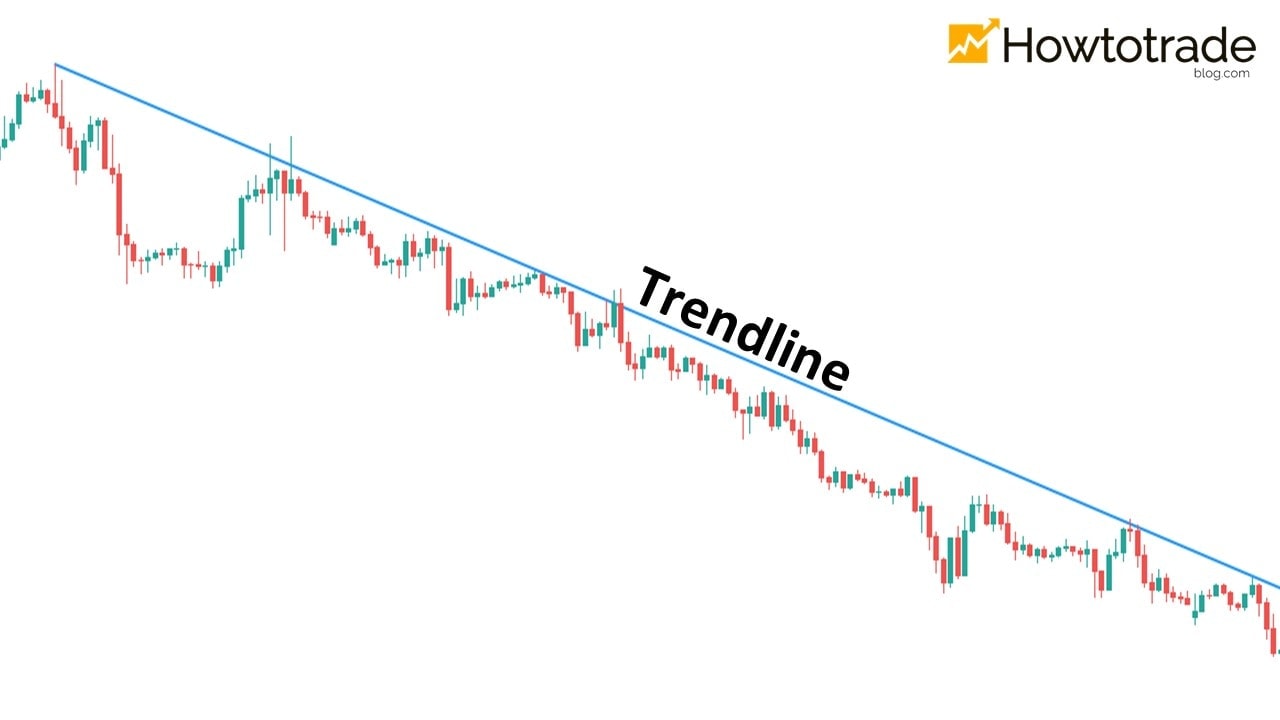
Pattern 1: A downtrend in which you can draw a trendline
This is the most classic downtrend pattern and the most perfect one in technical analysis.
What is a trendline? In a downtrend, the bearish trendline will connect the peaks together. It acts as a resistance level for the market in a downtrend.
You just need to draw a straight line downwards connecting the 3 peaks together. So you will have a Trendline in a downtrend. And when the price touches the trendline, it will fall back.
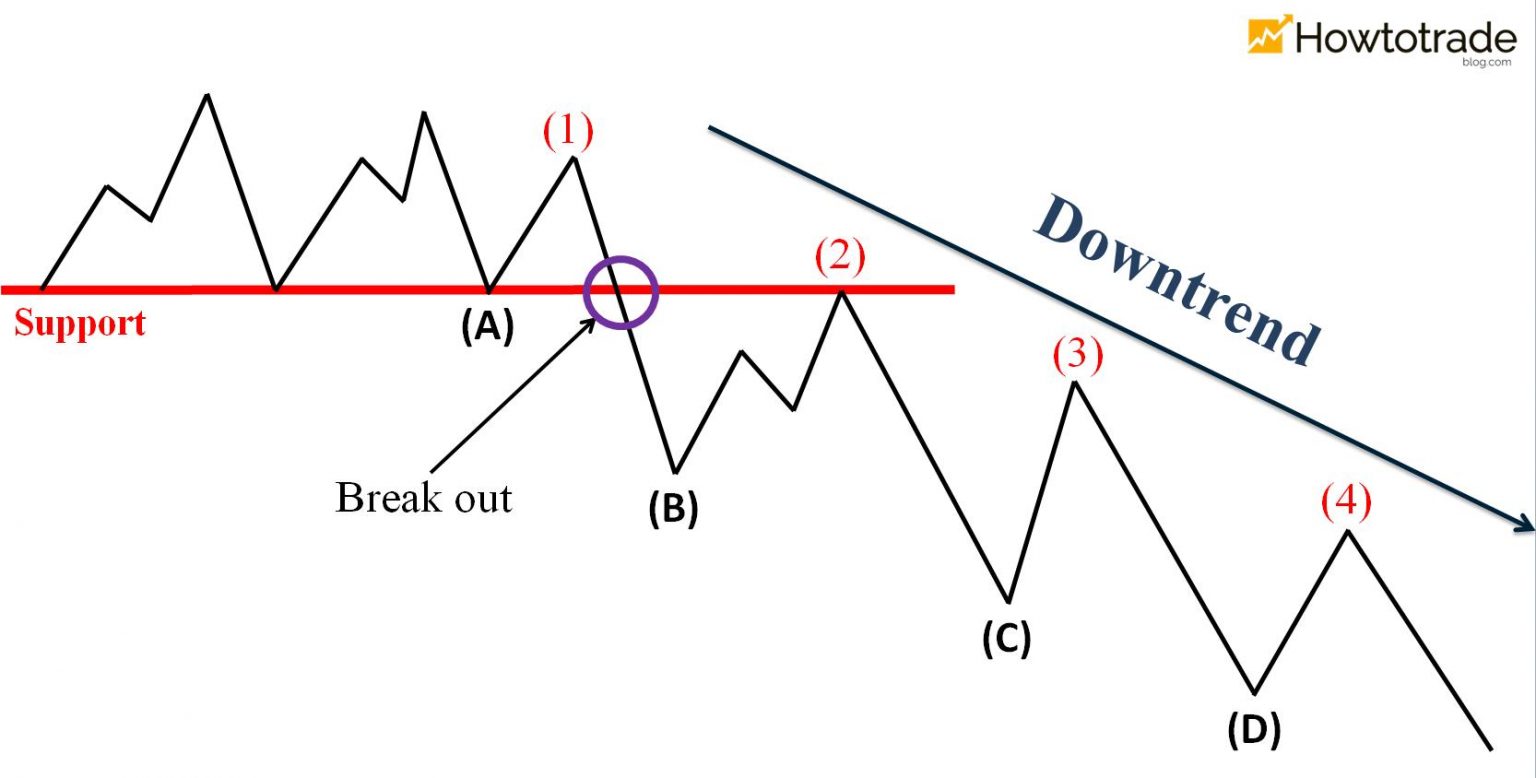
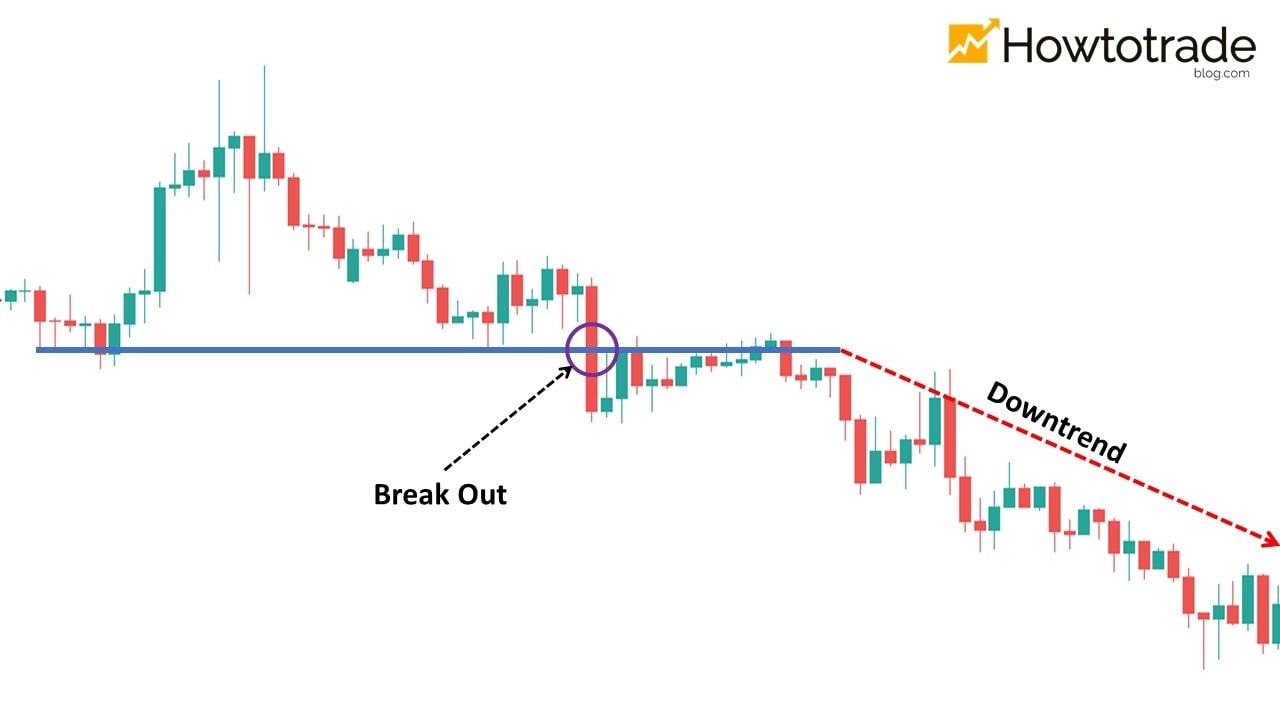
Pattern 2: The price breaks out of the support, drops, and enters a downtrend
This is a recognizable downtrend pattern that is very popular in the market. The price breaks out of the support and goes down. After that, it retests that broken support level (which becomes a resistance level after the breakout).
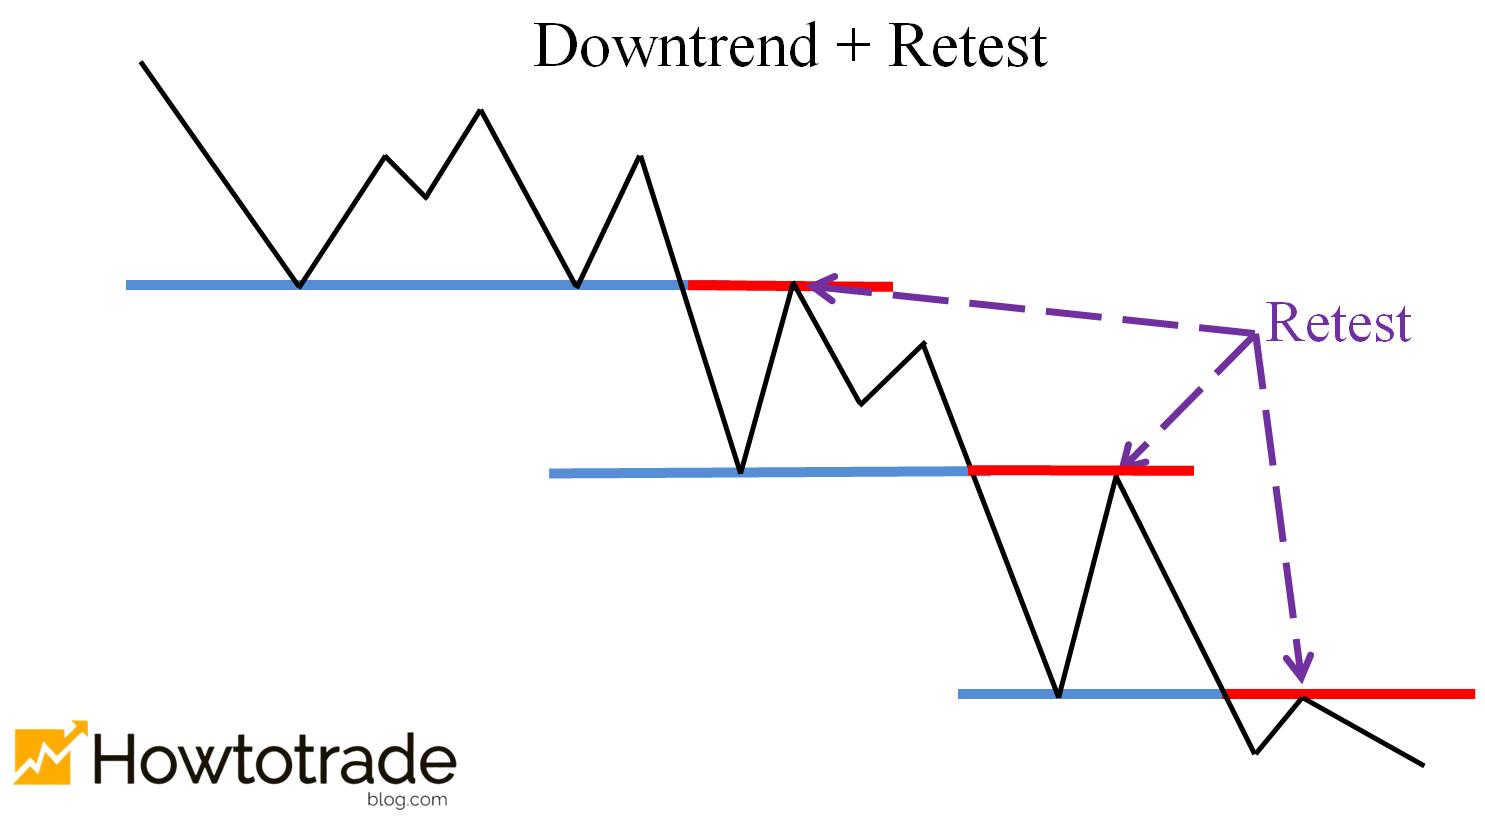
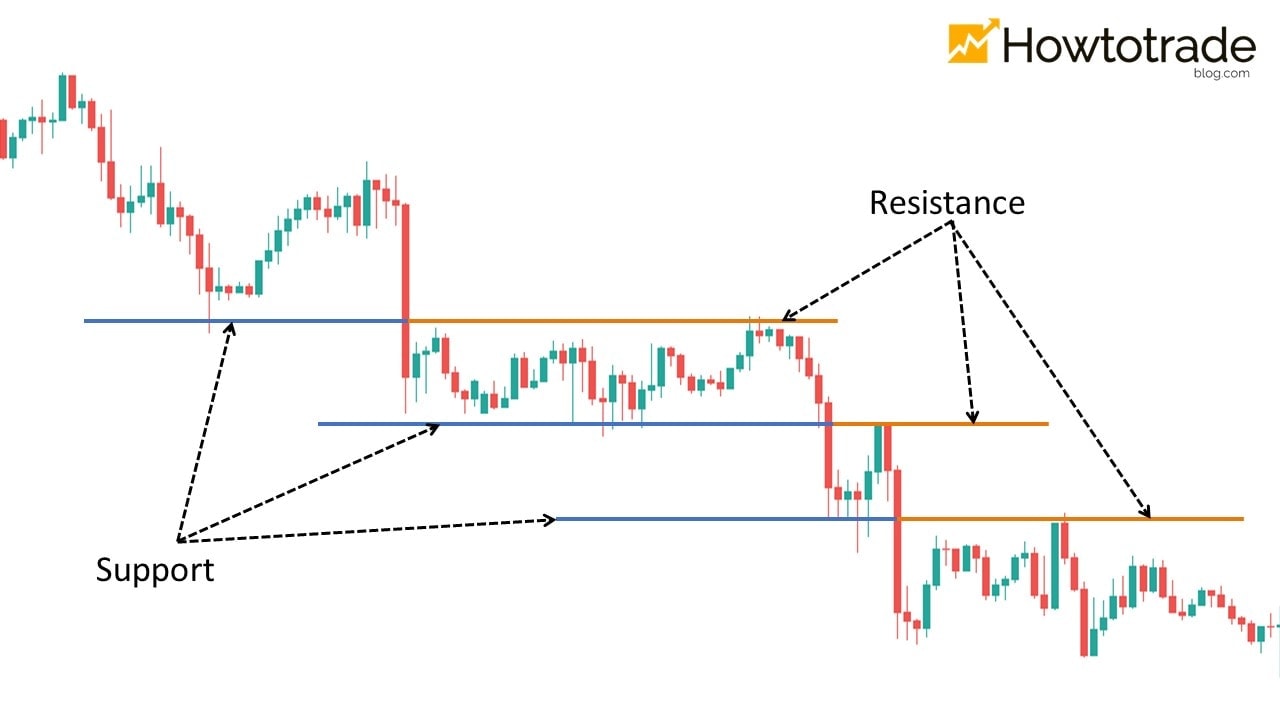
Pattern 3: Downtrend and Retest
This is also one of the very common patterns when the market forms a downtrend. The price will keep falling, creating lower troughs after troughs. And each time the price falls out of a trough, it will retest the trough just crossed. It will then continue to fall. This process repeats itself many times.
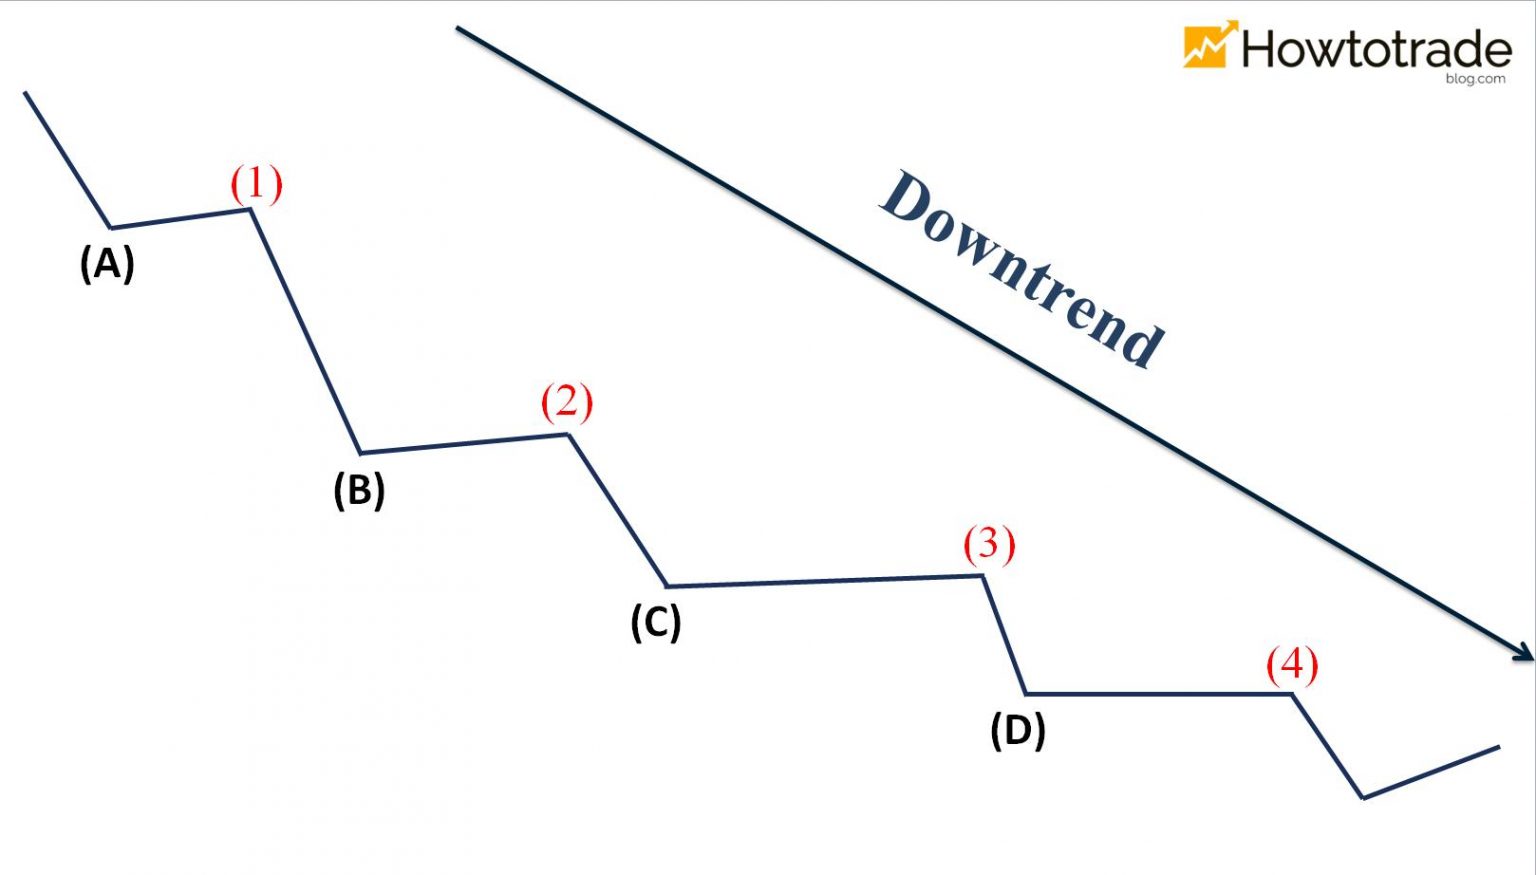
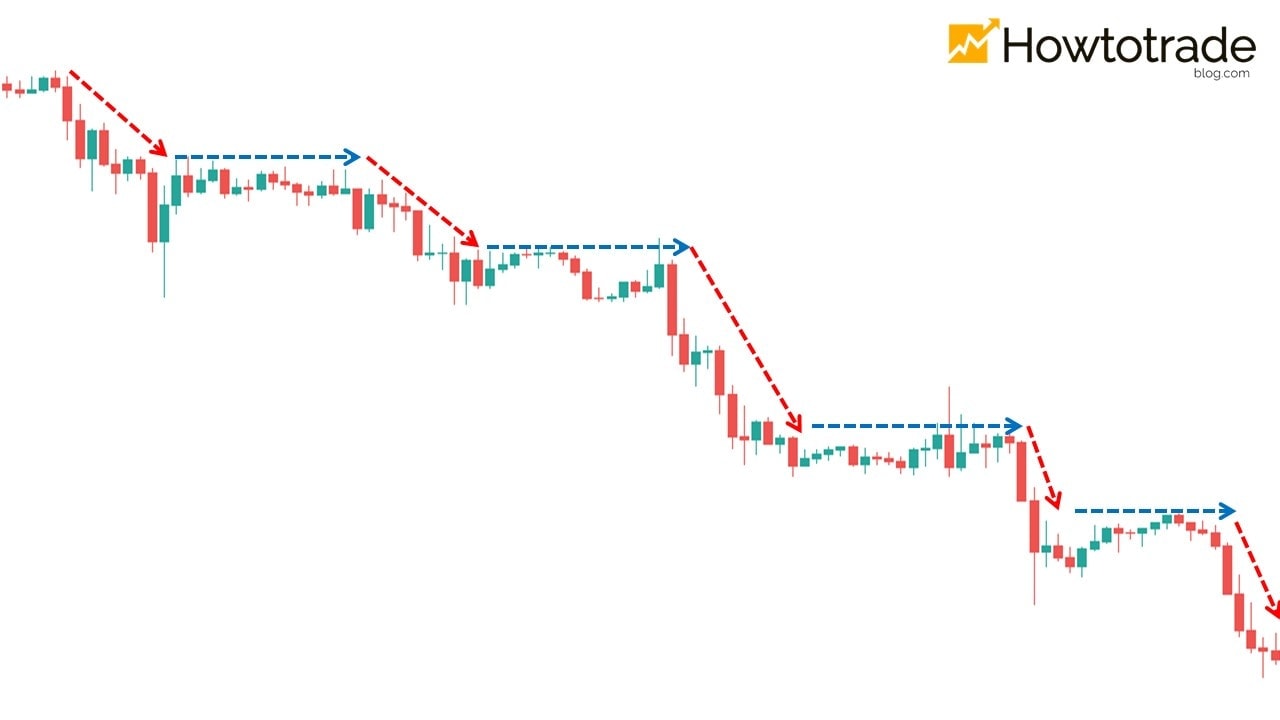
Pattern 4: The ladder downtrend pattern
The price goes down, then sideways, and then goes down again. In general, you will realize that this is a downtrend. But you will not know how and when to open an order safely.
Practical examples of patterns in a downtrend
- Draw a Trendline in a downtrend.
- The price breaks out of the support and goes down.
- Downtrend and retest.
- The ladder downtrend pattern.
When is a downtrend over?
Answers: It is when the principles of a downtrend are broken. The previous peak and trough are no longer lower than the previous ones => The downtrend has ended.
When a downtrend ends, the market will likely fall into two cases. It will either move sideways or return to an uptrend.
Rules for opening orders in a downtrend
The trend is our friend. Please repeat this quote when you open the candlestick chart and start trading. The trend is a “close friend”. Just follow it and trade. And in a downtrend, you should only open SELL orders.
All you need to do to make money in this market is to wait for the trend and follow the discipline. Uptrend = BUY. Downtrend = SELL.

Three entry signals in a downtrend
The trading formula in a downtrend is you must only open SELL orders.
There are 3 extremely important signals to watch out for: (1) Bearish reversal candlestick patterns, (2) The price breaks out of support to form a downtrend, (3) The price retests the levels in a downtrend. I will explain each signal so you can better understand it
Signal 1: Reversal candlestick patterns from bullish to bearish
The price will keep falling in a downtrend. Combined with bearish candlesticks, your trades will be a lot safer.
I will list out 3 bearish reversal candlesticks with the highest accuracy. They are Bearish Pin Bar (Shooting Star), Bearish Engulfing, and Evening Star. These are the standard signals for you to act in a downtrend.

Signal 2: The price breaks out of the support and goes down forming a downtrend
In most cases, the price will create a long candlestick to definitively break out of the support and go down => forming a downtrend. This is also considered a signal for you to focus and place a SELL order following the trend.

Signal 3: The price retests in a downtrend
When the market enters a downtrend, The price will keep falling, creating lower troughs after troughs. And each time the price falls out of a trough, it will probably retest the trough just crossed. I often call them levels in a downtrend.

How to trade Forex most effectively with a downtrend
You must really grasp the 3 signals above. That is the point of whether you should open an order or not. And now, I’ll go into detail.
Strategy 1: Trade Forex with the Trendline in a downtrend
This is the most effective trading strategy in a downtrend when you can draw a Trendline. The only thing you need is for the price to touch the Trendline and go down. Then, if one of the above 3 signal candles appears, open a SELL order.
+ Entry Point: Right after the price finishes creating a signal candlestick pattern like Evening Star (or Bearish Engulfing, Bearish Pin Bar) while touching the Trendline.
+ Stop-Loss: At the nearest peak before the price touches the Trendline.
+ Take-Profit: You should take profits when the price touches support levels that have been formed in the past.

Strategy 2: Trade using Retest and Breakout in a downtrend
This is a very safe trading strategy. It is when the price shows signs of breaking out of the support and going down, creating a downtrend. Wait patiently for the Retest point. As soon as the retest appears and the price creates one of 3 signal candlestick patterns that I introduced above, you can consider opening a SELL order as follows:
+ Entry Point: Right after the price finishes creating a signal candlestick pattern like Evening Star (or Bearish Engulfing, Bearish Pin Bar) while retesting the newly formed resistance (old support).
+ Stop-Loss: At the resistance level that has just been retested by the price.
+ Take-Profit: You should take profits when the price touches support levels that have been formed in the past.

Strategy 3: Trade by using Trend and Signal
This is a somewhat risky trading style in a downtrend. However, its advantage is that it is easy to get a reasonable entry point. You only need to focus on the 2 factors: Trend and Signal.
+ Entry Point: Right after the price finishes creating a signal candlestick pattern like Evening Star (or Bearish Engulfing, Bearish Pin Bar).
+ Stop-Loss: At the nearest resistance level in a downtrend. (The example in the picture is the tail of a Bearish Pin Bar candlestick).
+ Take-Profit: You should take profits when the price touches support levels that have been formed in the past.

Conclusion
Don’t try to stop a downwards rushing train, it will crush you into pieces. So does a downtrend. When the market goes down, either you follow that trend or you don’t do anything. Going against the trend is “throwing money through the window”.
What you need to do in a downtrend is Wait for the signal and open SELL orders.
Sign up for a Demo account below. Open a Japanese candlestick chart and verify what you have learned today.
I will have many articles to practice this knowledge. Because this is the safest Forex trading strategy that you can apply to a downtrend.
Register an Exness account NowGet $1,000 Free for beginners
The post What Is A Downtrend In Forex? How To Trade Forex With A Downtrend appeared first on How To Trade Blog.
source https://howtotradeblog.com/what-is-a-downtrend-forex/
No comments:
Post a Comment