Thursday, October 7, 2021

What Is A Downtrend In Forex? How To Trade Forex With A Downtrend

The trend is a favorite dish of professional traders. As long as the market has a clear trend, they will probably make money. In the previous article, I mentioned everything about an uptrend. And now, I’ll introduce you to the downtrend and how to open safe Forex orders with a downtrend.

Register an Exness account NowGet $1,000 Free for beginners

What is a downtrend in Forex? What are its common features?

A downtrend is the bearish trend of the market. The price keeps falling for a long time. It creates lower troughs after troughs and lower peaks after peaks.

In technical analysis, a downtrend is also known as the Bear market.
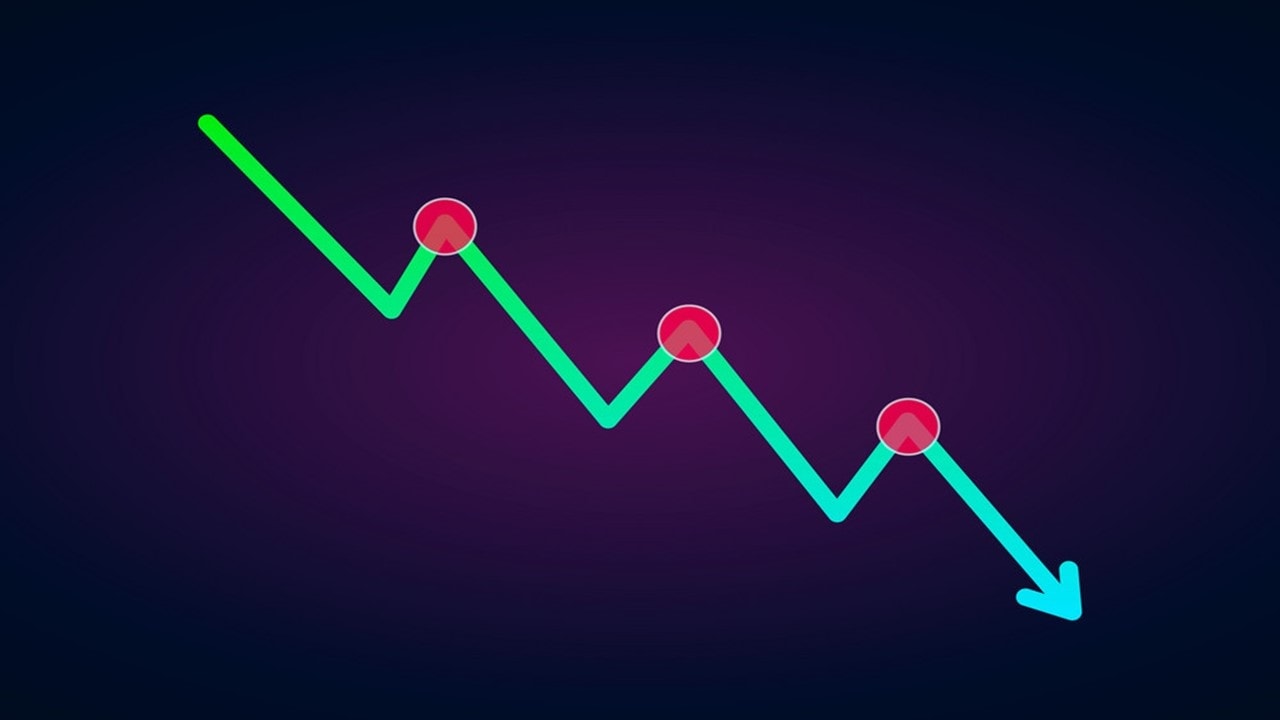
What is a downtrend in Forex?

Common features of a downtrend

+ The following trough is lower than the previous trough. Trough (B) is lower than trough (A) and trough (C) is lower than trough (B). Just like that, the following troughs will be lower than the previous ones.

+ The following peak is lower than the previous peak: Peak (2) is lower than peak (1) and peak (3) is lower than peak (2). The market continuously creates lower peaks after peaks.

When both signals appear, you can be sure the market has entered a downtrend.

Identification features of a downtrend

Common patterns of a downtrend

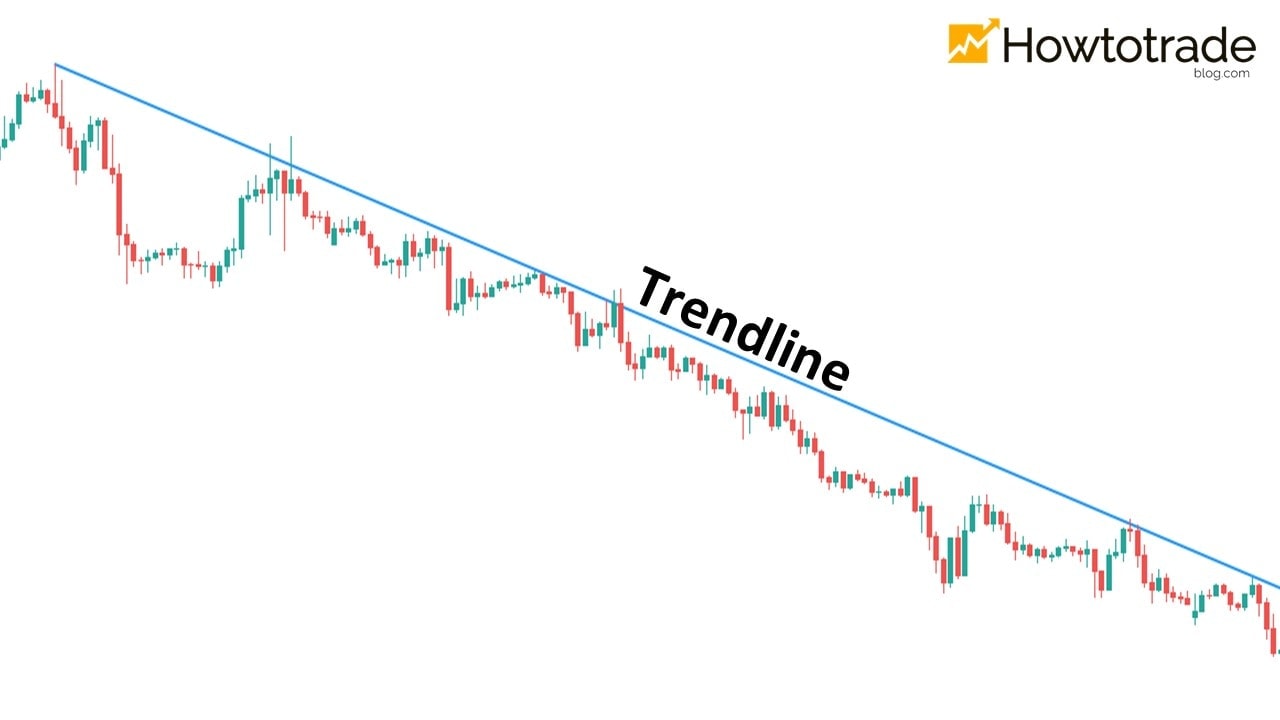
Pattern 1: A downtrend in which you can draw a trendline

This is the most classic downtrend pattern and the most perfect one in technical analysis.

What is a trendline? In a downtrend, the bearish trendline will connect the peaks together. It acts as a resistance level for the market in a downtrend.

You just need to draw a straight line downwards connecting the 3 peaks together. So you will have a Trendline in a downtrend. And when the price touches the trendline, it will fall back.
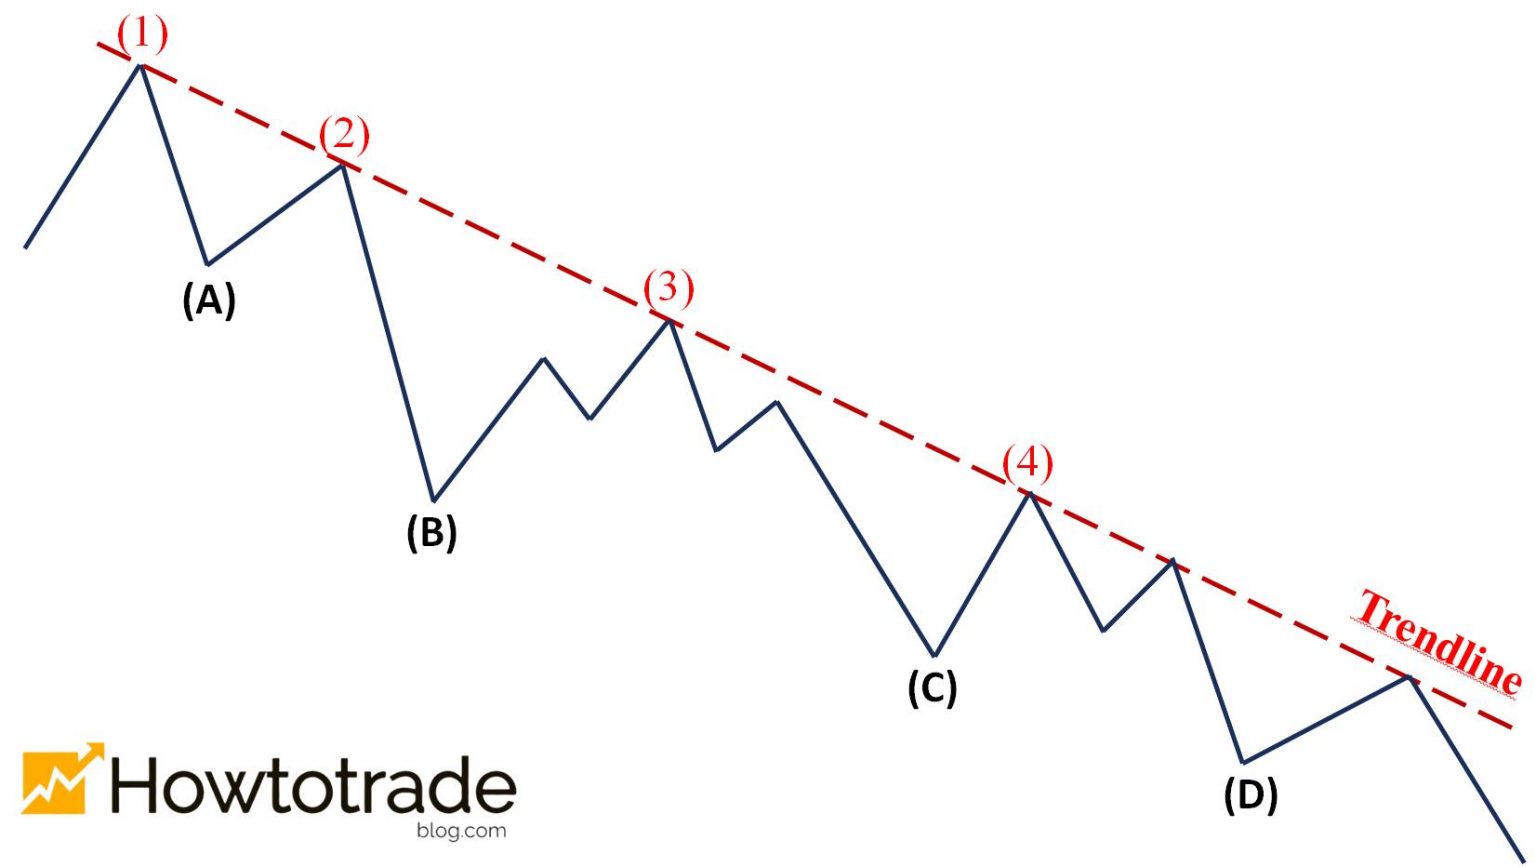
Trendline in a downtrend

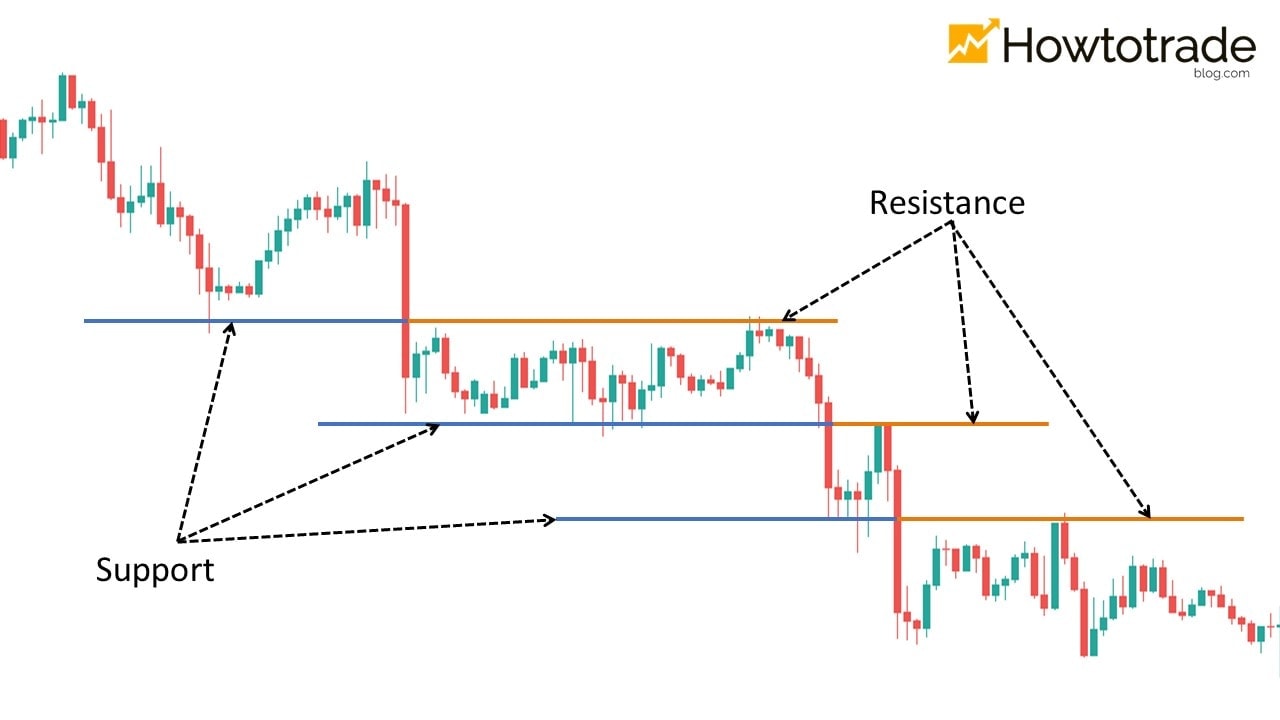
Pattern 2: The price breaks out of the support, drops, and enters a downtrend

This is a recognizable downtrend pattern that is very popular in the market. The price breaks out of the support and goes down. After that, it retests that broken support level (which becomes a resistance level after the breakout).
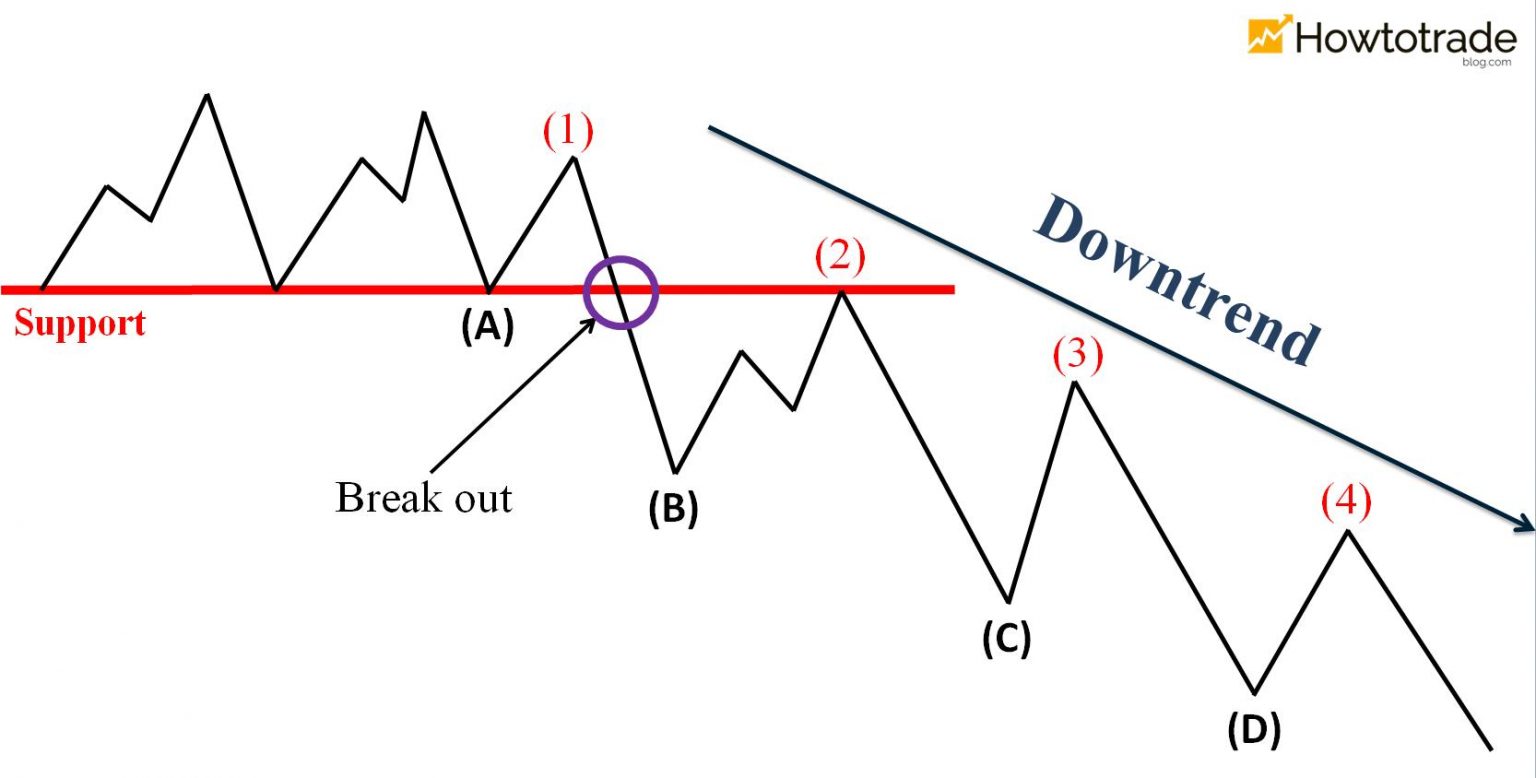
The price breaks out of the support and enters a downtrend

Pattern 3: Downtrend and Retest

This is also one of the very common patterns when the market forms a downtrend. The price will keep falling, creating lower troughs after troughs. And each time the price falls out of a trough, it will retest the trough just crossed. It will then continue to fall. This process repeats itself many times.
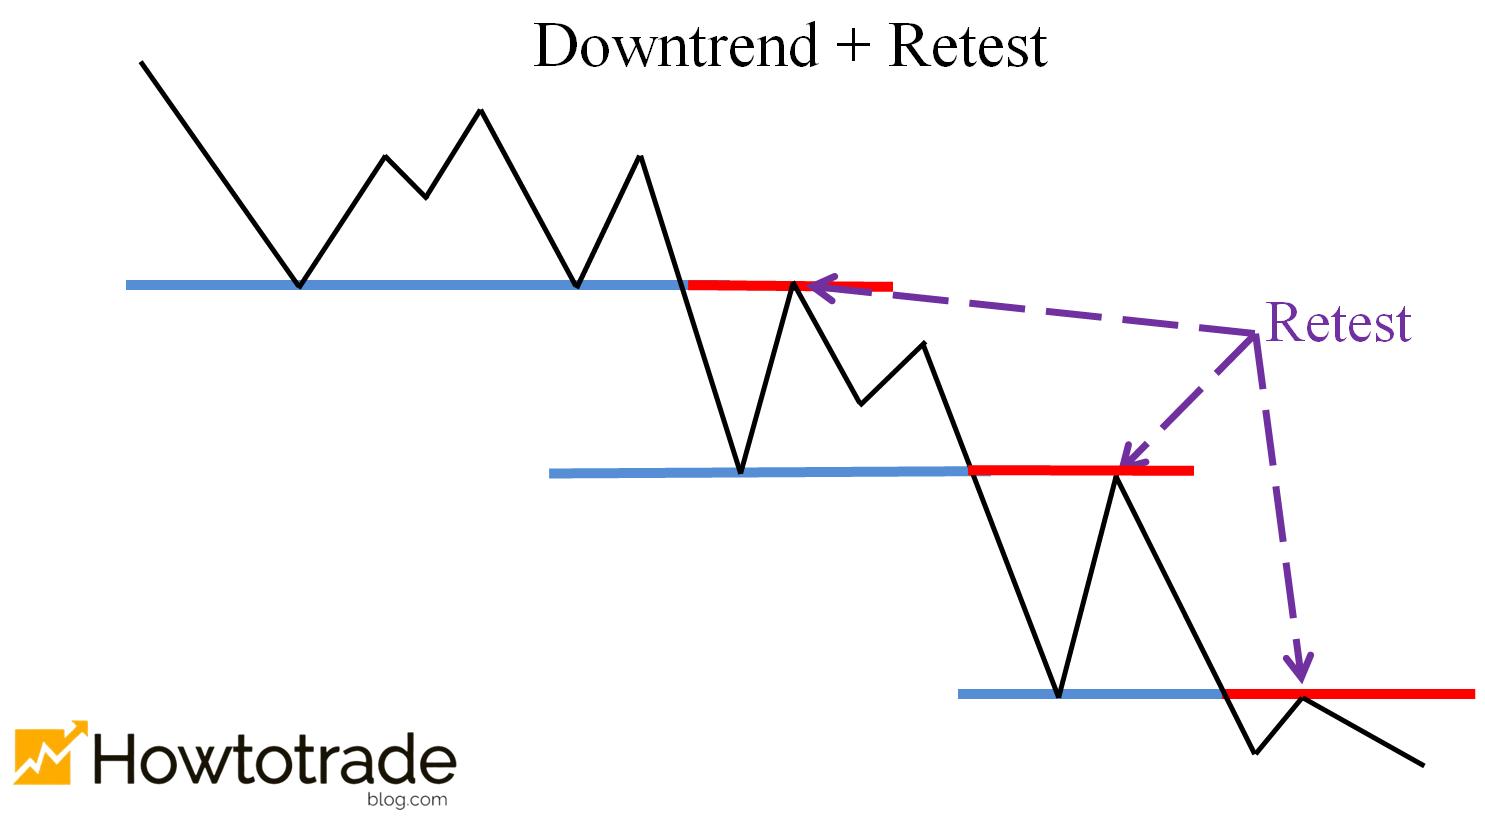
The price retests the levels in a downtrend

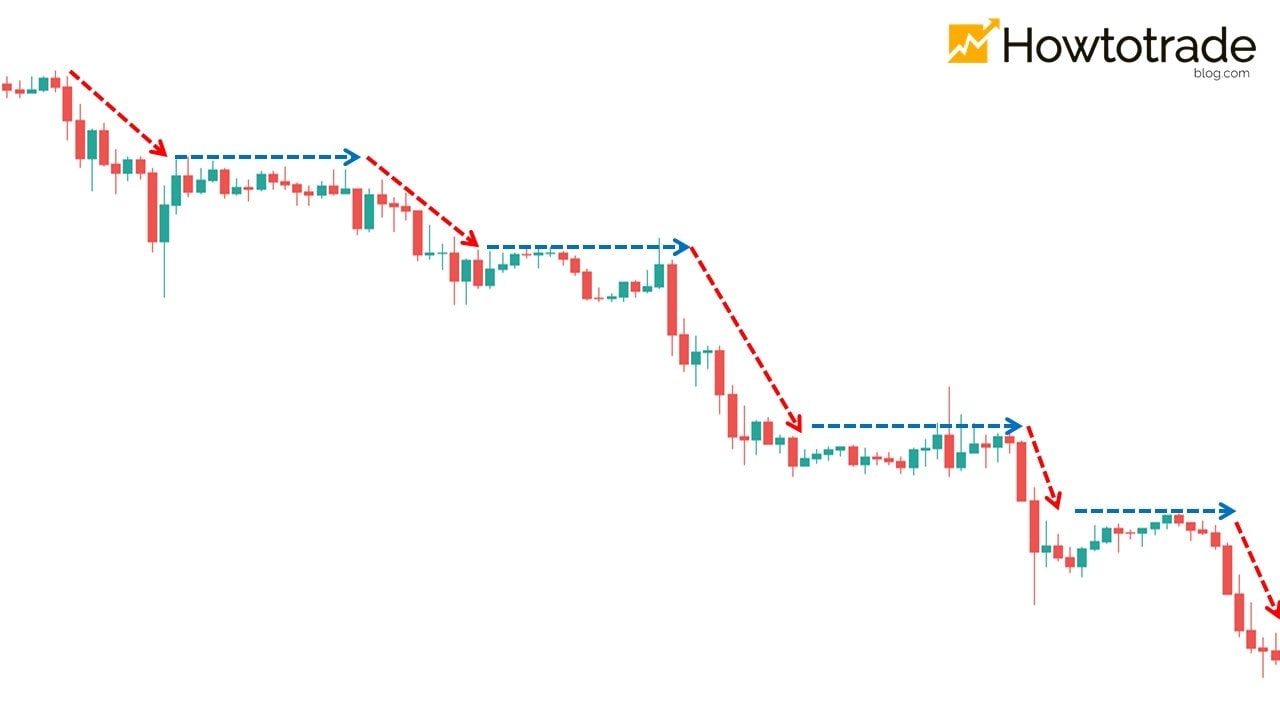
Pattern 4: The ladder downtrend pattern

The price goes down, then sideways, and then goes down again. In general, you will realize that this is a downtrend. But you will not know how and when to open an order safely.
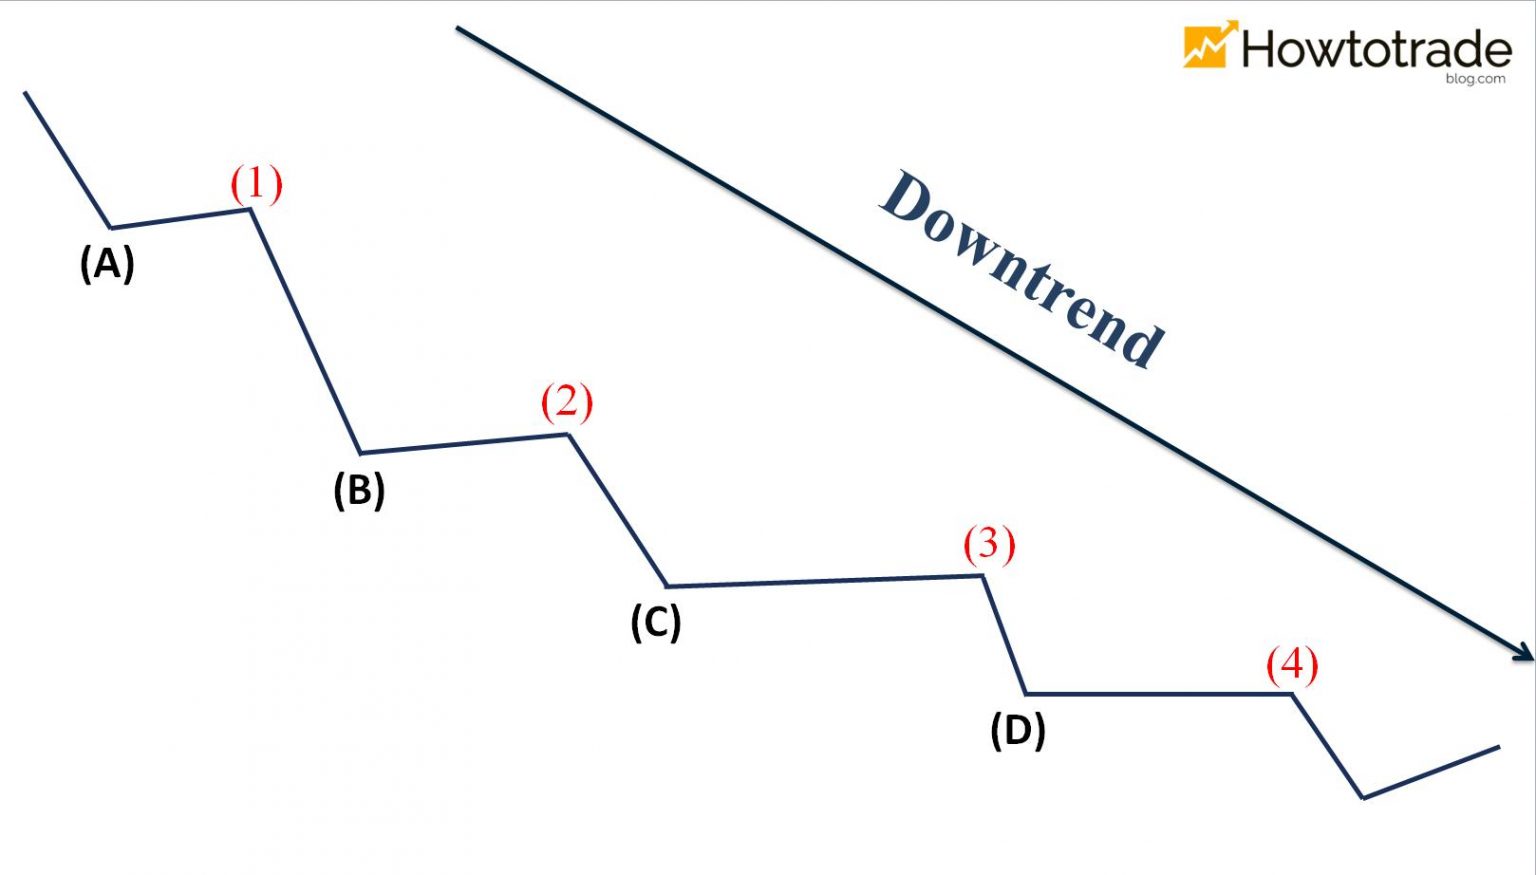
The ladder downtrend pattern

Practical examples of patterns in a downtrend

  1. Draw a Trendline in a downtrend.
Draw a Trendline in a downtrend
  1. The price breaks out of the support and goes down.
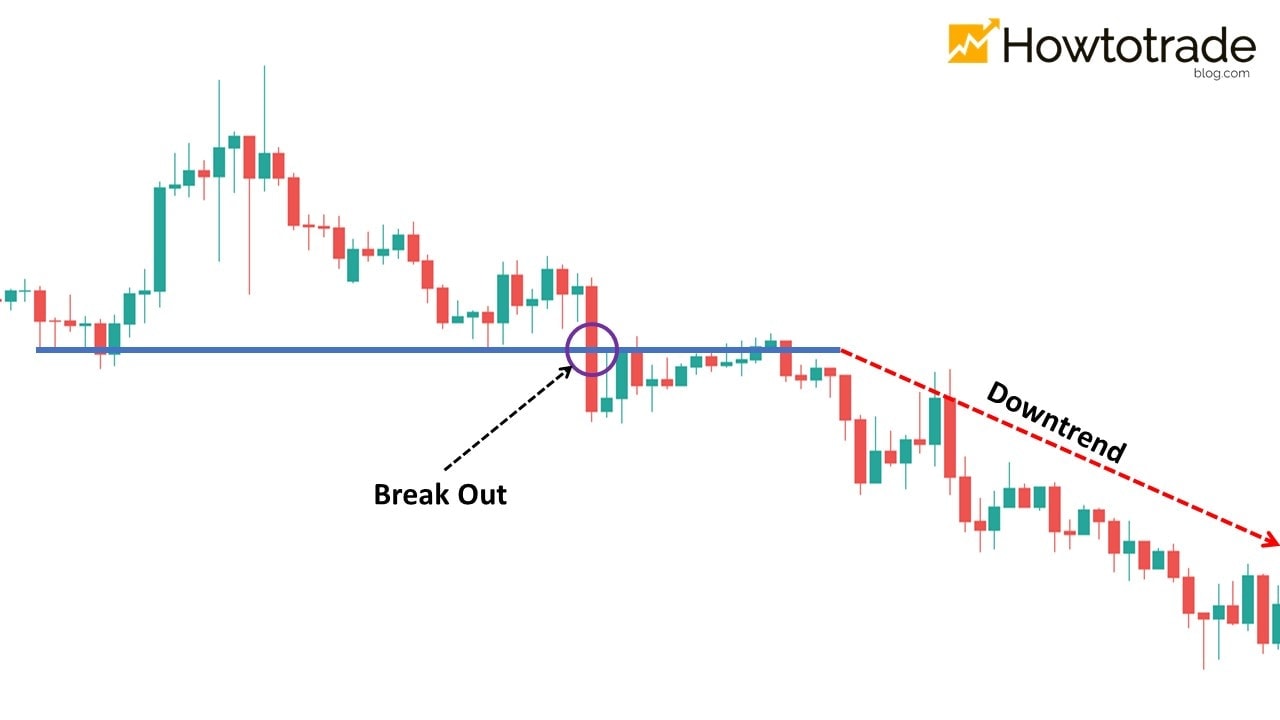
A practical example in which the price breaks out of the support and goes down
  1. Downtrend and retest.
An example in which the price falls out of the trough in a downtrend and retests
  1. The ladder downtrend pattern.
The ladder downtrend pattern in practical

When is a downtrend over?

Answers: It is when the principles of a downtrend are broken. The previous peak and trough are no longer lower than the previous ones => The downtrend has ended.

When a downtrend ends, the market will likely fall into two cases. It will either move sideways or return to an uptrend.
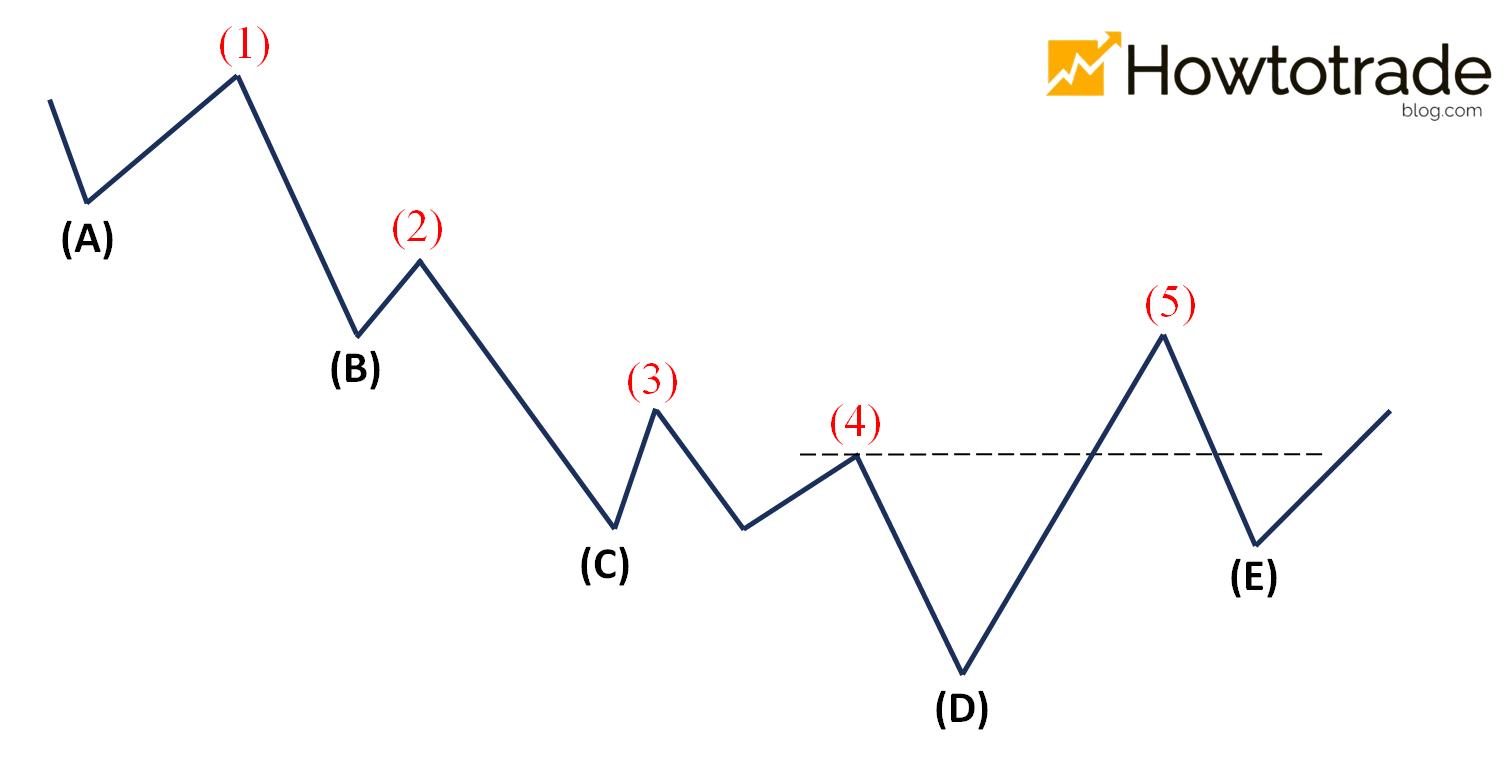
When is a downtrend over?

Rules for opening orders in a downtrend

The trend is our friend. Please repeat this quote when you open the candlestick chart and start trading. The trend is a “close friend”. Just follow it and trade. And in a downtrend, you should only open SELL orders.

All you need to do to make money in this market is to wait for the trend and follow the discipline. Uptrend = BUY. Downtrend = SELL.

Trading rules in a downtrend

Three entry signals in a downtrend

The trading formula in a downtrend is you must only open SELL orders.

There are 3 extremely important signals to watch out for: (1) Bearish reversal candlestick patterns, (2) The price breaks out of support to form a downtrend, (3) The price retests the levels in a downtrend. I will explain each signal so you can better understand it

Signal 1: Reversal candlestick patterns from bullish to bearish

The price will keep falling in a downtrend. Combined with bearish candlesticks, your trades will be a lot safer.

I will list out 3 bearish reversal candlesticks with the highest accuracy. They are Bearish Pin Bar (Shooting Star), Bearish Engulfing, and Evening Star. These are the standard signals for you to act in a downtrend.

Reversal candlestick patterns from bullish to bearish

Signal 2: The price breaks out of the support and goes down forming a downtrend

In most cases, the price will create a long candlestick to definitively break out of the support and go down => forming a downtrend. This is also considered a signal for you to focus and place a SELL order following the trend.

The price breaks out of the support and goes down, creating a downtrend

Signal 3: The price retests in a downtrend

When the market enters a downtrend, The price will keep falling, creating lower troughs after troughs. And each time the price falls out of a trough, it will probably retest the trough just crossed. I often call them levels in a downtrend.

The price penetrates troughs and retests in a downtrend

How to trade Forex most effectively with a downtrend

You must really grasp the 3 signals above. That is the point of whether you should open an order or not. And now, I’ll go into detail.

Strategy 1: Trade Forex with the Trendline in a downtrend

This is the most effective trading strategy in a downtrend when you can draw a Trendline. The only thing you need is for the price to touch the Trendline and go down. Then, if one of the above 3 signal candles appears, open a SELL order.

+ Entry Point: Right after the price finishes creating a signal candlestick pattern like Evening Star (or Bearish Engulfing, Bearish Pin Bar) while touching the Trendline.

+ Stop-Loss: At the nearest peak before the price touches the Trendline.

+ Take-Profit: You should take profits when the price touches support levels that have been formed in the past.

How to trade Forex with the Trendline in a downtrend

Strategy 2: Trade using Retest and Breakout in a downtrend

This is a very safe trading strategy. It is when the price shows signs of breaking out of the support and going down, creating a downtrend. Wait patiently for the Retest point. As soon as the retest appears and the price creates one of 3 signal candlestick patterns that I introduced above, you can consider opening a SELL order as follows:

+ Entry Point: Right after the price finishes creating a signal candlestick pattern like Evening Star (or Bearish Engulfing, Bearish Pin Bar) while retesting the newly formed resistance (old support).

+ Stop-Loss: At the resistance level that has just been retested by the price.

+ Take-Profit: You should take profits when the price touches support levels that have been formed in the past.

Trade Forex using Retest and Breakout

Strategy 3: Trade by using Trend and Signal

This is a somewhat risky trading style in a downtrend. However, its advantage is that it is easy to get a reasonable entry point. You only need to focus on the 2 factors: Trend and Signal.

+ Entry Point: Right after the price finishes creating a signal candlestick pattern like Evening Star (or Bearish Engulfing, Bearish Pin Bar).

+ Stop-Loss: At the nearest resistance level in a downtrend. (The example in the picture is the tail of a Bearish Pin Bar candlestick).

+ Take-Profit: You should take profits when the price touches support levels that have been formed in the past.

Trade Forex by using Trend and Signal

Conclusion

Don’t try to stop a downwards rushing train, it will crush you into pieces. So does a downtrend. When the market goes down, either you follow that trend or you don’t do anything. Going against the trend is “throwing money through the window”.

What you need to do in a downtrend is Wait for the signal and open SELL orders.

Sign up for a Demo account below. Open a Japanese candlestick chart and verify what you have learned today.

I will have many articles to practice this knowledge. Because this is the safest Forex trading strategy that you can apply to a downtrend.

Register an Exness account NowGet $1,000 Free for beginners

The post What Is A Downtrend In Forex? How To Trade Forex With A Downtrend appeared first on How To Trade Blog.


source https://howtotradeblog.com/what-is-a-downtrend-forex/

Wednesday, October 6, 2021

What Is An Uptrend? How To Trade Forex Effectively In An Uptrend

In this article, I will introduce every single thing about the uptrend in Forex, including 2 main parts.

(1) What is an uptrend? How to define an uptrend and some classic examples.

(2) Introduce 2 signals and 3 safe trading strategies with the highest accuracy in an uptrend.

“80% of the time, the market goes sideways. And all professional traders focus on the remaining 20% when the market enters a trend. It is simply because there is a trend, there is money.“

To make things easier to understand, all you need to do is to wait for the market to confirm the trend. Then, focus on finding safe entry points.

This may be the article to help you make a lot of profits in trading. So, I hope you read it carefully and remember it. I will try to use the simplest words to convey to you.

What is an uptrend in Forex?

An uptrend is a bullish trend in the market. Prices will continuously increase over a certain period of time. They create higher peaks after peaks and higher troughs after troughs.

What is an uptrend in Forex?

– Basic features of an uptrend in Forex:

The following peak is higher than the previous one. Peak (2) is higher than peak (1). Peak (3) is higher than peak (2), and so on.

The following trough is higher than the previous one. Trough (B) is higher than trough (A). Just like that, the price will increase as the troughs get higher gradually.

Basic characteristics of an uptrend in Forex

These are the two most basic signs for you to identify a market’s uptrend. When the price exceeds a peak, it will inevitably create a new higher one. Your job is to wait for the market to confirm a new trough that is higher than the old one. If this happens, you can claim that an uptrend has been created.

Some popular uptrend patterns

Pattern 1: The most perfect uptrend

An uptrend is considered perfect when it draws a trendline.

What is a trendline? In an uptrend, the trendline is a straight line connecting troughs. It acts as a support line for the market. And when the price touches the trendline, it will bounce back.

In an uptrend, you just need to draw a straight line connecting the 3 troughs together. So, we have a bullish trendline. This is considered the most perfect case of an uptrend.

What is a trendline?

Pattern 2: The price breaks out of the resistance and enters an uptrend

Signal 1: The price is moving sideways, then it breaks out of the resistance and rises => Peak (2) in the future will definitely be higher than peak (1).

Signal 2: The price retests the recently passed resistance and then rebounds => It creates trough (B) higher than trough (A).

=> The market goes sideways in a certain period of time. It then breaks out of the resistance and rises sharply, creating an uptrend.

The price breaks out of the resistance and enters an uptrend

Pattern 3: The uptrend creates (support/resistance) levels

This is one of the 3 classic uptrend patterns that you need to keep in mind.

As prices rise and form a new peak, this peak will become a resistance zone. If the price exceeds a peak (breaks out of the resistance) and rises, that resistance will always become a support zone. And I will collectively call them levels. The price falls back, touches this level, and continues to rebound. This process goes on and on and on and forms an Uptrend.

The uptrend creates support and resistance levels

Pattern 4: Other uptrend patterns

Uptrends are not always the same. Sometimes, it simply creates higher peaks after peaks and higher troughs after troughs. But it does not follow any rules at all.

(1) The price enters an uptrend. The following peak is higher than the previous peak. But the following trough is equal to the previous trough.

An uptrend with equal troughs

(2) The ladder uptrend pattern: The price exceeds peak (1) and creates peak (2) which is higher. It then goes sideways, creating trough (B) higher than trough (A). The price continues to rise, creating peak (3) higher than peak (2). And then it goes sideways…. Just like that, the market creates an uptrend within a ladder pattern.

The ladder uptrend pattern

(3) The uptrend pattern with strong price fluctuations. These are uptrend patterns that still meet the following conditions: The previous peak and trough are higher than the previous ones. But compared to other uptrend patterns, it is not good-looking.

The uptrend pattern with strong price fluctuations

When is an uptrend over?

The answer is simple. It is when uptrend conditions are broken. The previous peak and trough are no longer higher than the previous ones => The uptrend has ended.

When an uptrend ends, the market will likely fall into sideways to accumulate bullish momentum. Or it will get into a downtrend.

An uptrend will be over when its principles are broken

Detailed examples of uptrend patterns in Forex

I have introduced you to all the theories you need to understand when the market is in an uptrend. And now, before going to principles and how to trade in an uptrend, I will illustrate some popular uptrend patterns that you may come across.

– The perfect uptrend pattern, in which we can draw a trendline.

Example of a perfect uptrend pattern

– The uptrend creates (support/resistance) levels.

Example of an uptrend that creates support and resistance levels

– The ladder uptrend pattern, in which the price increases to create peaks and then goes sideways.

Example of a ladder uptrend pattern

Principles for opening Forex orders in an uptrend

There are certain principles that you must keep in mind.

– If you try to fight a running train, it will crush you into pieces. The same goes for an uptrend, aka a bullish trend. If you try to fight against it with SELL orders, then the probability of losing money is high. Therefore, in an uptrend, you should only open BUY orders.

– 80% of the time, the market goes sideways. And in the remaining 20%, the market will show a clear trend. So all you need to do is wait, patiently wait. We only trade when the probability of winning reaches the highest. And price trends are the key to opening successful orders.

Wait patiently for the uptrend before taking action

– Price will only increase continuously in a period of time. Therefore, the higher the price becomes, the higher the probability of ending an uptrend is. For some professional traders, the higher the price is, the lower the amount of money they trade.

Forex signals in an uptrend

The mantra: In an uptrend, you can only open BUY orders. Please keep this in mind.

There are 2 extremely important signals in an uptrend that you should know. They are (i) Bullish reversal candlestick patterns with high accuracy and (ii) Levels (Support/Resistance) formed in an uptrend.

The most reliable bullish reversal candlestick patterns

There are only 3 candlestick patterns with high accuracy in an uptrend. They are Bullish Pin Bar (Hammer candlesticks), Bullish Engulfing, Morning Star candlestick patterns. These are 3 types of bullish reversal candlestick patterns that have high accuracy (about 80%) in the market. And I will show you how to use these 3 candlestick patterns in the uptrend below.

The most reliable bullish reversal candlestick patterns in an uptrend

Levels (Support/Resistance)

The bullish market creates following peaks higher than previous ones. These peaks become a resistance zone in the uptrend. When the price crosses a peak (breaks out of the resistance) and rises, it tends to retest these levels.

Levels (Support/Resistance) in an uptrend

How to trade Forex most effectively with an uptrend

So we have 2 signals in an uptrend for you to make trading decisions. And now, I will combine them together and offer the 3 following effective Forex trading strategies.

Strategy 1: Trendline combined with Doji or Bullish Pin Bar candlestick

This is a trading strategy using the trendline. At this time, the trendline acts as a support line. When prices create balanced candlestick patterns such as Doji or bullish reversal candlesticks such as Bullish Pin Bar, this is a reliable signal for the market to rebound.

Place a BUY order with the Trendline in an uptrend as follows:

+ Entry Point: As soon as the price completes creating a Bullish Pin Bar candlestick or a Doji candlestick above the Trendline.

+ Stop-Loss: At the nearest support level before the price touches the Trendline.

+ Take-Profit: You should take profits when the price touches resistance levels that have been formed in the past.

The combination of the trendline and Doji or Bullish Pin Bar candlestick in an uptrend

Strategy 2: A reversal candlestick pattern appears at levels in an uptrend

This is the super classic T.L.S strategy (Trend, Level, Signal). It is a combination of trends, levels, and candlestick patterns. And it is one of the money-making formulae of so many successful traders around the world.

The price in an uptrend usually tends to retest the levels just passed with bullish reversal candlestick patterns. This is a condition for you to open a BUY order

Place a BUY order as follows:

+ Entry Point: As soon as the price finishes creating a signal candlestick pattern like Morning Star (or Bullish Engulfing, Bullish Pin Bar) at the Resistance retest point (which is a new Support after the breakout).

+ Stop-Loss: At the nearest trough before the price retests

+ Take-Profit: You should take profits when the price touches resistance levels that have been formed in the past.

How to trade using reversal candlestick patterns at levels in an uptrend

Strategy 3: Reversal candlestick patterns in an uptrend

It is not always in an uptrend that you can draw a trendline. And in an uptrend, the price does not always retest the old level to create a candlestick pattern. Therefore, in many cases, the signal alone is enough for the uptrend to carry on.

You can understand it simply as follows: The price in an uptrend will create trading signals which are reliable bullish reversal candlestick patterns. This is the time when you can place BUY orders and live off the strong uptrend waves.

Place a BUY order as follows:

+ Entry Point: As soon as the price completes a bullish reversal candlestick pattern like Morning Star (or Bullish Engulfing, Bullish Pin Bar).

+ Stop-Loss: At the nearest trough before the price creates a bullish reversal candlestick pattern.

+ Take-Profit: You should take profits when the price touches resistance levels that have been formed in the past.

How to trade using reversal candlestick patterns in an uptrend

Summary

+ The trend is our friend. Invariably, the trend is the best friend of traders. And the principle is: There are trends, there are transactions. No trend means doing nothing.

+ In an uptrend, all you need to do is: wait for the signal and open BUY orders. It is not difficult for you to recognize that the market has been on an uptrend. However, waiting patiently for high-precision entry points is extremely difficult.

+ Bullish Pin Bar, Bullish Engulfing, and Morning Star are the 3 most accurate candlestick patterns used as entry signals in an uptrend.

Open the Japanese candlestick chart and review the price history. Verify if the knowledge you have read today on How To Trade Blog is correct or not. We will have articles detailing trading strategies applying trends and candlestick patterns. Please look forward to it.

Please read this article in detail again. Because most likely, your money is made from the knowledge in this article. Finally, goodbye and see you again in the next article about the downtrend.

Register an Exness account NowGet $1,000 Free for beginners

The post What Is An Uptrend? How To Trade Forex Effectively In An Uptrend appeared first on How To Trade Blog.


source https://howtotradeblog.com/what-is-an-uptrend-forex/

Tuesday, October 5, 2021

How To Use Trend Trading With Supply And Demand zones (Chapter 3)

I write this article from my own experience after practicing trend trading with Supply and Demand zones for months. Hope you can gain more knowledge after trading this strategy.

In this chapter, I will guide you on how to enter orders and the reason behind them. And the real trading orders will be in chapter 4.

Register an Exness account NowGet $1,000 Free for beginners

Conditions of the strategy

– I use the daily chart to analyze and predict the price because I’m not a day trader. I don’t focus 100% of my time on making money in the markets. So I use the daily chart to slow things down.

– Some of my favorite currency pairs are USD/JPY, EUR/USD, NZD/USD, GOLD (XAU/USD). Because everyone has their strengths, I’m only focusing on a few currency pairs that I understand well. If you’re in favor of the currency pairs above, EUR/JPY or GBP/JPY is also worth a try.

Trading conditions for Trend and Supply Demand strategy

– I manage money according to the Risk/Reward ratio (R/R). There is a specific guide below to help you set up Stop Loss (SL) and Take Profit (TP).

If you still don’t understand the uptrend and downtrend clearly, please read the two articles below.

+ What is an uptrend? How to identify Uptrend.

+ What is a downtrend? How to identify Downtrend.

– We will trade with 2 steps:

+ Step 1: Identify the main Trend and Supply and Demand zones created by the market.

+ Step 2: Wait for the price to retest the Supply or Demand zone and enter an order. In an uptrend, we’ll BUY. On the contrary, we’ll SELL in a downtrend.

Detailed guide on how to trade

BUY order

First, you need to identify the Uptrend and the Demand Zone.

The theory goes like this. During the increasing process in an uptrend, the market will create demand zones. We will open BUY orders in these zones.

How to enter BUY orders

For detailed example with USD/JPY (from January 27, 2021 to February 17, 2021)

The USD/JPY entered an uptrend period.
Identified and drew the Demand zone on the chart (yellow area). My job was to wait for the price to come back and retest this zone and open a BUY order.

Identify the Demand zone in the Uptrend

The price retested the Demand zone that I drew and created a trading signal with a Doji candlestick.

+ Opened a BUY order right away.

+ Set the SL below the Demand zone.

+ Set the TP at the previous top.

Open a BUY trade
Open a BUY trade

The price bounced back to the TP point. In this trade, I won 2R.

A nice result with 2R profit

SELL order

In theory, the price keeps falling and enters a Downtrend. Identify the Supply zones that the market has created. Wait for the signal to open the SELL order.

How to open SELL orders

For specific example with USD/JPY (from July 5, 2021 to August 5, 2021)

USD/JPY was in a downtrend. This decreasing process created the Supply Zone (yellow area) on the chart. This was the main zone I waited for a SELL order.

Identify the Supply zone in a downtrend

The price moved back to the Supply zone and showed signs of reversal.
+ Entered a SELL order here.

+ Set the SL above the Supply zone.

+ Set the TP at the previous bottom.

Enter a SELL order in the Supply zone

Result: This SELL order has reached the TP with 2.5R.

Sell order results with 2.5R profit

The lessons I draw after using Trend trading and Supply Demand

Trend is the most important

Remember that the main trend of the market is the first thing you should pay attention to. Then come to the Supply and Demand zones.

If it is Uptrend, find the Demand zone. Conversely, in the downtrend, you focus on the Supply zone.

Identifying the main trend of the market is the top priority

Trading signals

Balanced candlesticks like Doji in the Supply Demand zone are good signals for you to consider opening an order. We will discuss this in detail on the next chapter.

When the market has no good signal for you to BUY or SELL at the Supply and Demand zones, ignore it. Be patient to wait for a really nice one. Do not rush because you will always have another chance.

The signal when Supply and Demand zones could be broken

Be careful with the Engulfing candlestick pattern or the inverted Pin Bar candlesticks. When the above signals appear, you can consider closing the order.

The signal when Supply and Demand zones could be broken

How long do the Supply and Demand zones become meaningless?

In theory with the daily chart, if the market does not return to the Supply or Demand zone within 1 month, that zone will become meaningless.

But in reality and my opinion, we will have a plan to execute orders according to how the market reacts.

Swap between Supply and Demand

When the Supply zone is broken, it will change its role to the Demand zone and vice versa. This is quite similar to the support and resistance.

Swap between Supply and Demand

Conclusion

So we have finished the Trend + Supply/Demand strategy. Please read it again and practice on the Tradingview basic account. Don’t worry. The basic account is completely free.

I will continue to show how to trade Forex and Gold for real on MT4 in the next article. There will be a detailed analysis together with trading psychology too. Please wait for it.

The post How To Use Trend Trading With Supply And Demand zones (Chapter 3) appeared first on How To Trade Blog.


source https://howtotradeblog.com/trend-trading-supply-and-demand-zones/

Monday, October 4, 2021

How To Identify And Trade With Supply And Demand Zones (Chapter 2)

In this article, I will present 2 main topics.

– Instructions on how to identify a Supply or Demand zone.

– How to BUY/SELL, how to set Stop Loss, Take Profit with them in Forex trading.

If you do not know what Supply and Demand zones are, you can read this article: What Are Supply and Demand Zones? The Idea Of This Strategy?

Ok! Now let’s go through each part so you can fully understand the strategy.

Register an Exness account NowGet $1,000 Free for beginners

How to identify the basic Supply and Demand zones

Identify the Supply zone

The Supply zone has 2 common patterns: (1) RP – Reversal and (2) CP – Continuation.

(1) Reversal pattern (RP): Rally – Base – Drop

Reversal Supply pattern

The price moves sideways after an uptrend and creates a sideways candlestick zone called the Base. Then it falls dramatically with a long body candlestick. This Base is the reversal Supply zone (RP).

For example:

An example of the reversal Supply pattern

The 6 candlesticks moving sideways in the image above are the Base. When the gold price falls sharply and creates a red candlestick with a long body, this Base becomes the reversal Supply zone.

(2) Continuation pattern (CP): Drop – Base – Drop

Continuation Supply zone

The price stops decreasing and creates sideways candlesticks. Then it continues to fall significantly. The sideways zone (Base) in this process will be the Supply zone.

Detailed example:

An example of the continuation Supply pattern

Identify the Demand zone

The Demand zone is similar to the Supply but we will focus on the strong bullish candlesticks.

(1) Reversal Demand pattern (RP): Drop – Base – Rally

Reversal Demand pattern

For example:

An example of the reversal Demand pattern

When the market bounces back, it creates a long green candlestick. Then the Base will be the Demand zone (RP).

(2) Continuation Demand pattern (CP): Rally – Base – Rally

Continuation Demand pattern

Detailed example:

An example of the continuation Demand pattern

How to trade with the Supply and Demand zones

All we need to do is to watch for the strong bullish or bearish candlesticks. This is a sign of cash flow from large organizations. When the signal appears, it’s time to look for entry points.

How to trade with the Supply zone

After identifying the Supply zone, the main job is to wait for SELL opportunities. When the price returns to retest the Supply zone, find an appropriate entry point and place a SELL order.

For example, the yellow zone is the Supply zone of gold (XAU/USD).

(1) When the price returns to this zone and creates a small body candlestick, this could be a signal that it will stop increasing.

Trading with the Supply zone

(2) Place 1 SELL order (Risk/Reward = 1:2)

+ Set the stop loss a few pips above the Supply zone to avoid being swept by the market.

+ Set the take profit to overlap the below Demand zone.

Result: The price drops sharply and touches TP.

Trading result with the Supply zone

I have another example about the gold price.

(1) The price increases and enters the Supply zone. Then it begins to show a slow increase signal with a small green candlestick.

Sell Gold at the Supply zone

(2) Place 1 SELL order (Risk/Reward = 1:3)

+ Set the stop loss a few pips above the Supply zone.

+ Set the take profit to overlap the below Demand zone (as the picture shown).

Result: The price falls sharply and hits TP.

Trading result with the Sell order

How to trade with the Demand zone

The first thing to do is to identify the Demand zone. The next is to wait for the BUY signal. When the price retests the Demand zone and creates a bullish reversal signal => Place a BUY order.

We have an example of the Gold BUY order (XAU/USD).

The price falls back to the Demand zone and creates a reversal signal.

How to trade with the Demand zone

Place the BUY order:

+ Set Stop Loss below the Demand zone.

+ Set Take Profit in 2 Supply zones.

As a result, the price increases and hits both TP1 and TP2.

Result of the BUY order

It is already quite long so I’ll save the real trading experiences for the next article. We’ll also learn the reason why you should use a daily chart and when the Supply and Demand zones are no longer make sense.

Register an Exness account NowGet $1,000 Free for beginners

The post How To Identify And Trade With Supply And Demand Zones (Chapter 2) appeared first on How To Trade Blog.


source https://howtotradeblog.com/how-to-identify-trade-supply-and-demand-zones/

Saturday, October 2, 2021

What Are Supply and Demand Zones? The Idea Of This Strategy? (Chapter 1)

“Following the footsteps of Big Boys or big organizations in the market, you will make money.”

This is the motto of those who prefer the school of trading according to the Supply and Demand zones.

This is one of the best trading systems you need to know. Let’s start from chapter 1 to chapter 4. I believe you will have useful knowledge after reading this series.

Register an Exness account NowGet $1,000 Free for beginners

What are Supply and Demand zones?

Supply and Demand zones are the places where the price drops or rises sharply.

+ The supply zone is where the price falls sharply.

What is the supply zone?

+ On the contrary, the demand zone is where the price increases strongly.

What is the demand zone?

According to the above concept, what you need to focus on is “the price rises or falls sharply”.

Detailed explanation:

Often individual (retail) investors in the market will not be able to make prices rise or fall sharply. Only the Big Boys in the market such as Word Banks, investment funds, and other large organizations in the market can do such a thing like that.

So when the big money flow is activated, it is time for us – retail traders to join the market.

An example of the Supply zone

I will give an example about the Supply zone of the gold price to make it easier for you to understand.

(1) On November 9, 2020, gold was sold off by big funds such as SPDR, ETF… The price dropped by more than $100 (from $1955 to $1,855 in a single trading day). In theory, this is the Supply Zone.

An example of the Supply zone

(2) On January 5, 2021, gold price returned to the $1955 zone, entered the previous Supply zone and dropped dramatically again.

When the price returns to the supply zone, it will drop again

Detailed explanation:

You can understand it like this. Suppose a trading fund executes an order to sell gold for about 1 thousand lots from the range of $1960 to $1940. This trading order will be split and matched on the market. When the price drops sharply below the 1940$ zone, the fund’s remaining sell orders will be hung in the market as pending ones which are called “Unfilled Orders”.

When the gold price rebounds above the 1940$ zone, these unfilled orders will be triggered and push the gold price down again.

Summary

To trade with the Supply and Demand zones, you have to identify these zones first. Then wait for the price to retest them and open orders. SELL in the Supply zone and BUY in the Demand zone.

The idea of trading with the Supply and Demand zones

In the following article, we will learn how to identify the Supply and Demand zones and how to trade with them.

Register an Exness account NowGet $1,000 Free for beginners

The post What Are Supply and Demand Zones? The Idea Of This Strategy? (Chapter 1) appeared first on How To Trade Blog.


source https://howtotradeblog.com/what-are-supply-and-demand-zones/