Friday, October 15, 2021

How To Use Trend Trading With Supply And Demand zones (Chapter 3)

I write this article from my own experience after practicing trend trading with Supply and Demand zones for months. Hope you can gain more knowledge after trading this strategy. In this chapter, I will guide you on how to enter orders and the reason behind them. And the real trading orders will be in chapter 4.

Register an Exness account NowGet $1,000 Free for beginners

Conditions of the strategy

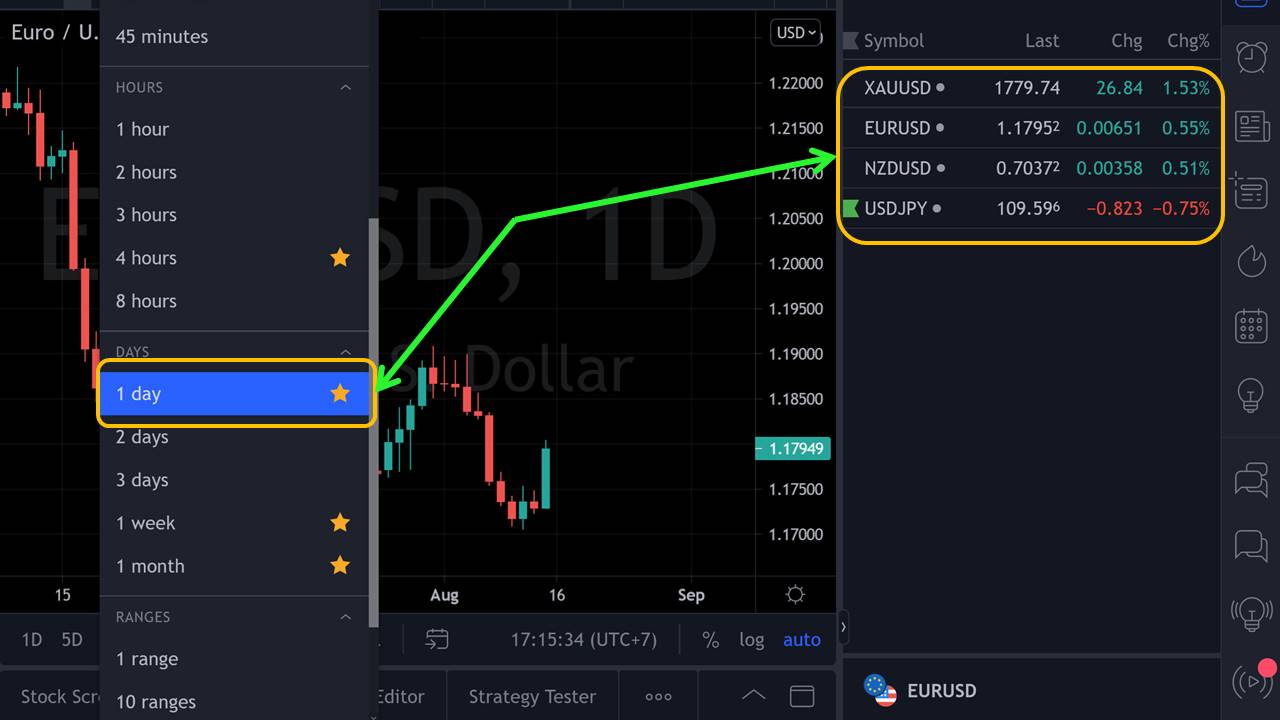
– I use the daily chart to analyze and predict the price because I'm not a day trader. I don't focus 100% of my time on making money in the markets. So I use the daily chart to slow things down. – Some of my favorite currency pairs are USD/JPY, EUR/USD, NZD/USD, GOLD (XAU/USD). Because everyone has their strengths, I'm only focusing on a few currency pairs that I understand well. If you’re in favor of the currency pairs above, EUR/JPY or GBP/JPY is also worth a try. [caption id="attachment_16587" align="aligncenter" width="1280"]Trading conditions for Trend and Supply Demand strategy Trading conditions for Trend and Supply Demand strategy[/caption] - I manage money according to the Risk/Reward ratio (R/R). There is a specific guide below to help you set up Stop Loss (SL) and Take Profit (TP). If you still don’t understand the uptrend and downtrend clearly, please read the two articles below. + What is an uptrend? How to trade Forex effectively in an uptrend. + What is a downtrend in Forex? How to trade Forex with a downtrend. – We will trade with 2 steps: + Step 1: Identify the main Trend and Supply and Demand zones created by the market. + Step 2: Wait for the price to retest the Supply or Demand zone and enter an order. In an uptrend, we’ll BUY. On the contrary, we’ll SELL in a downtrend.
Detailed guide on how to trade

BUY order

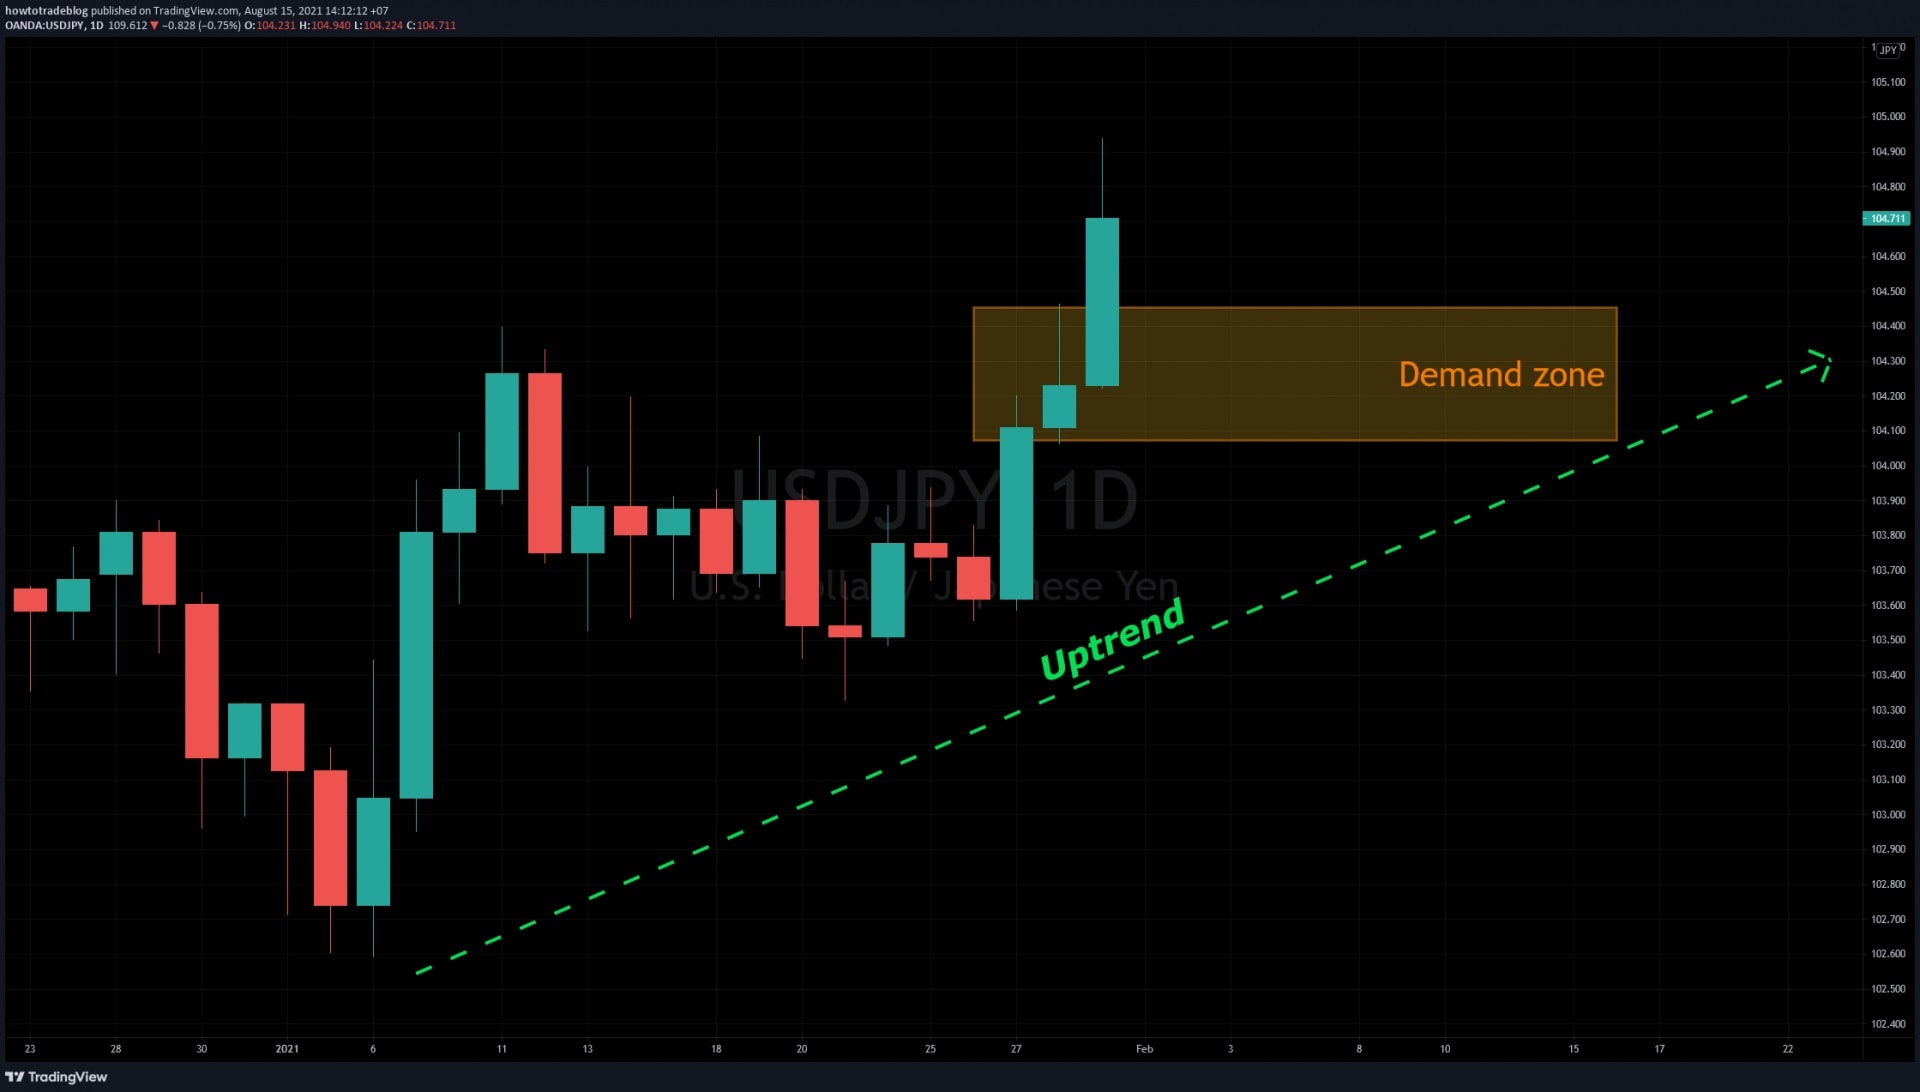
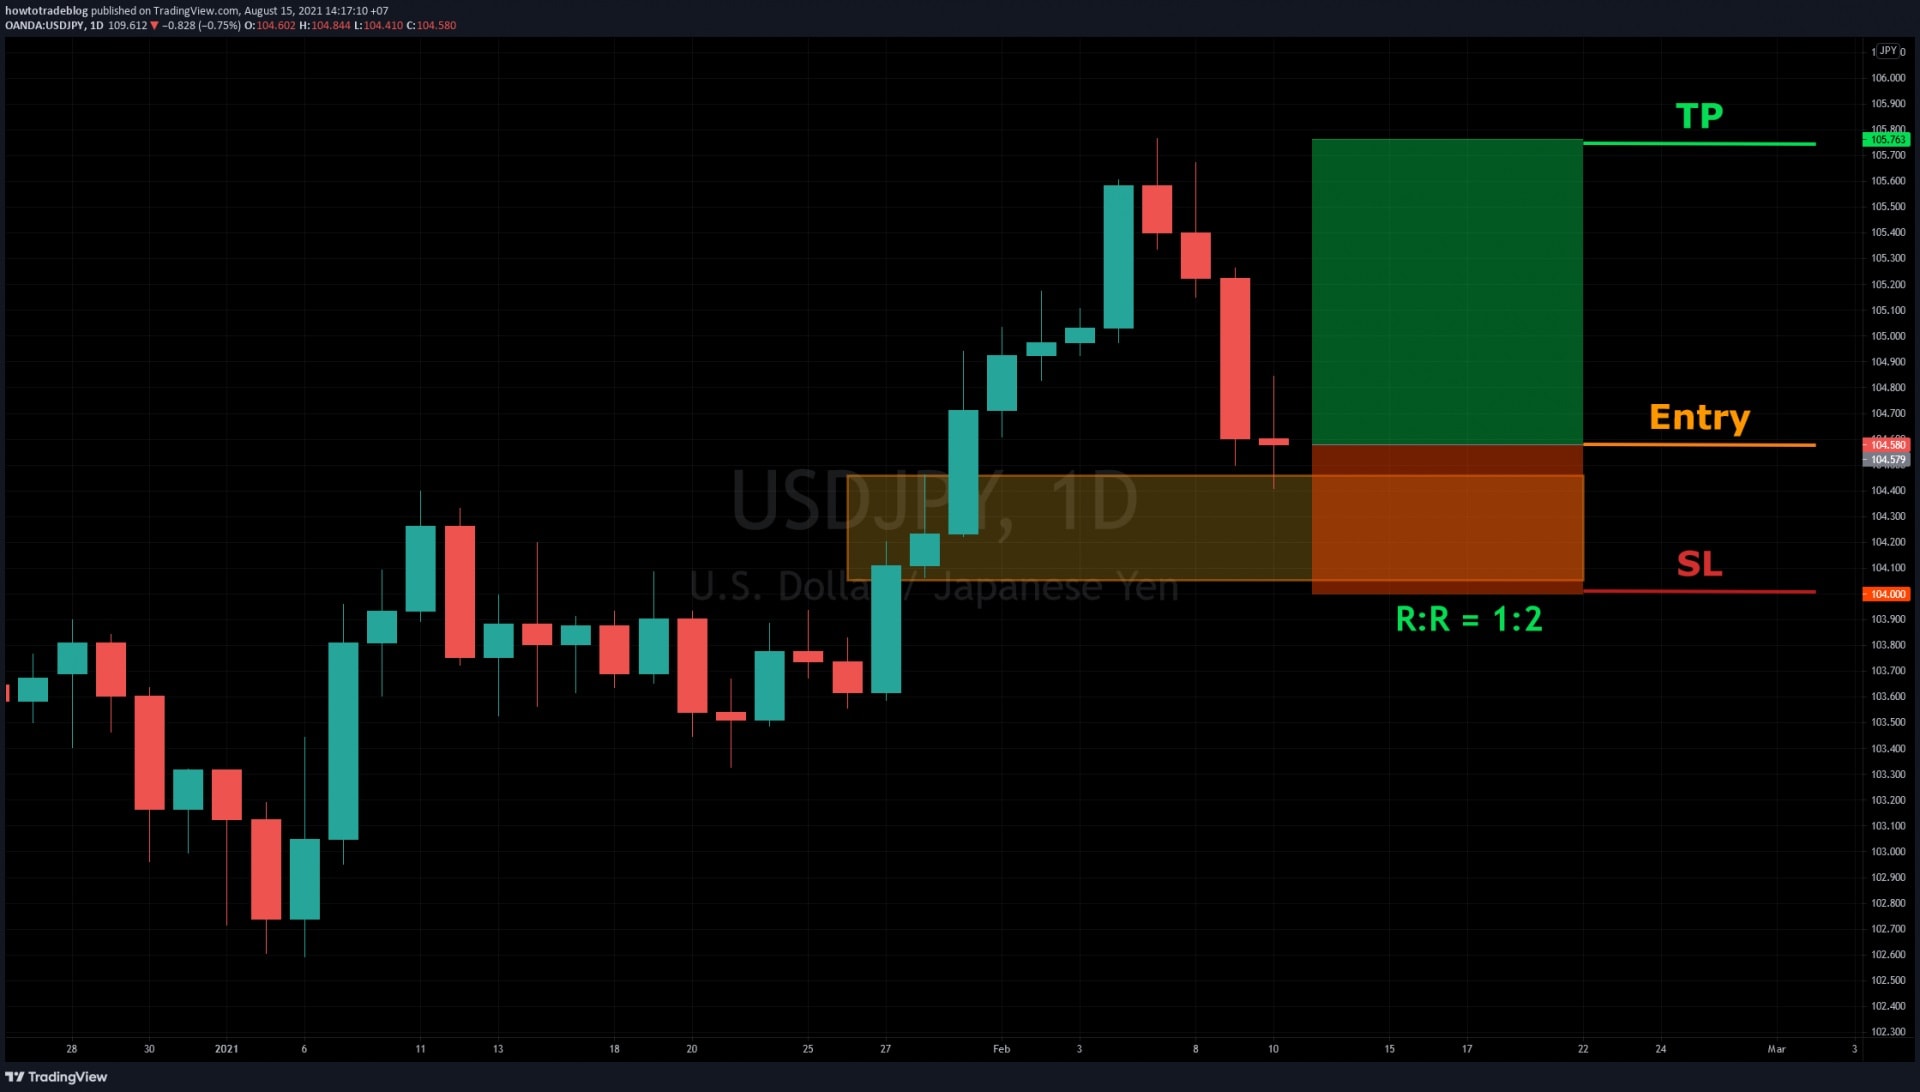
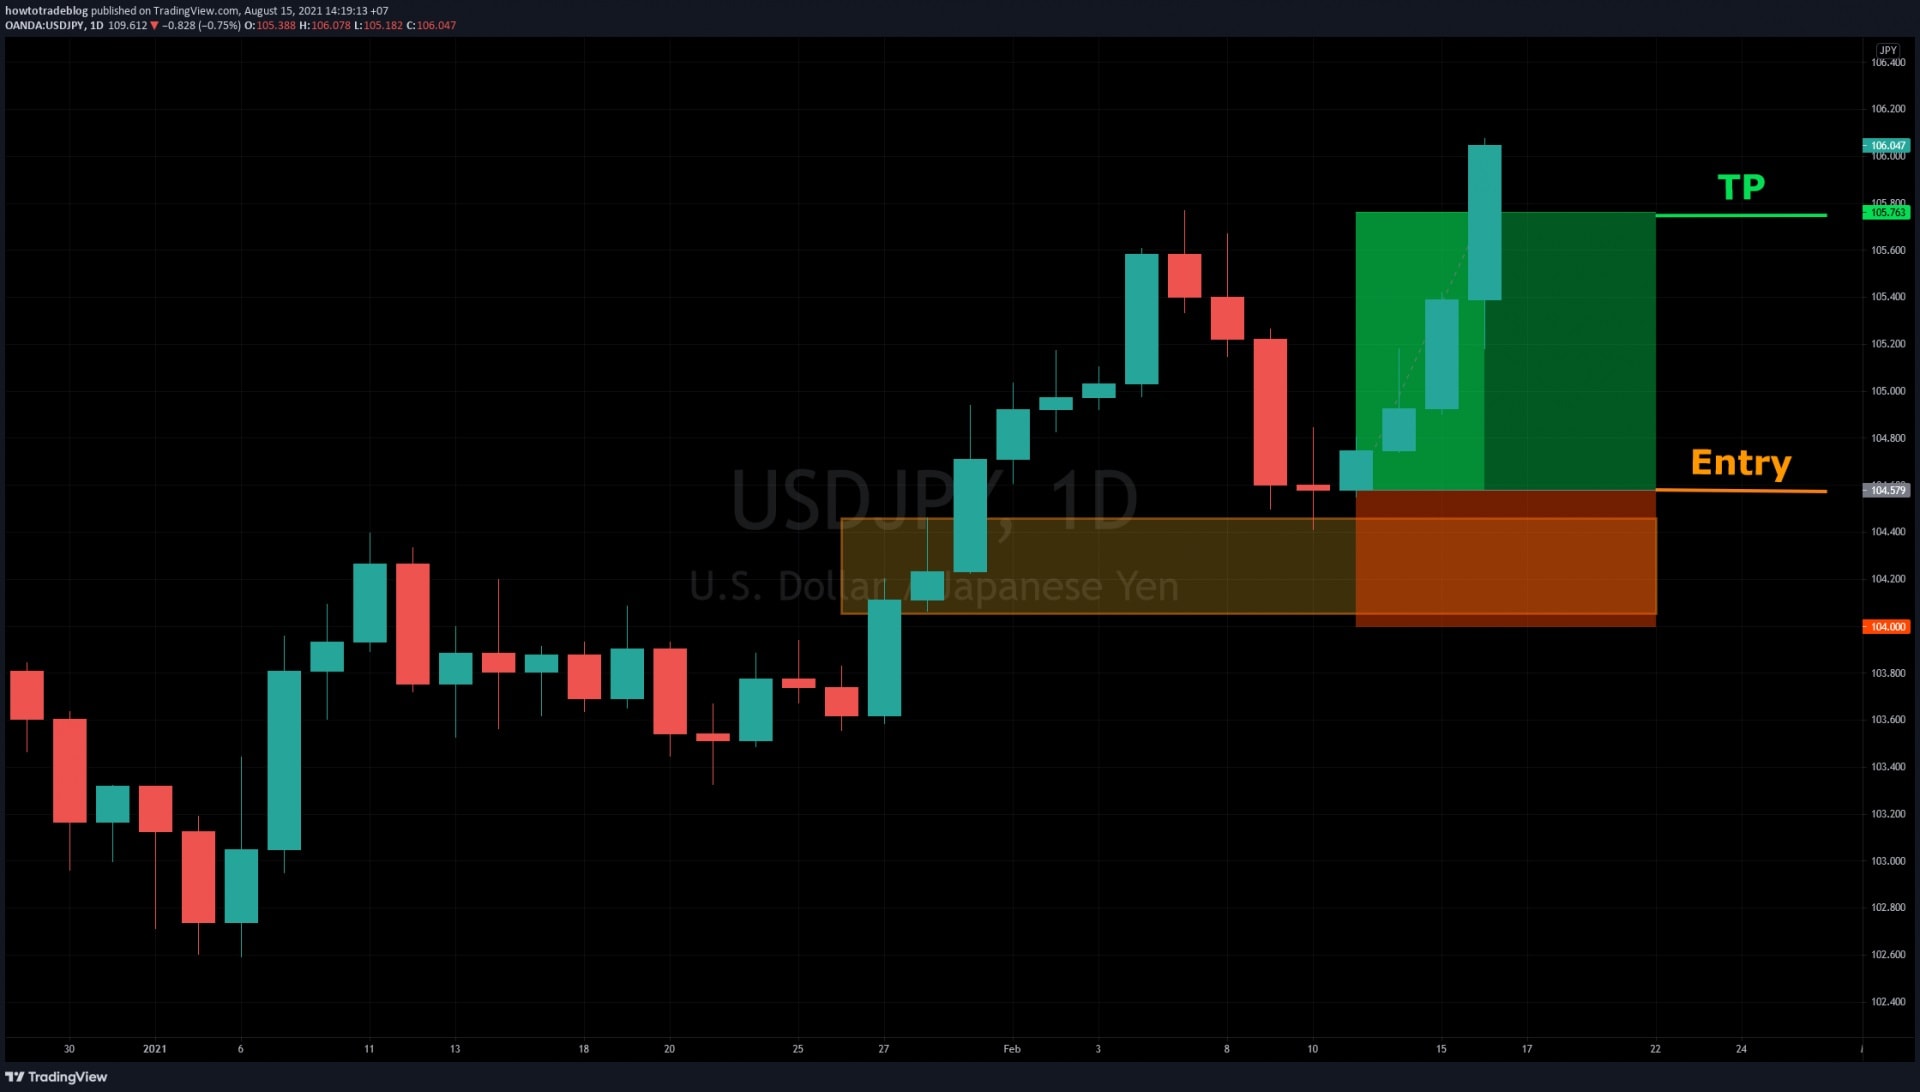
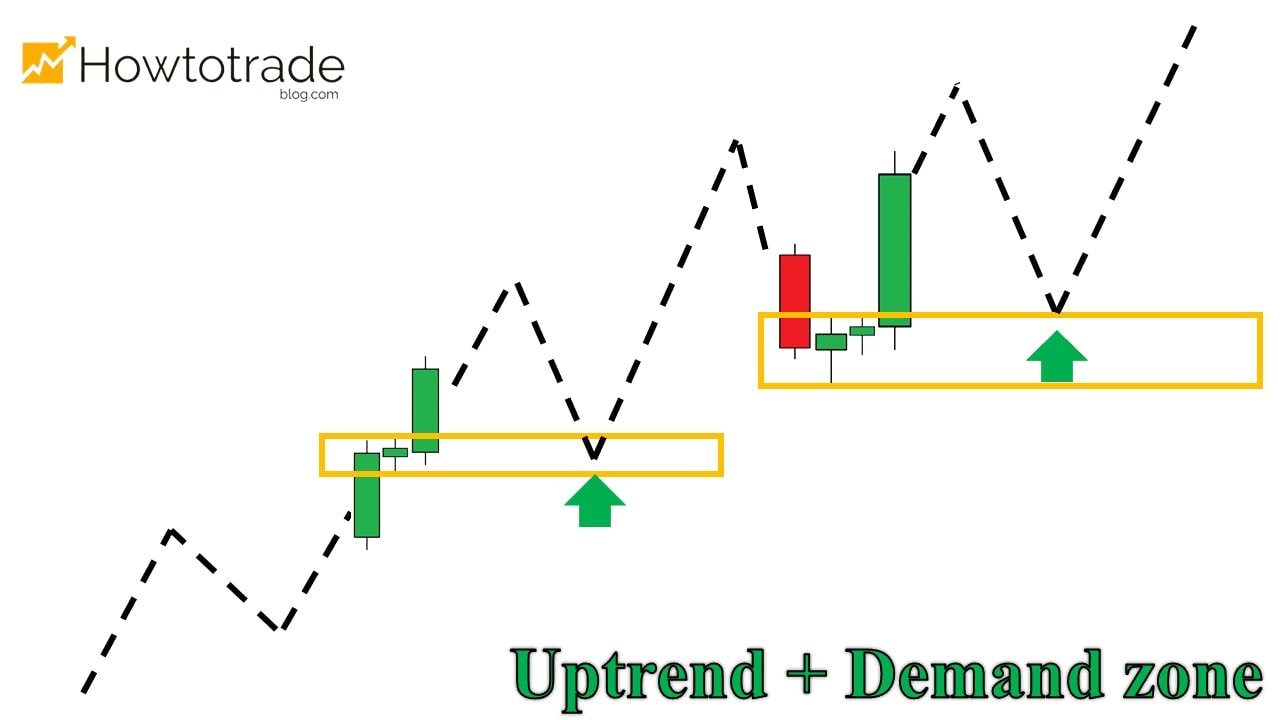
First, you need to identify the Uptrend and the Demand Zone. The theory goes like this. During the increasing process in an uptrend, the market will create demand zones. We will open BUY orders in these zones. [caption id="attachment_16588" align="aligncenter" width="1280"]How to enter BUY orders How to enter BUY orders[/caption] For detailed example with USD/JPY (from January 27, 2021 to February 17, 2021) The USD/JPY entered an uptrend period. Identified and drew the Demand zone on the chart (yellow area). My job was to wait for the price to come back and retest this zone and open a BUY order. [caption id="attachment_16589" align="aligncenter" width="1920"]Identify the Demand zone in the Uptrend Identify the Demand zone in the Uptrend[/caption] The price retested the Demand zone that I drew and created a trading signal with a Doji candlestick. + Opened a BUY order right away. + Set the SL below the Demand zone. + Set the TP at the previous top. [caption id="attachment_16590" align="aligncenter" width="1920"]Open a BUY trade Open a BUY trade[/caption] The price bounced back to the TP point. In this trade, I won 2R. [caption id="attachment_16591" align="aligncenter" width="1920"]A nice result with 2R profit A nice result with 2R profit[/caption]
SELL order

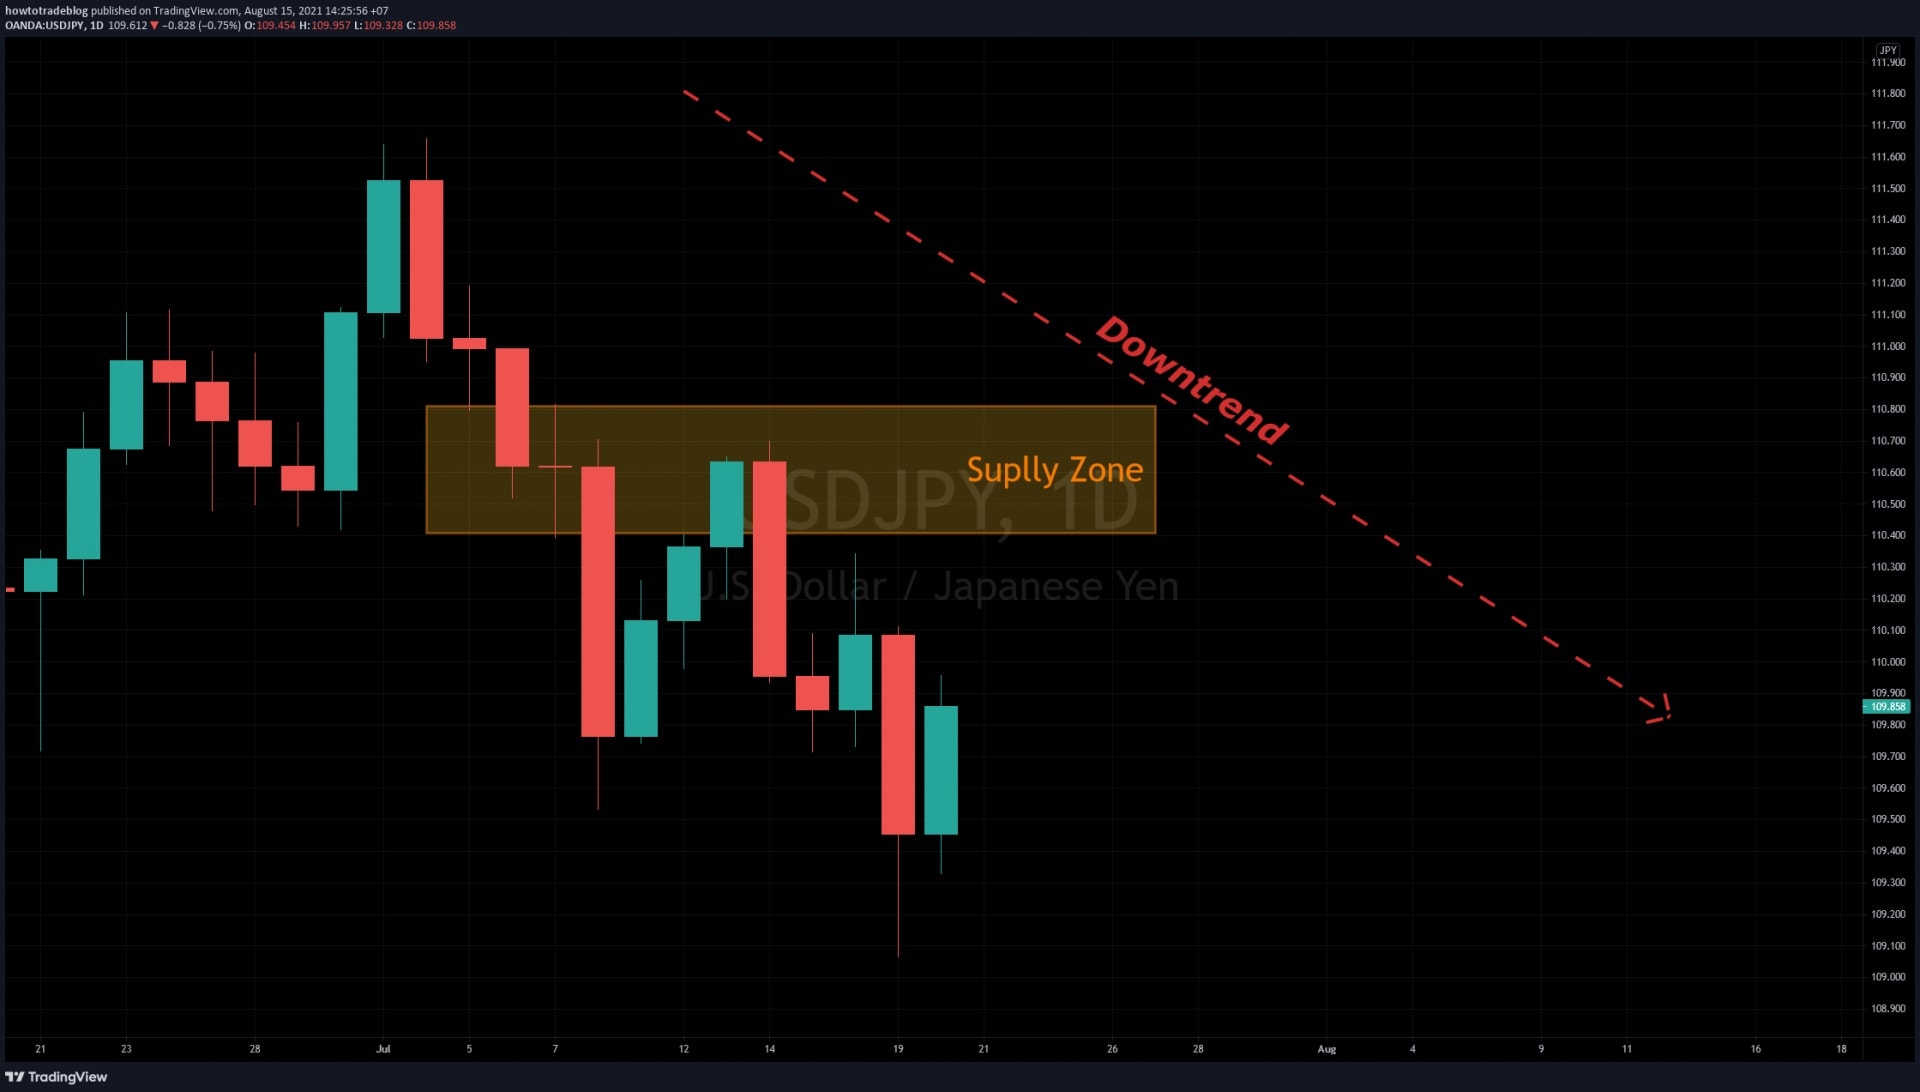
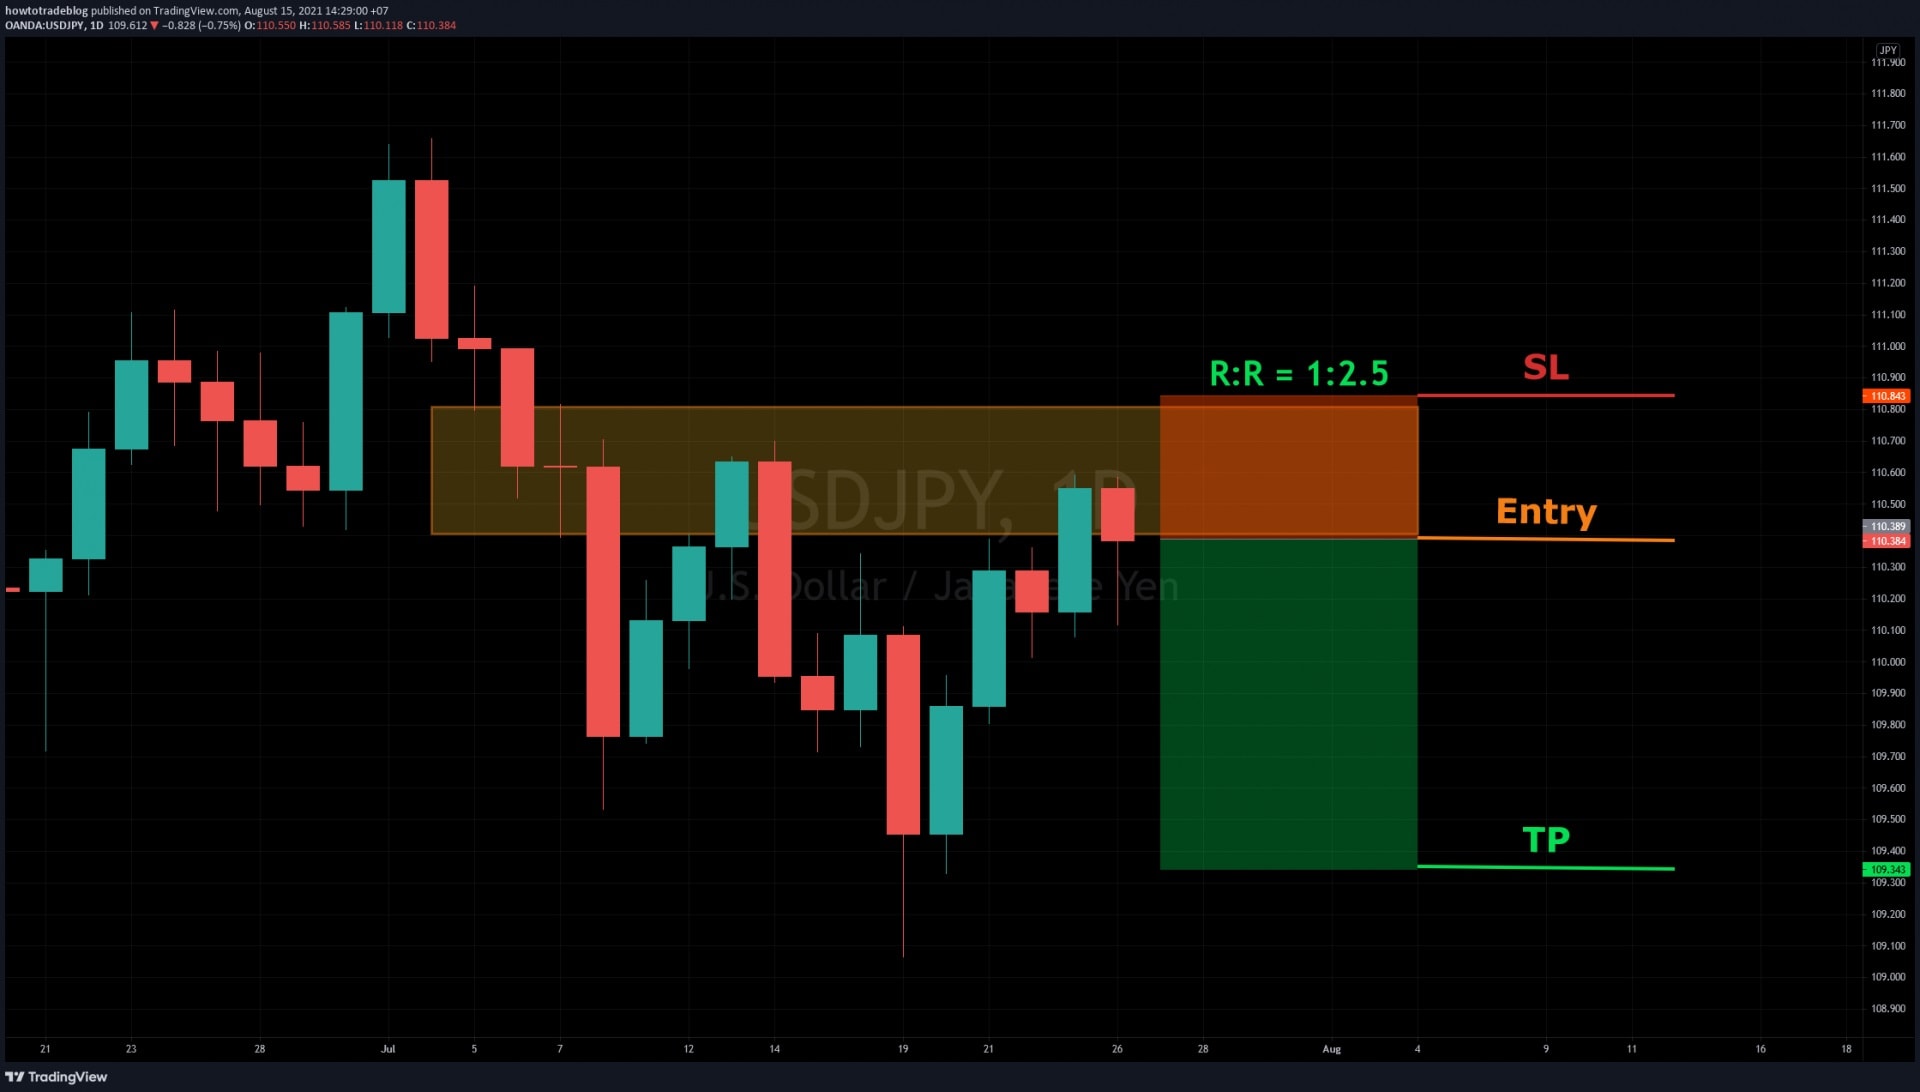
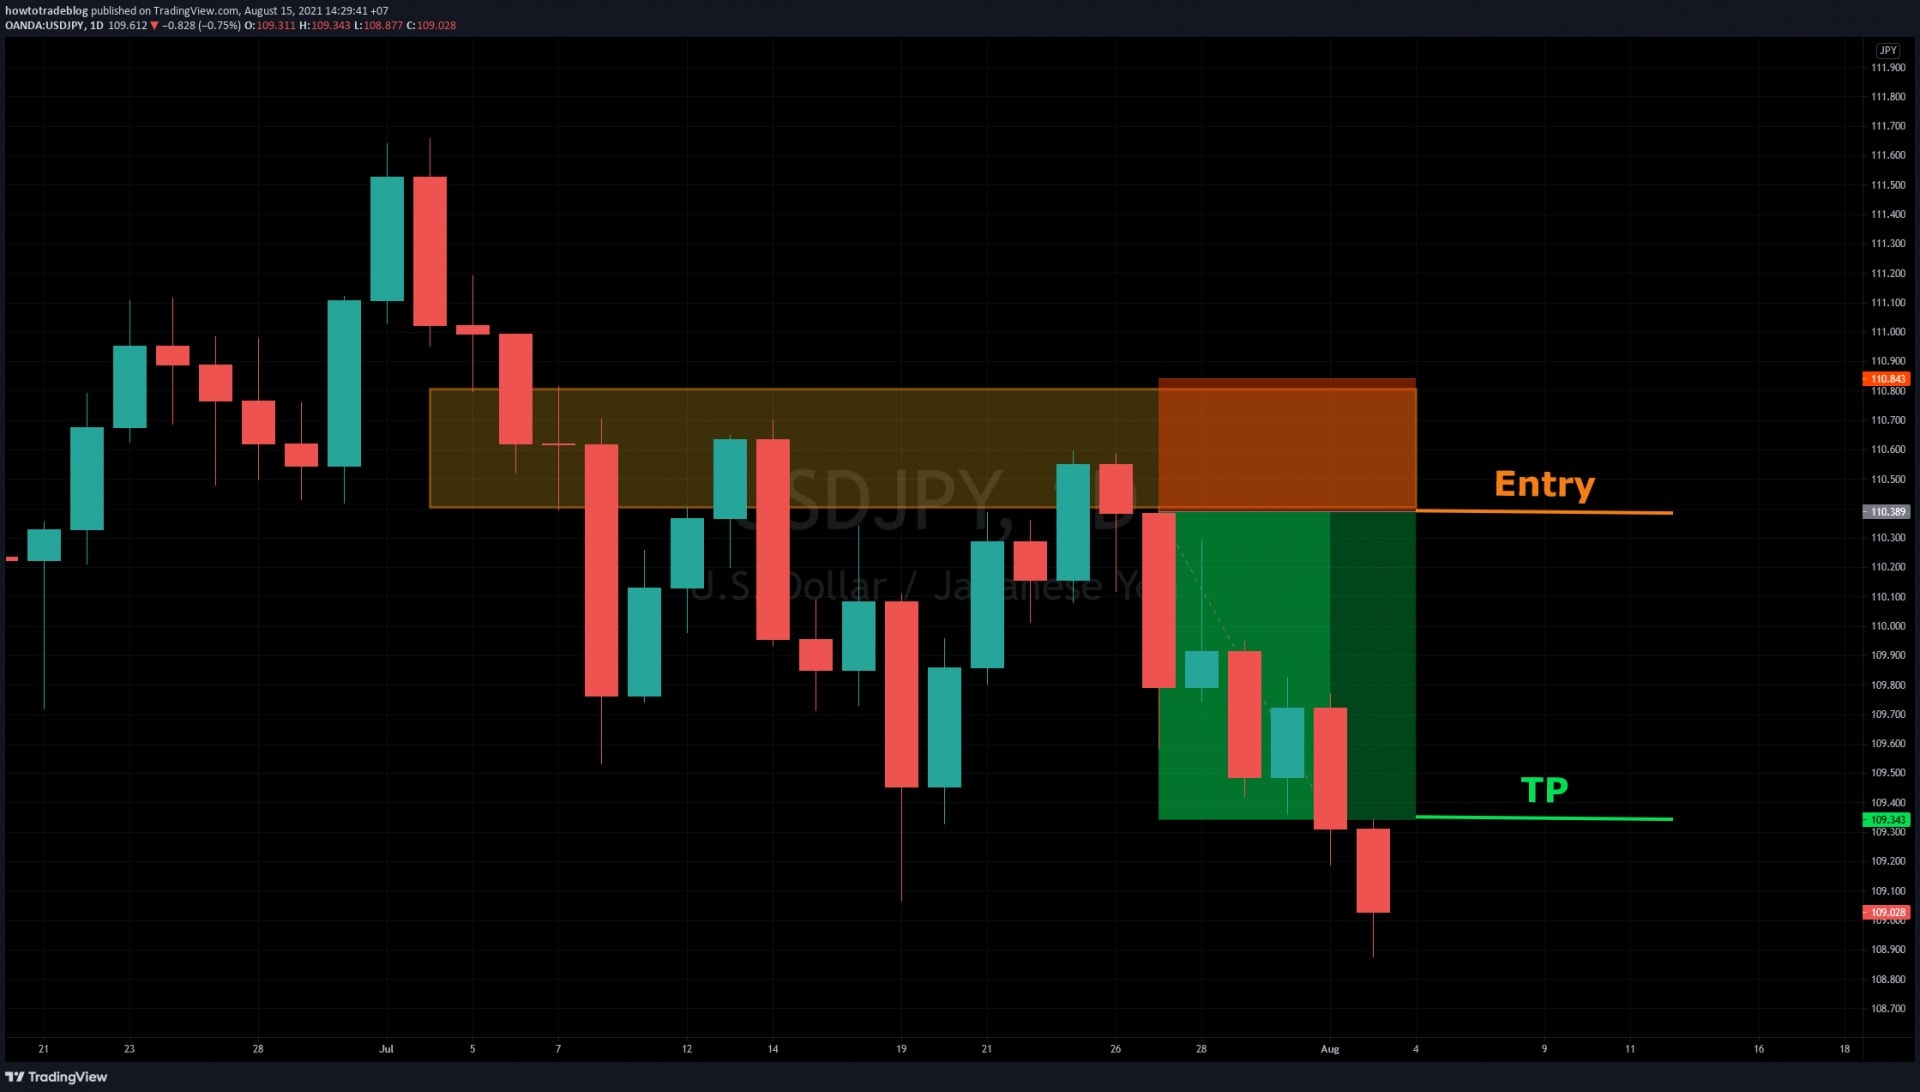
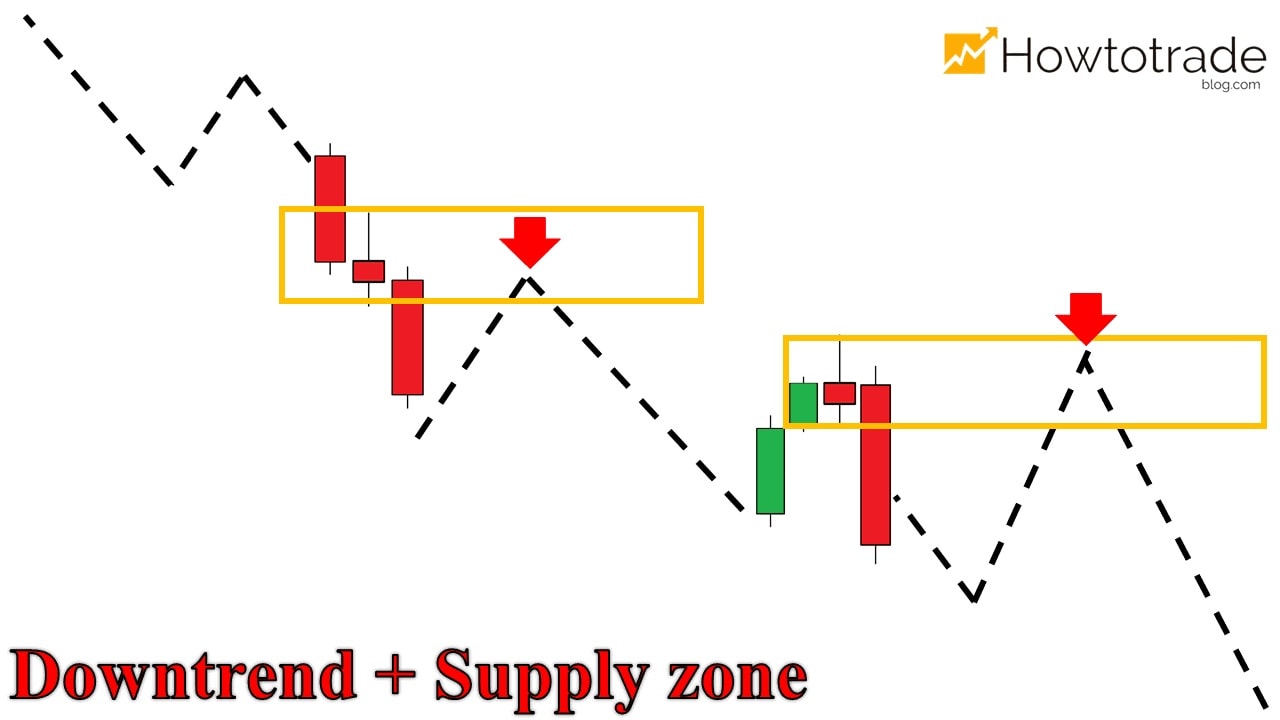
In theory, the price keeps falling and enters a Downtrend. Identify the Supply zones that the market has created. Wait for the signal to open the SELL order. [caption id="attachment_16592" align="alignnone" width="1280"]How to open SELL orders How to open SELL orders[/caption] For specific example with USD/JPY (from July 5, 2021 to August 5, 2021) USD/JPY was in a downtrend. This decreasing process created the Supply Zone (yellow area) on the chart. This was the main zone I waited for a SELL order. [caption id="attachment_16593" align="aligncenter" width="1920"]Identify the Supply zone in a downtrend Identify the Supply zone in a downtrend[/caption] The price moved back to the Supply zone and showed signs of reversal. + Entered a SELL order here. + Set the SL above the Supply zone. + Set the TP at the previous bottom. [caption id="attachment_16594" align="aligncenter" width="1920"]Enter a SELL order in the Supply zone Enter a SELL order in the Supply zone[/caption] Result: This SELL order has reached the TP with 2.5R. [caption id="attachment_16595" align="aligncenter" width="1920"]Sell order results with 2.5R profit Sell order results with 2.5R profit[/caption]
The lessons I draw after using Trend trading and Supply Demand

Trend is the most important

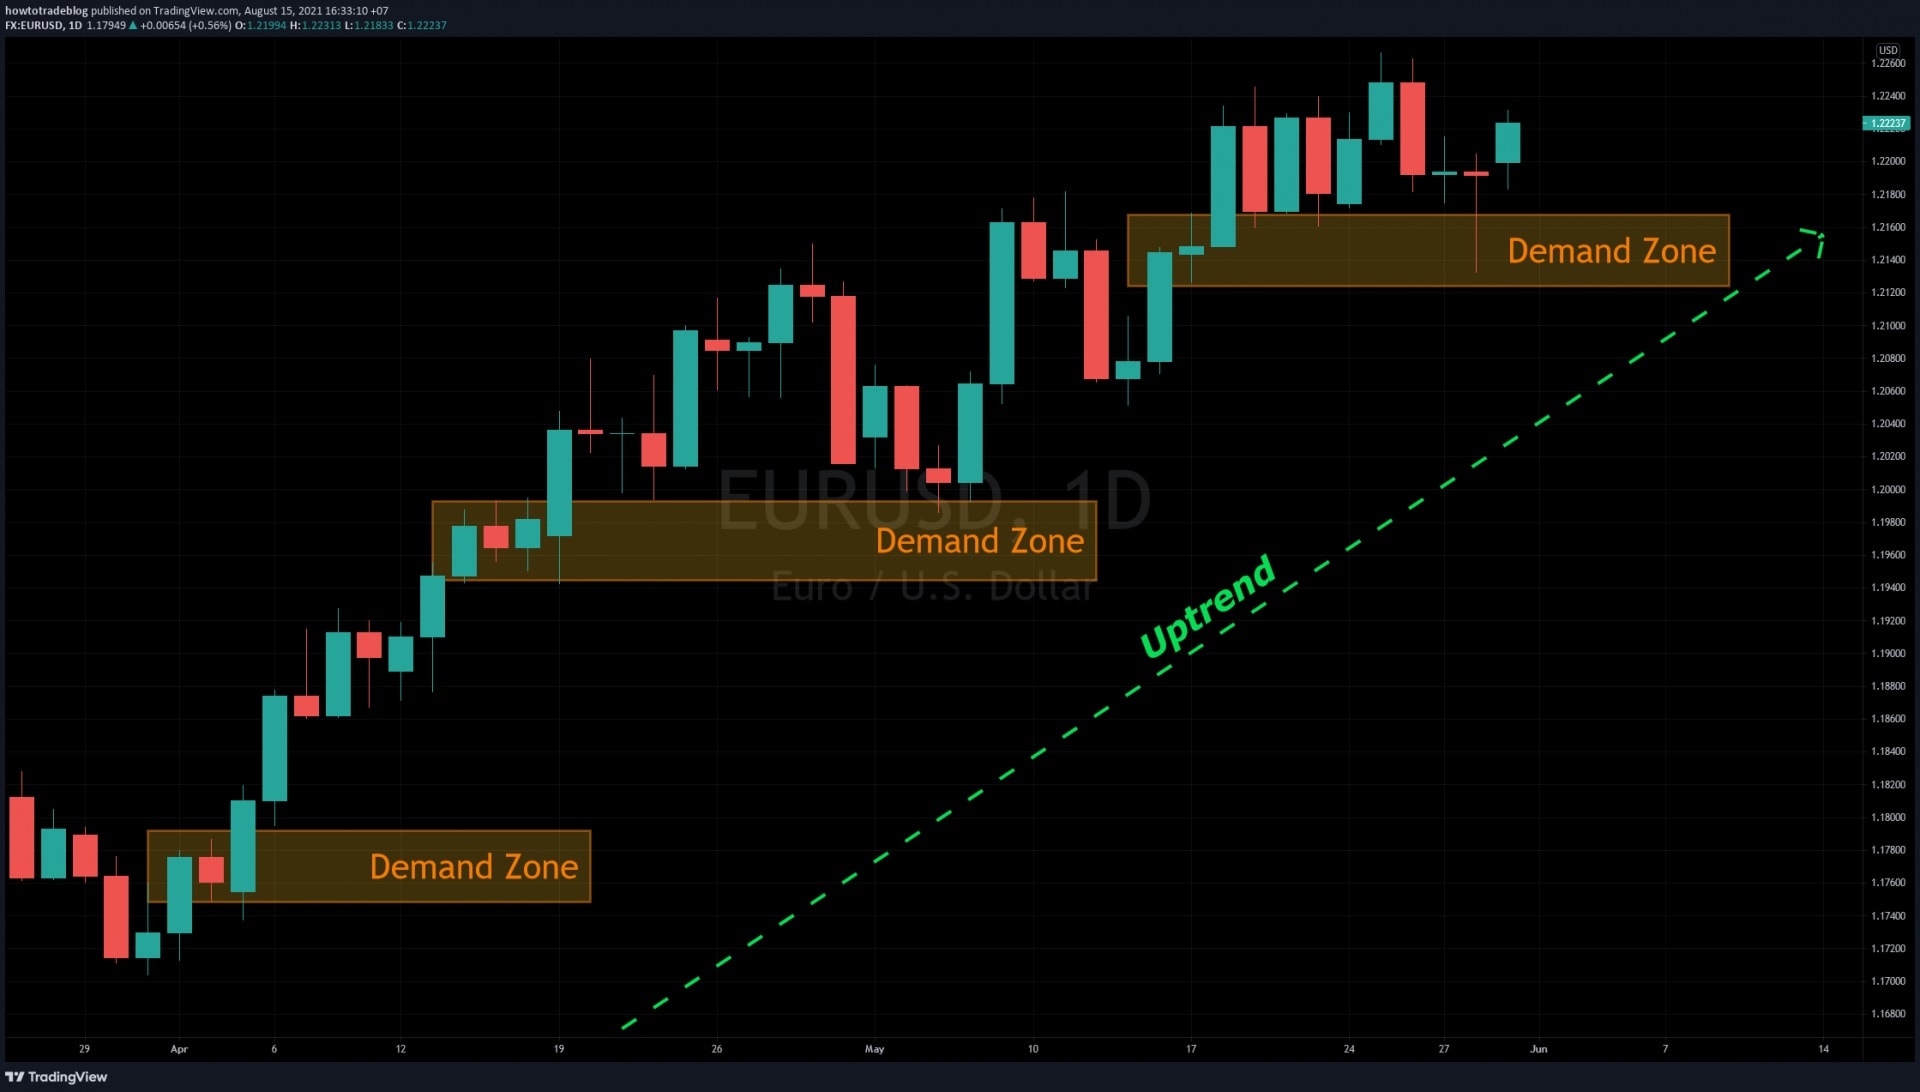
Remember that the main trend of the market is the first thing you should pay attention to. Then come to the Supply and Demand zones. If it is Uptrend, find the Demand zone. Conversely, in the downtrend, you focus on the Supply zone. [caption id="attachment_16596" align="aligncenter" width="1920"]Identifying the main trend of the market is the top priority Identifying the main trend of the market is the top priority[/caption]
Trading signals

Balanced candlesticks like Doji in the Supply Demand zone are good signals for you to consider opening an order. We will discuss this in detail on the next chapter. When the market has no good signal for you to BUY or SELL at the Supply and Demand zones, ignore it. Be patient to wait for a really nice one. Do not rush because you will always have another chance.

The signal when Supply and Demand zones could be broken

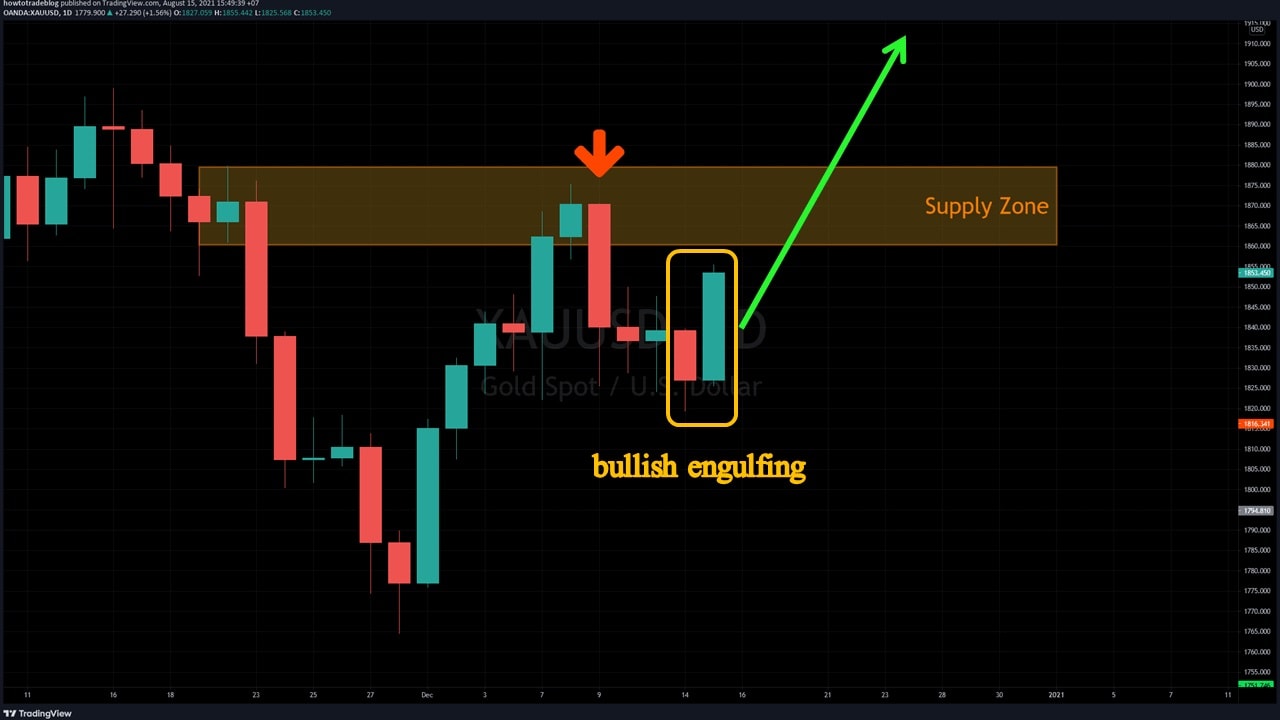
Be careful with the Engulfing candlestick pattern or the inverted Pin Bar candlesticks. When the above signals appear, you can consider closing the order. [caption id="attachment_16597" align="aligncenter" width="1280"]The signal when Supply and Demand zones could be broken The signal when Supply and Demand zones could be broken[/caption]
How long do the Supply and Demand zones become meaningless?

In theory with the daily chart, if the market does not return to the Supply or Demand zone within 1 month, that zone will become meaningless. But in reality and my opinion, we will have a plan to execute orders according to how the market reacts.

Swap between Supply and Demand

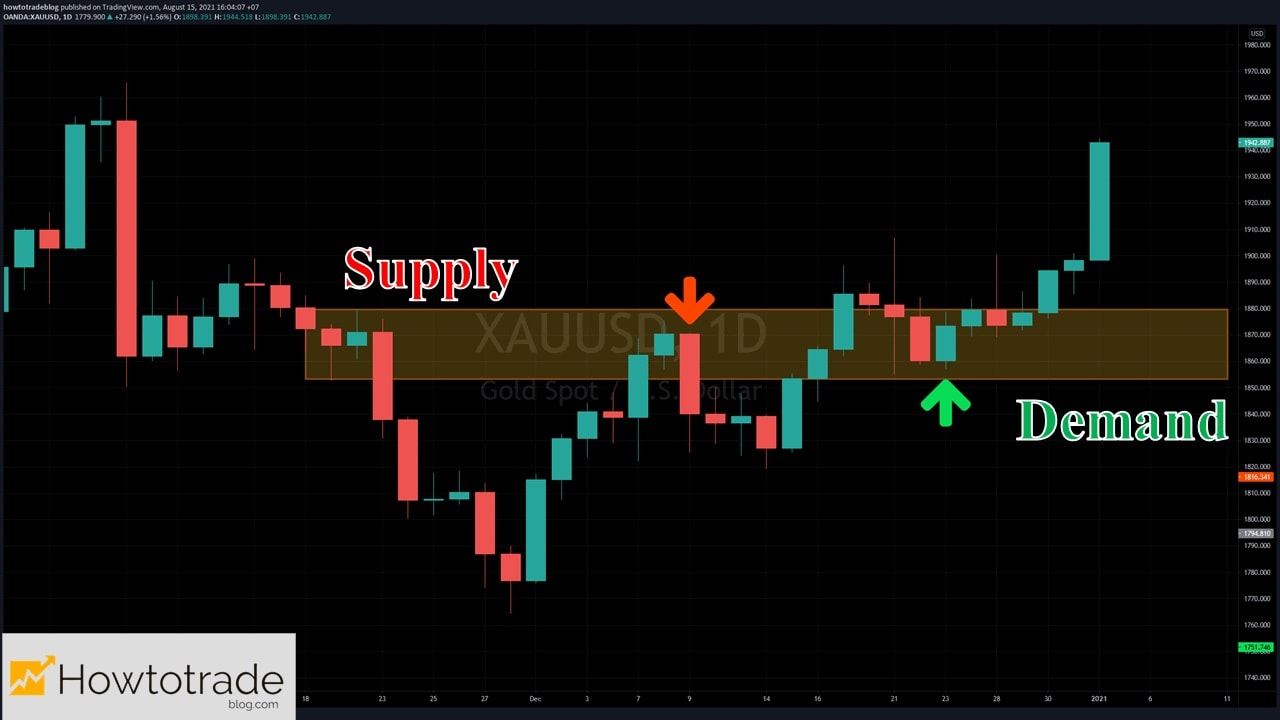
When the Supply zone is broken, it will change its role to the Demand zone and vice versa. This is quite similar to the support and resistance. [caption id="attachment_16598" align="aligncenter" width="1280"]Swap between Supply and Demand Swap between Supply and Demand[/caption]
Conclusion

So we have finished the Trend + Supply/Demand strategy. Please read it again and practice on the Tradingview basic account. Don’t worry. The basic account is completely free. I will continue to show how to trade Forex and Gold for real on MT4 in the next article. There will be a detailed analysis together with trading psychology too. Please wait for it.

How To Identify And Trade With Supply And Demand Zones (Chapter 2)

In this article, I will present 2 main topics. – Instructions on how to identify a Supply or Demand zone. – How to BUY/SELL, how to set Stop Loss, Take Profit with them in Forex trading. If you do not know what Supply and Demand zones are, you can read this article: What Are Supply and Demand Zones? The Idea Of This Strategy? Ok! Now let's go through each part so you can fully understand the strategy.

Register an Exness account NowGet $1,000 Free for beginners

How to identify the basic Supply and Demand zones

Identify the Supply zone

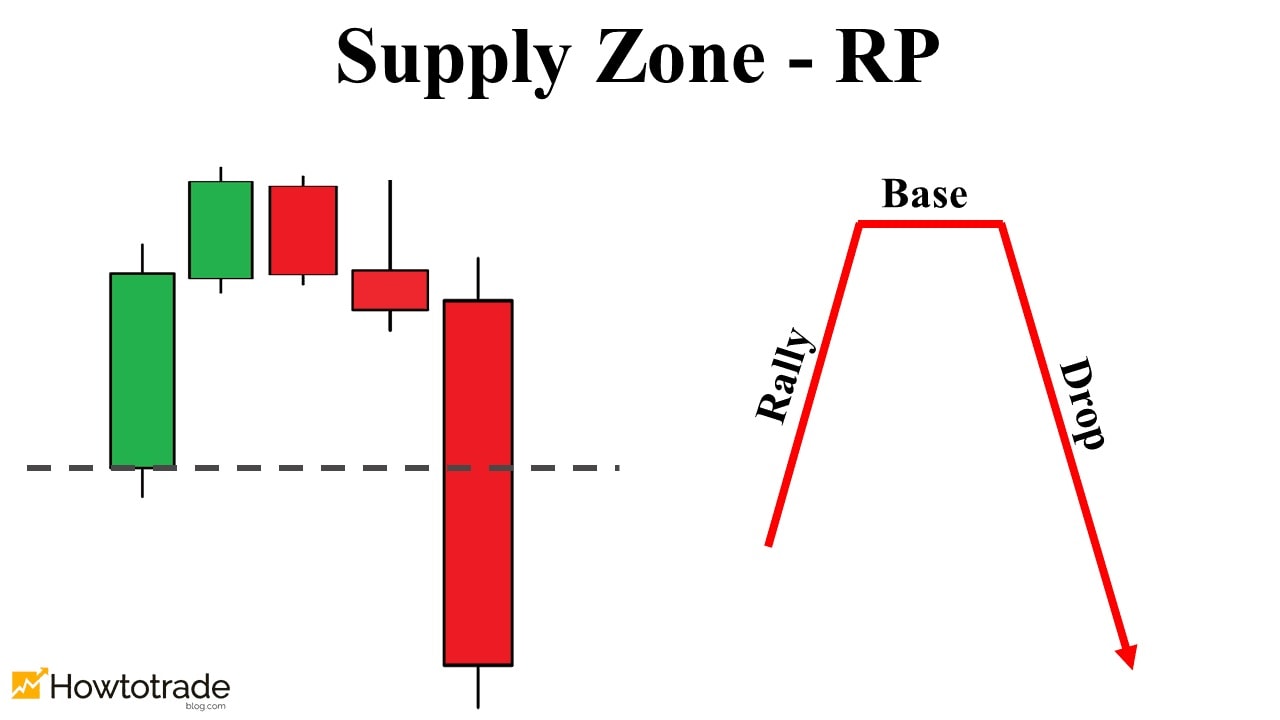
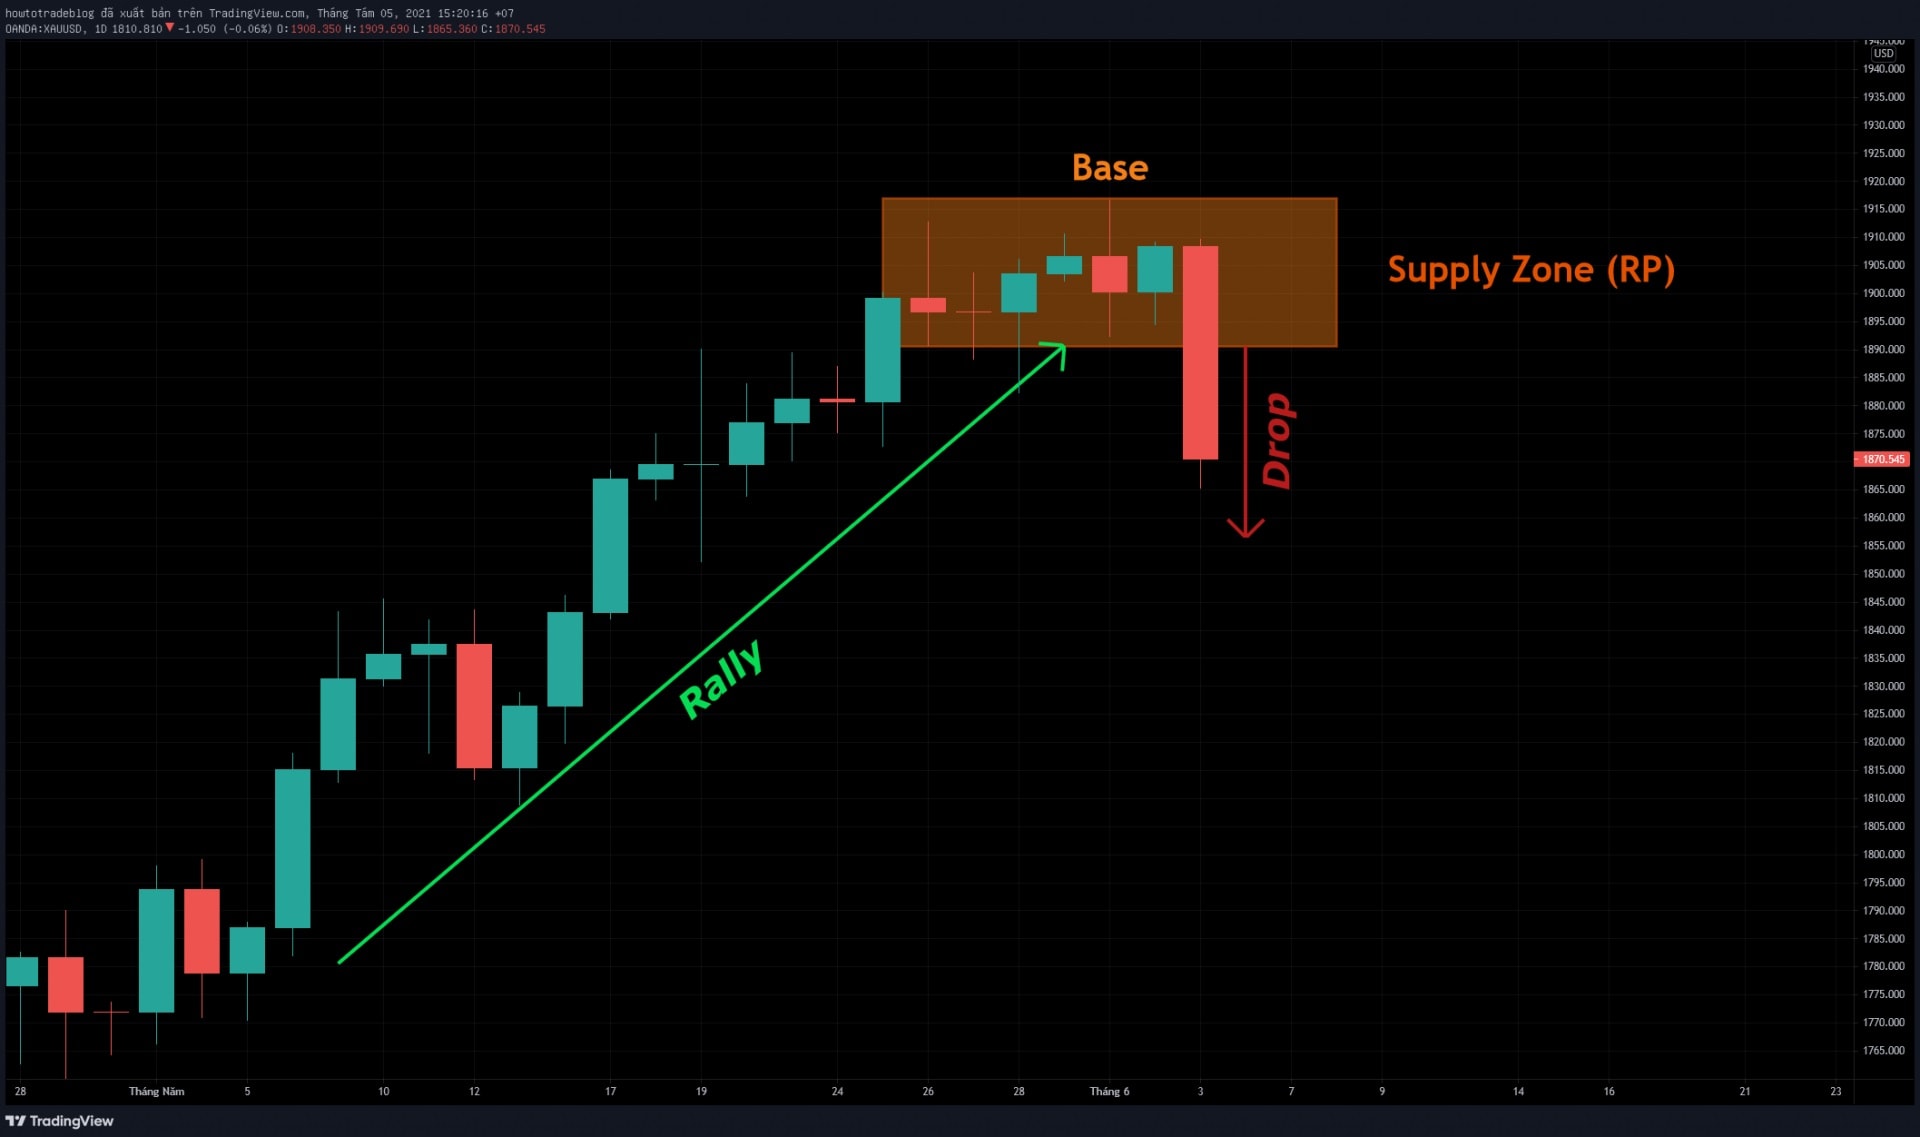
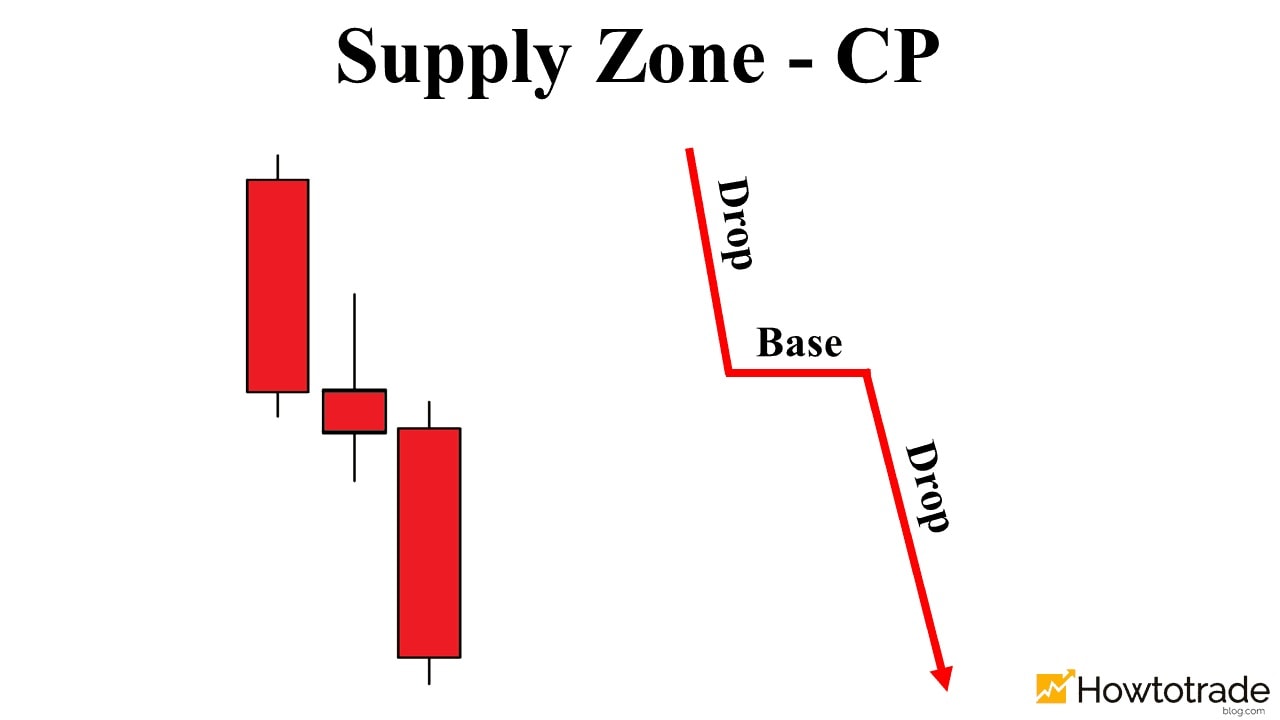
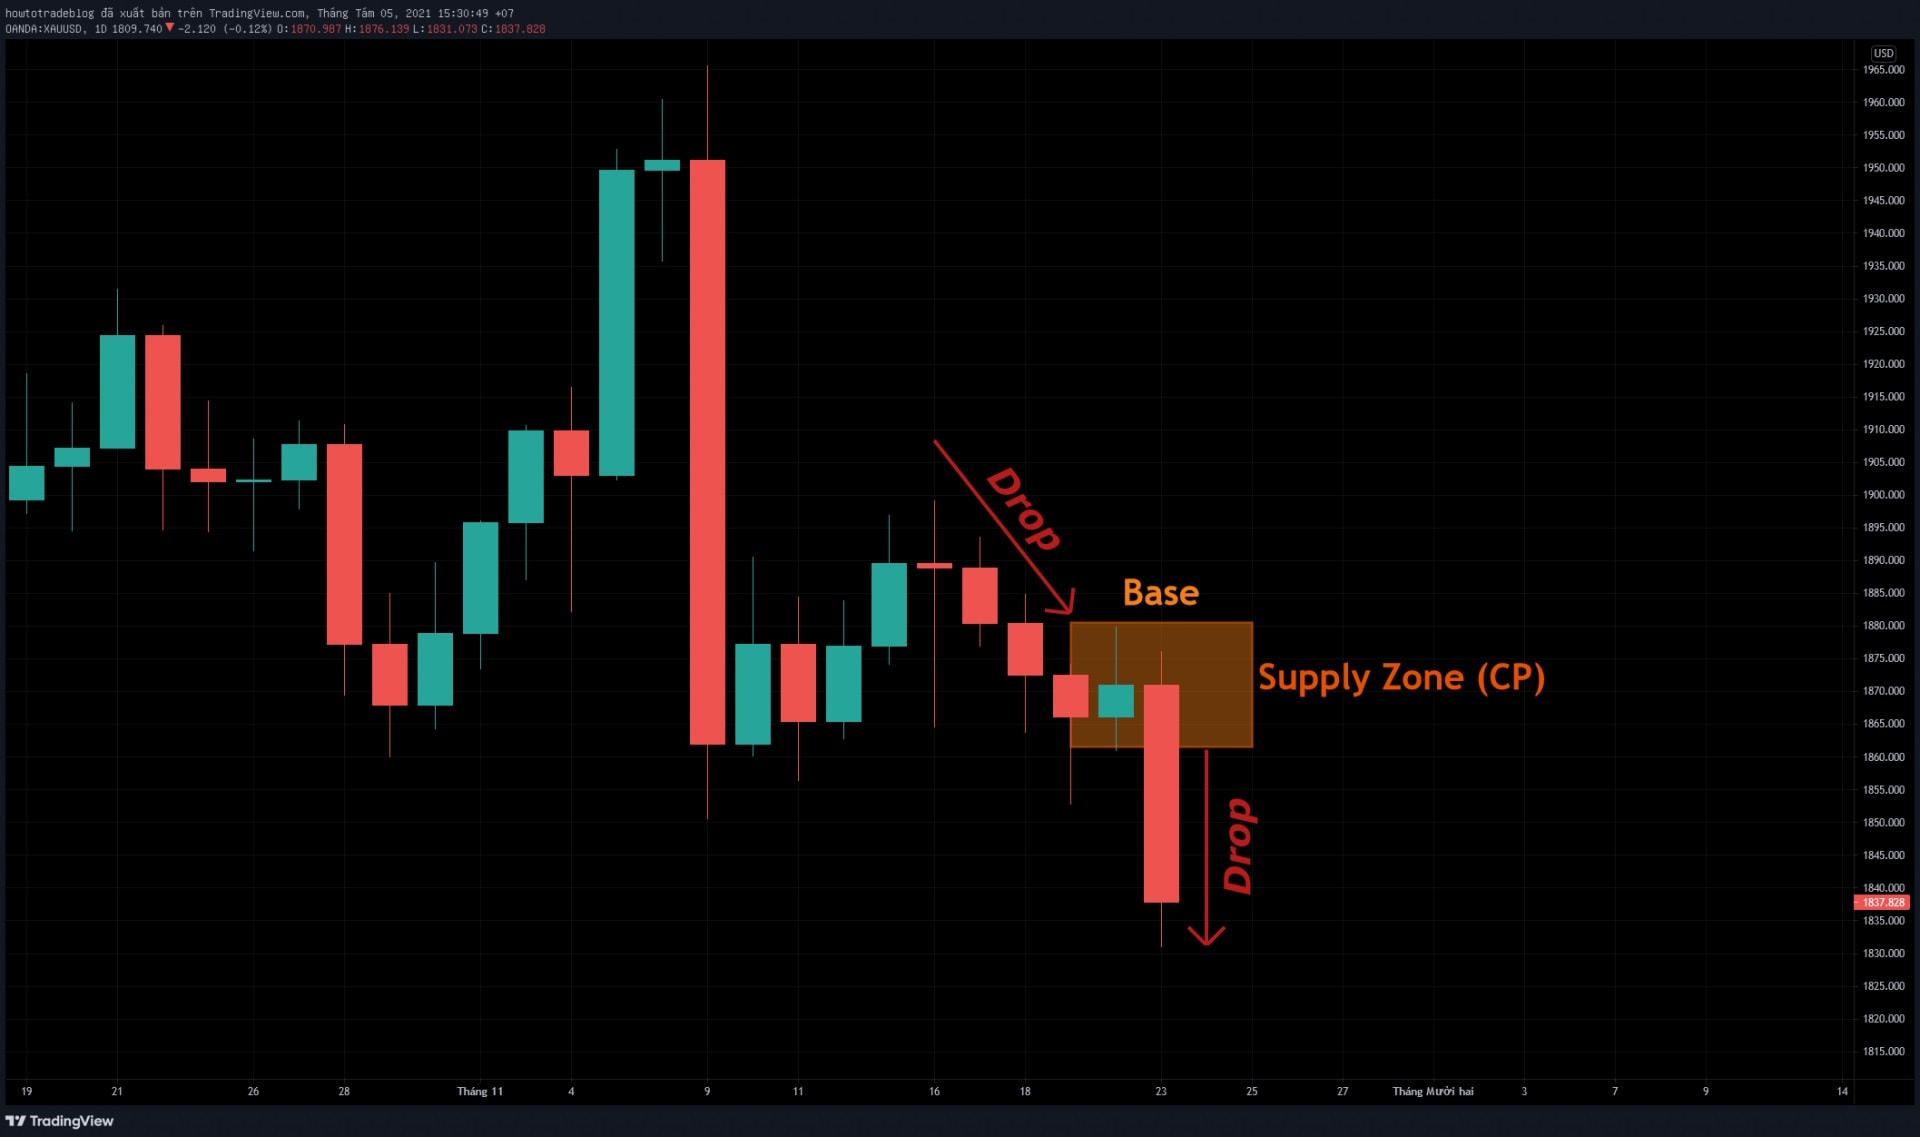
The Supply zone has 2 common patterns: (1) RP – Reversal and (2) CP – Continuation. (1) Reversal pattern (RP): Rally – Base – Drop [caption id="attachment_16529" align="aligncenter" width="1280"]Reversal Supply pattern Reversal Supply pattern[/caption] The price moves sideways after an uptrend and creates a sideways candlestick zone called the Base. Then it falls dramatically with a long body candlestick. This Base is the reversal Supply zone (RP). For example: [caption id="attachment_16530" align="aligncenter" width="1920"]An example of the reversal Supply pattern An example of the reversal Supply pattern[/caption] The 6 candlesticks moving sideways in the image above are the Base. When the gold price falls sharply and creates a red candlestick with a long body, this Base becomes the reversal Supply zone. (2) Continuation pattern (CP): Drop – Base – Drop [caption id="attachment_16531" align="aligncenter" width="1280"]Continuation Supply zone Continuation Supply zone[/caption] The price stops decreasing and creates sideways candlesticks. Then it continues to fall significantly. The sideways zone (Base) in this process will be the Supply zone. Detailed example: [caption id="attachment_16532" align="aligncenter" width="1920"]An example of the continuation Supply pattern An example of the continuation Supply pattern[/caption]
Identify the Demand zone

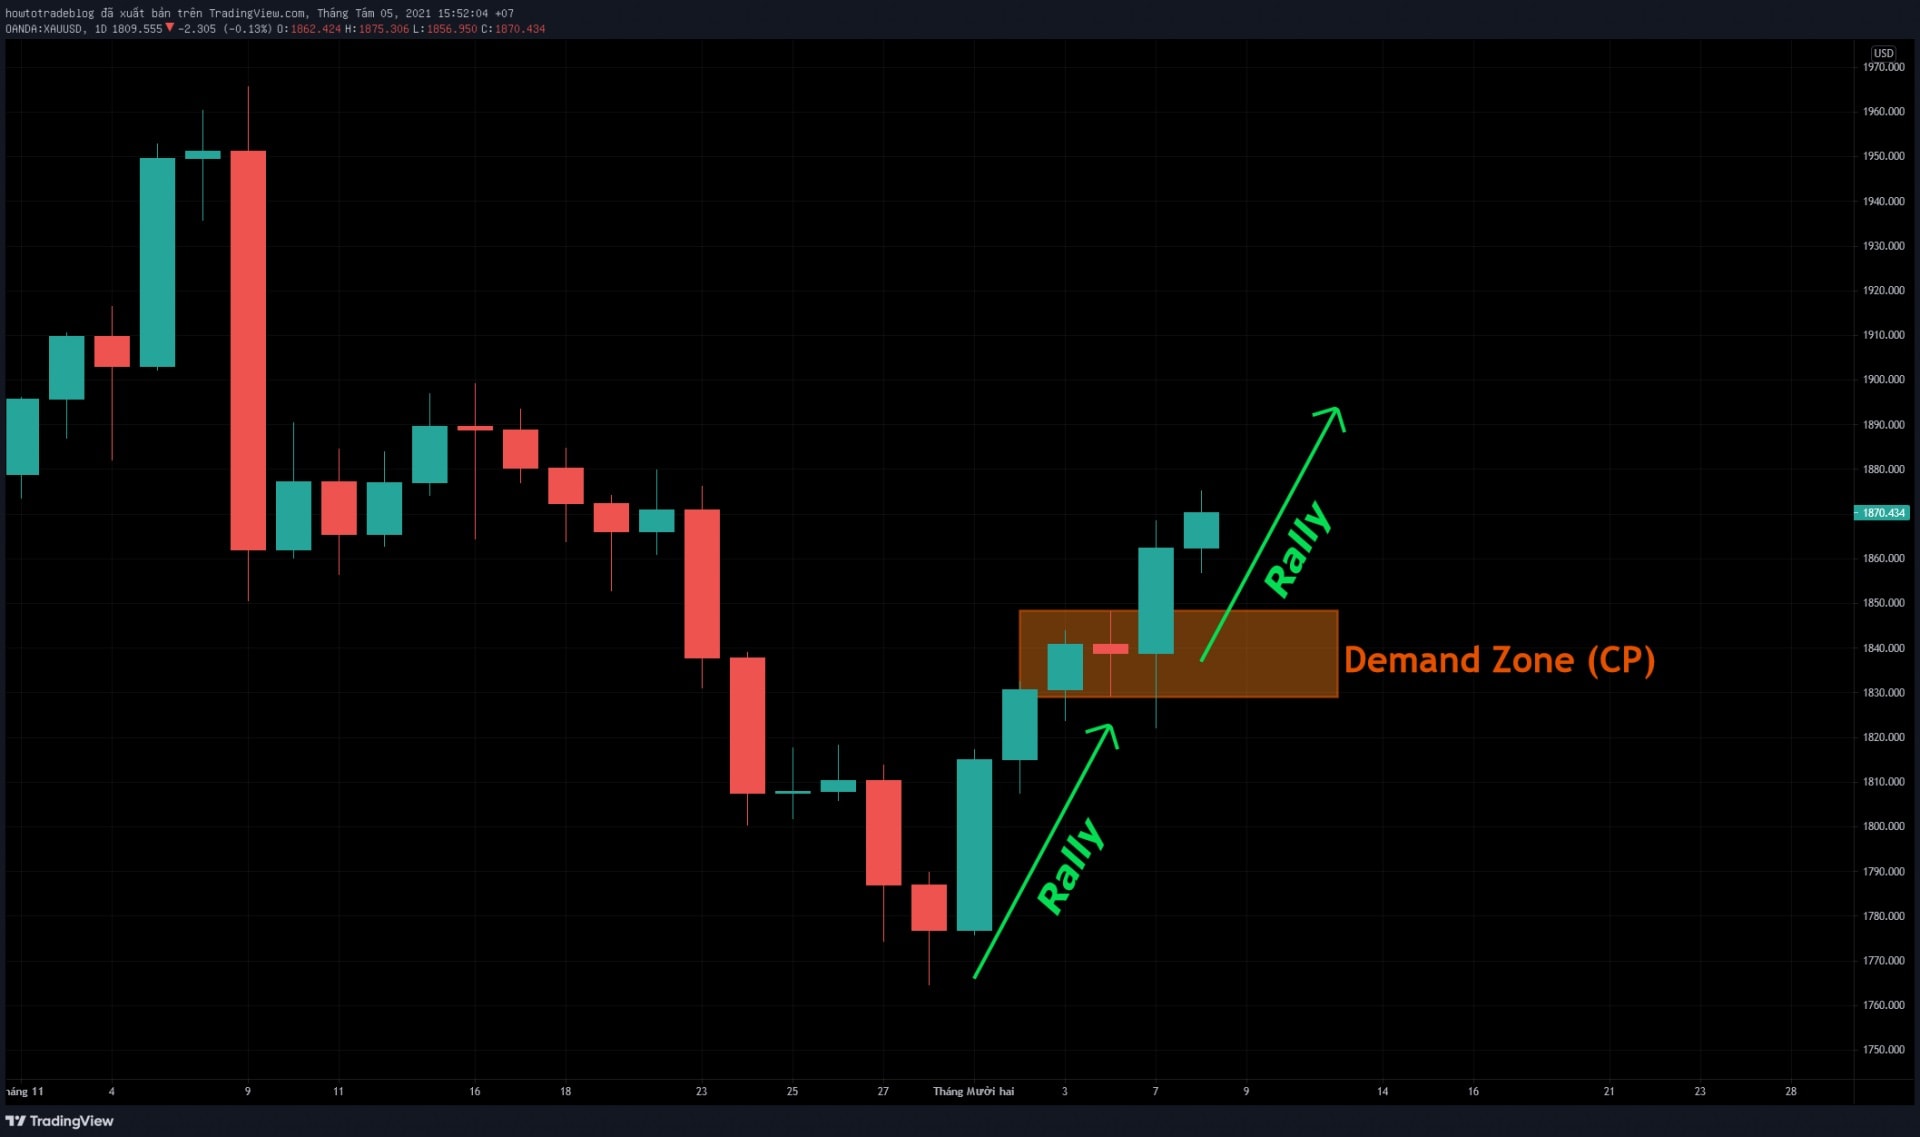
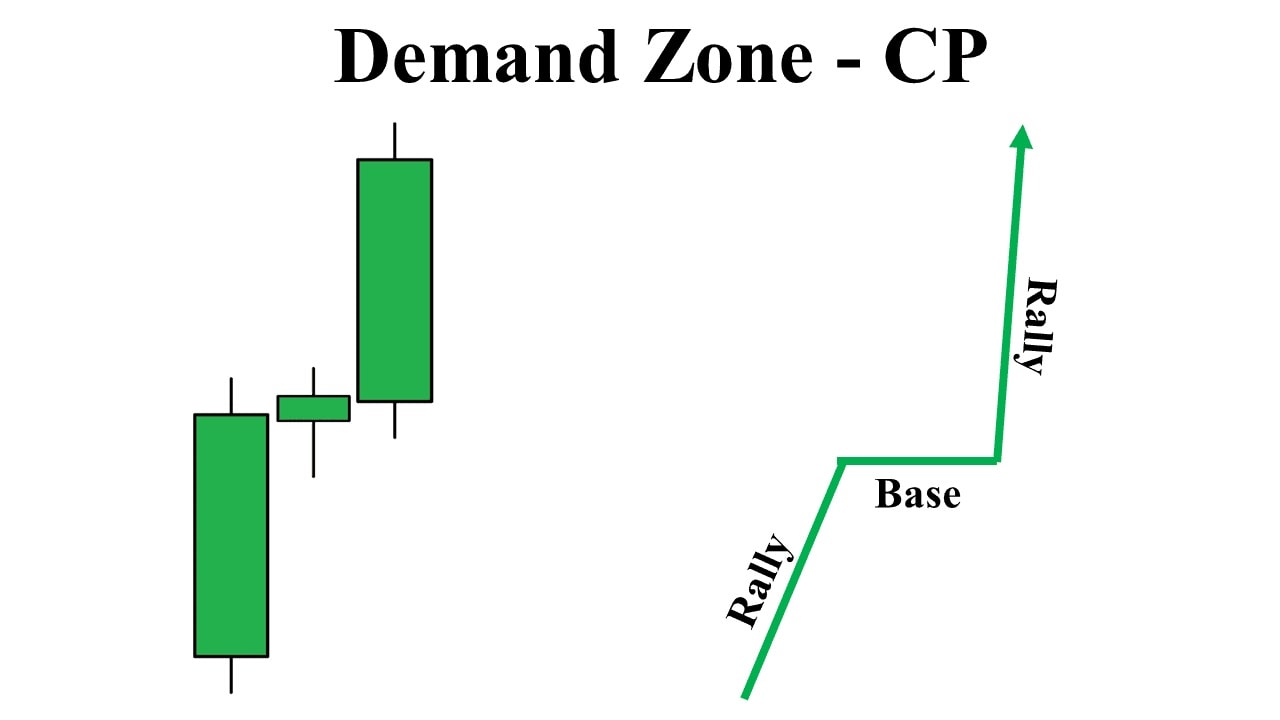
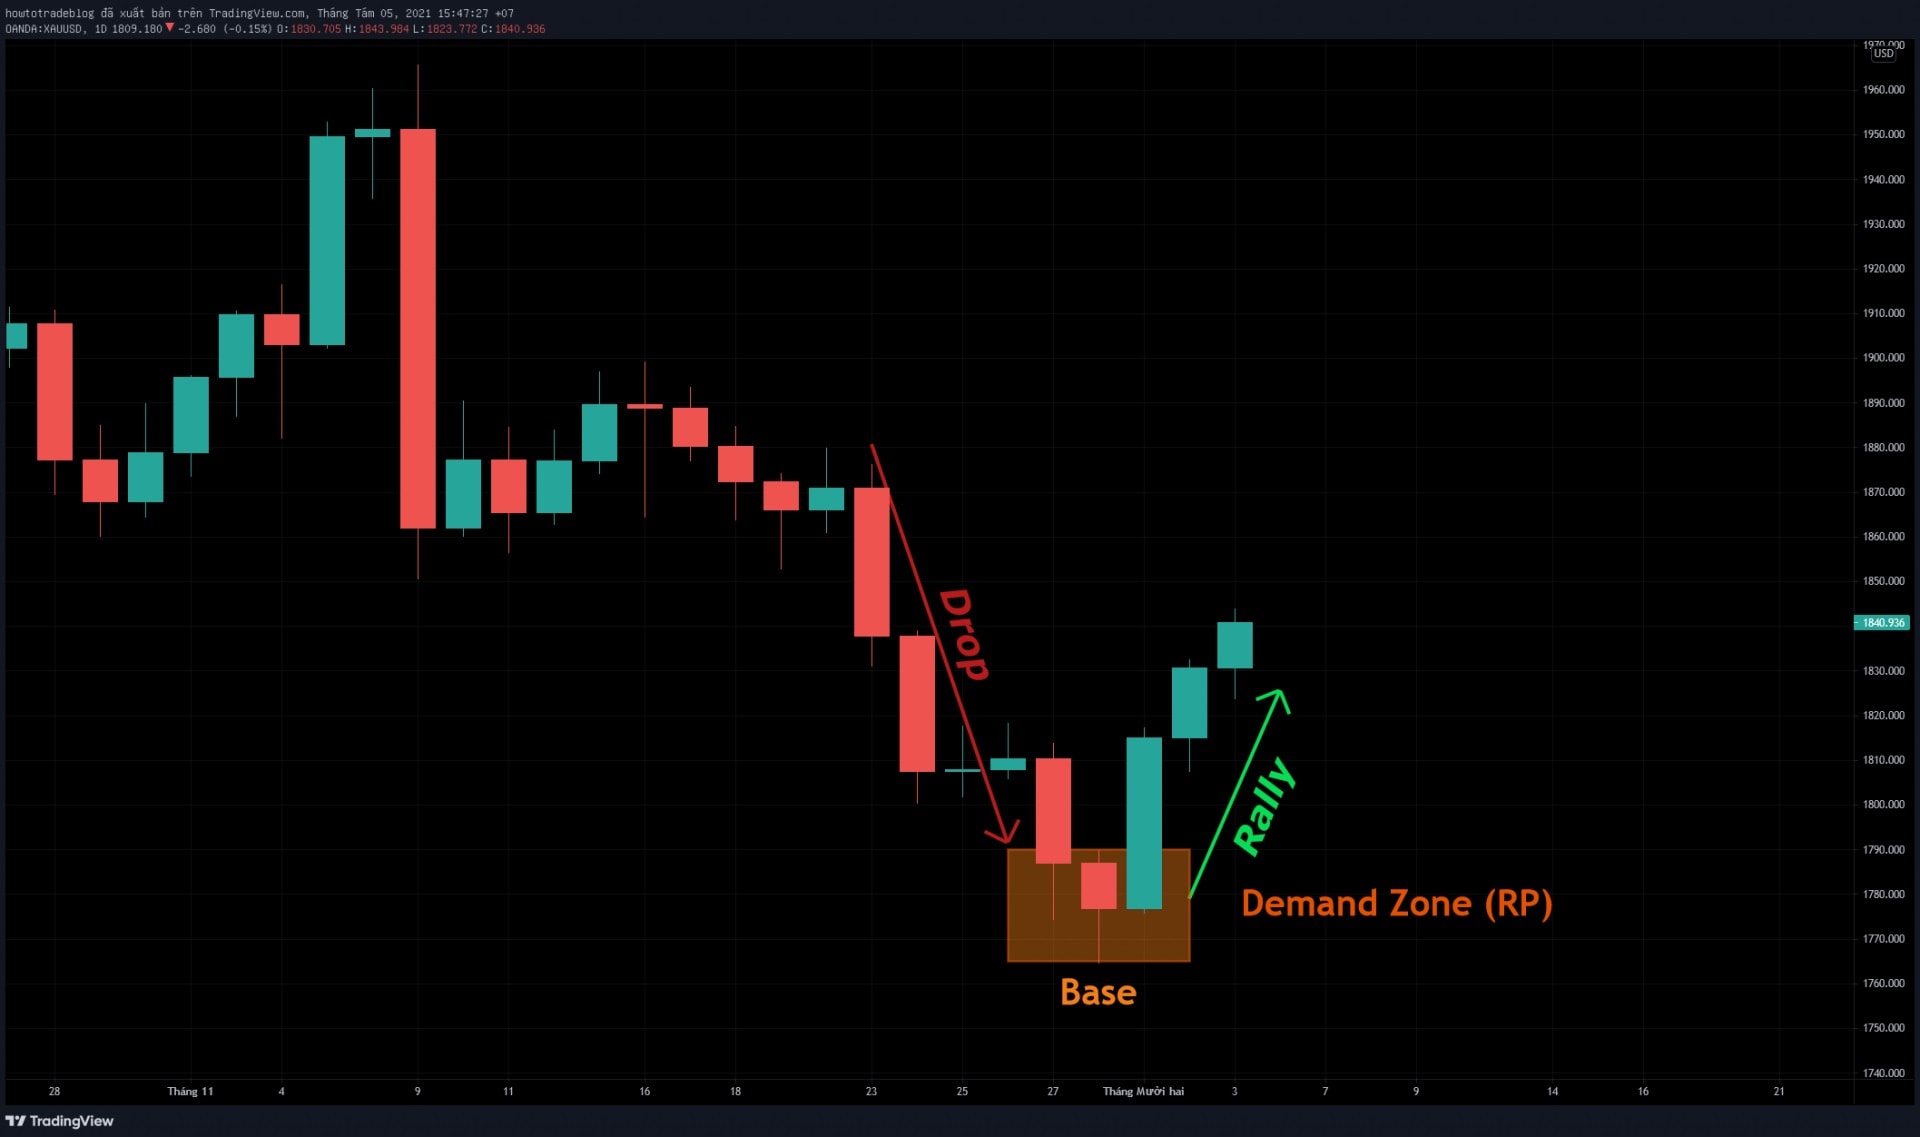
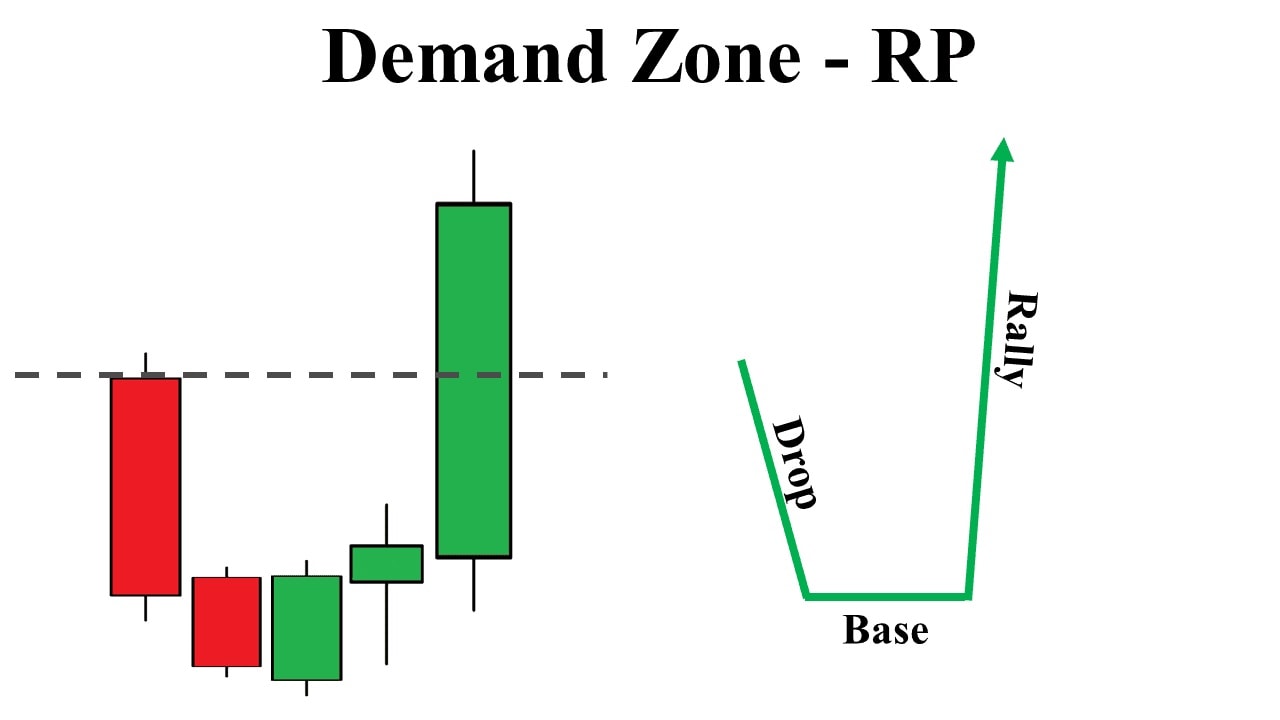
The Demand zone is similar to the Supply but we will focus on the strong bullish candlesticks. (1) Reversal Demand pattern (RP): Drop – Base - Rally [caption id="attachment_16533" align="aligncenter" width="1280"]Reversal Demand pattern Reversal Demand pattern[/caption] For example: [caption id="attachment_16534" align="aligncenter" width="1920"]An example of the reversal Demand pattern An example of the reversal Demand pattern[/caption] When the market bounces back, it creates a long green candlestick. Then the Base will be the Demand zone (RP). (2) Continuation Demand pattern (CP): Rally - Base - Rally [caption id="attachment_16535" align="aligncenter" width="1280"]Continuation Demand pattern Continuation Demand pattern[/caption] Detailed example: [caption id="attachment_16536" align="aligncenter" width="1920"]An example of the continuation Demand pattern An example of the continuation Demand pattern[/caption]
How to trade with the Supply and Demand zones

All we need to do is to watch for the strong bullish or bearish candlesticks. This is a sign of cash flow from large organizations. When the signal appears, it's time to look for entry points.

How to trade with the Supply zone

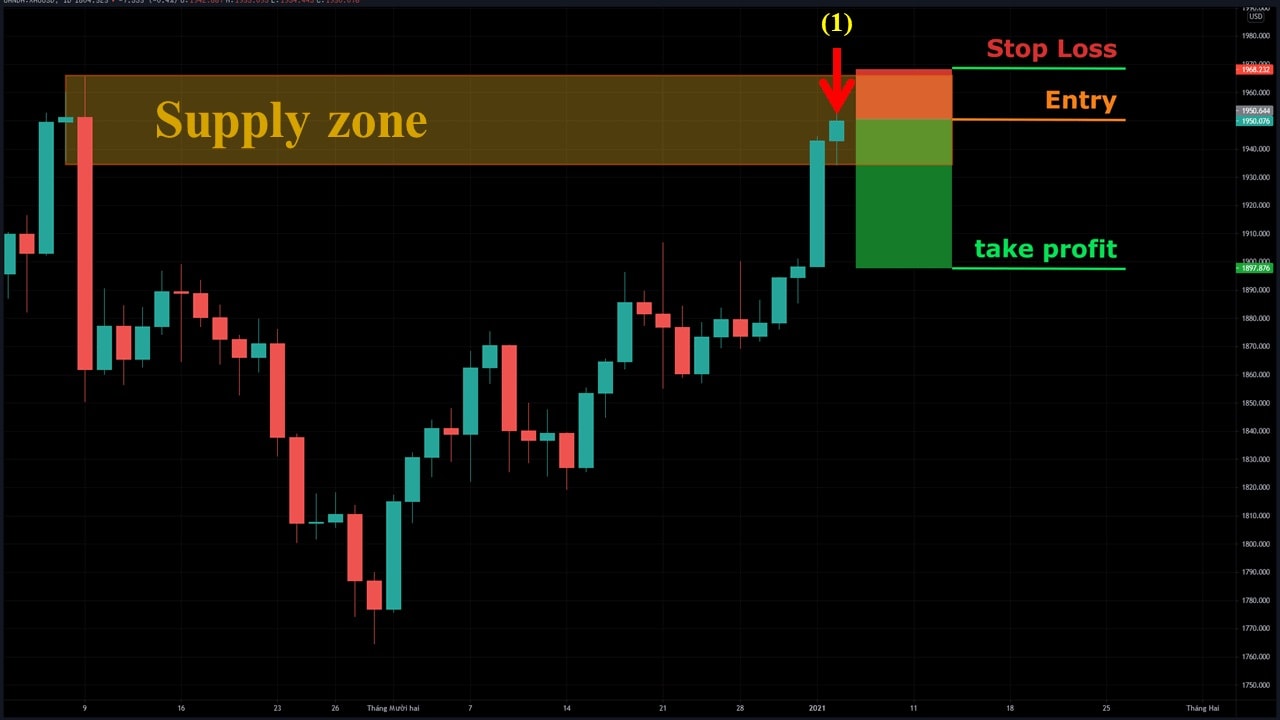
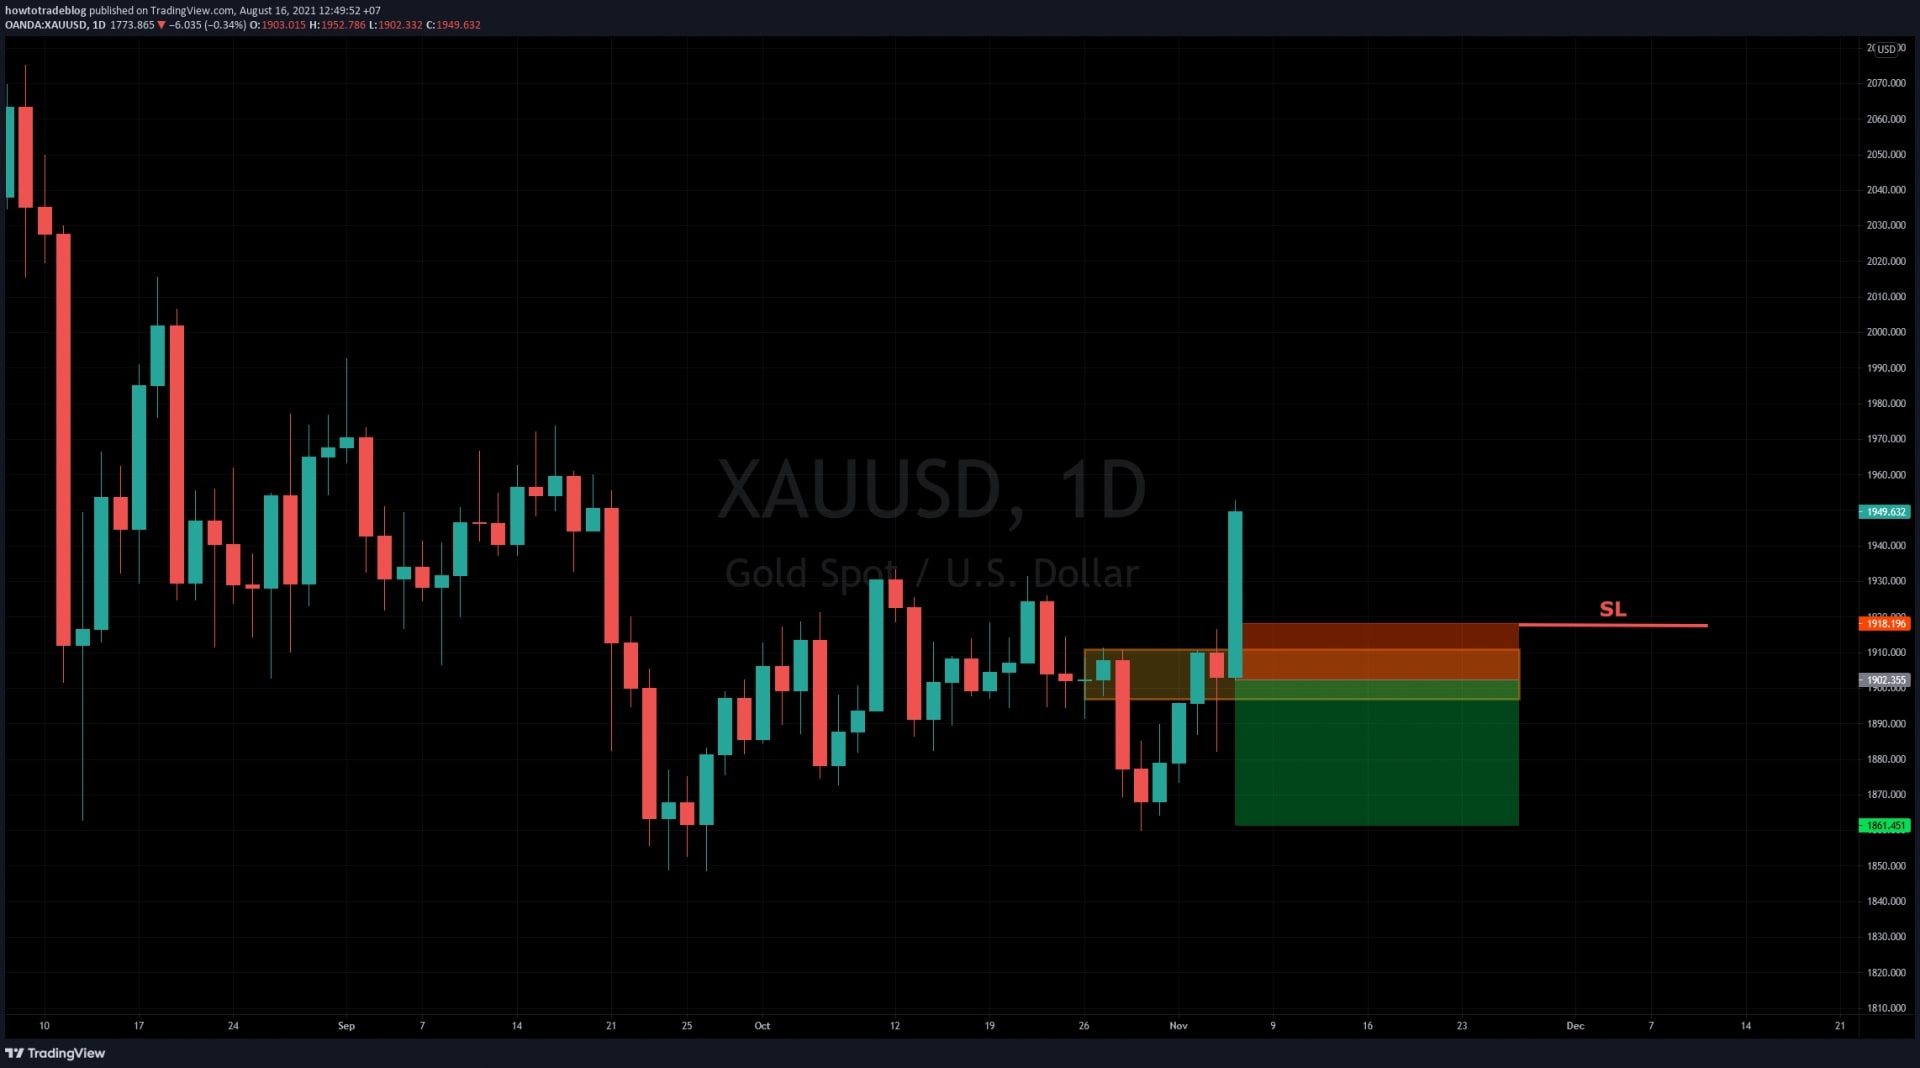
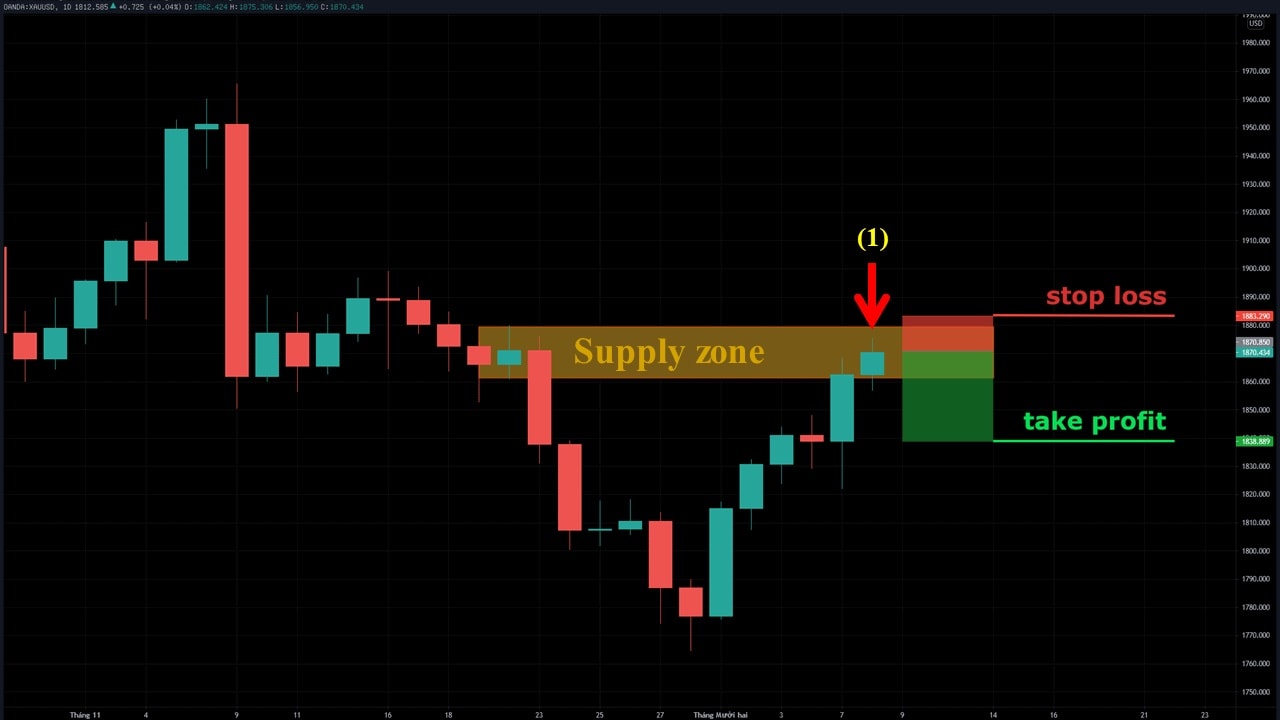
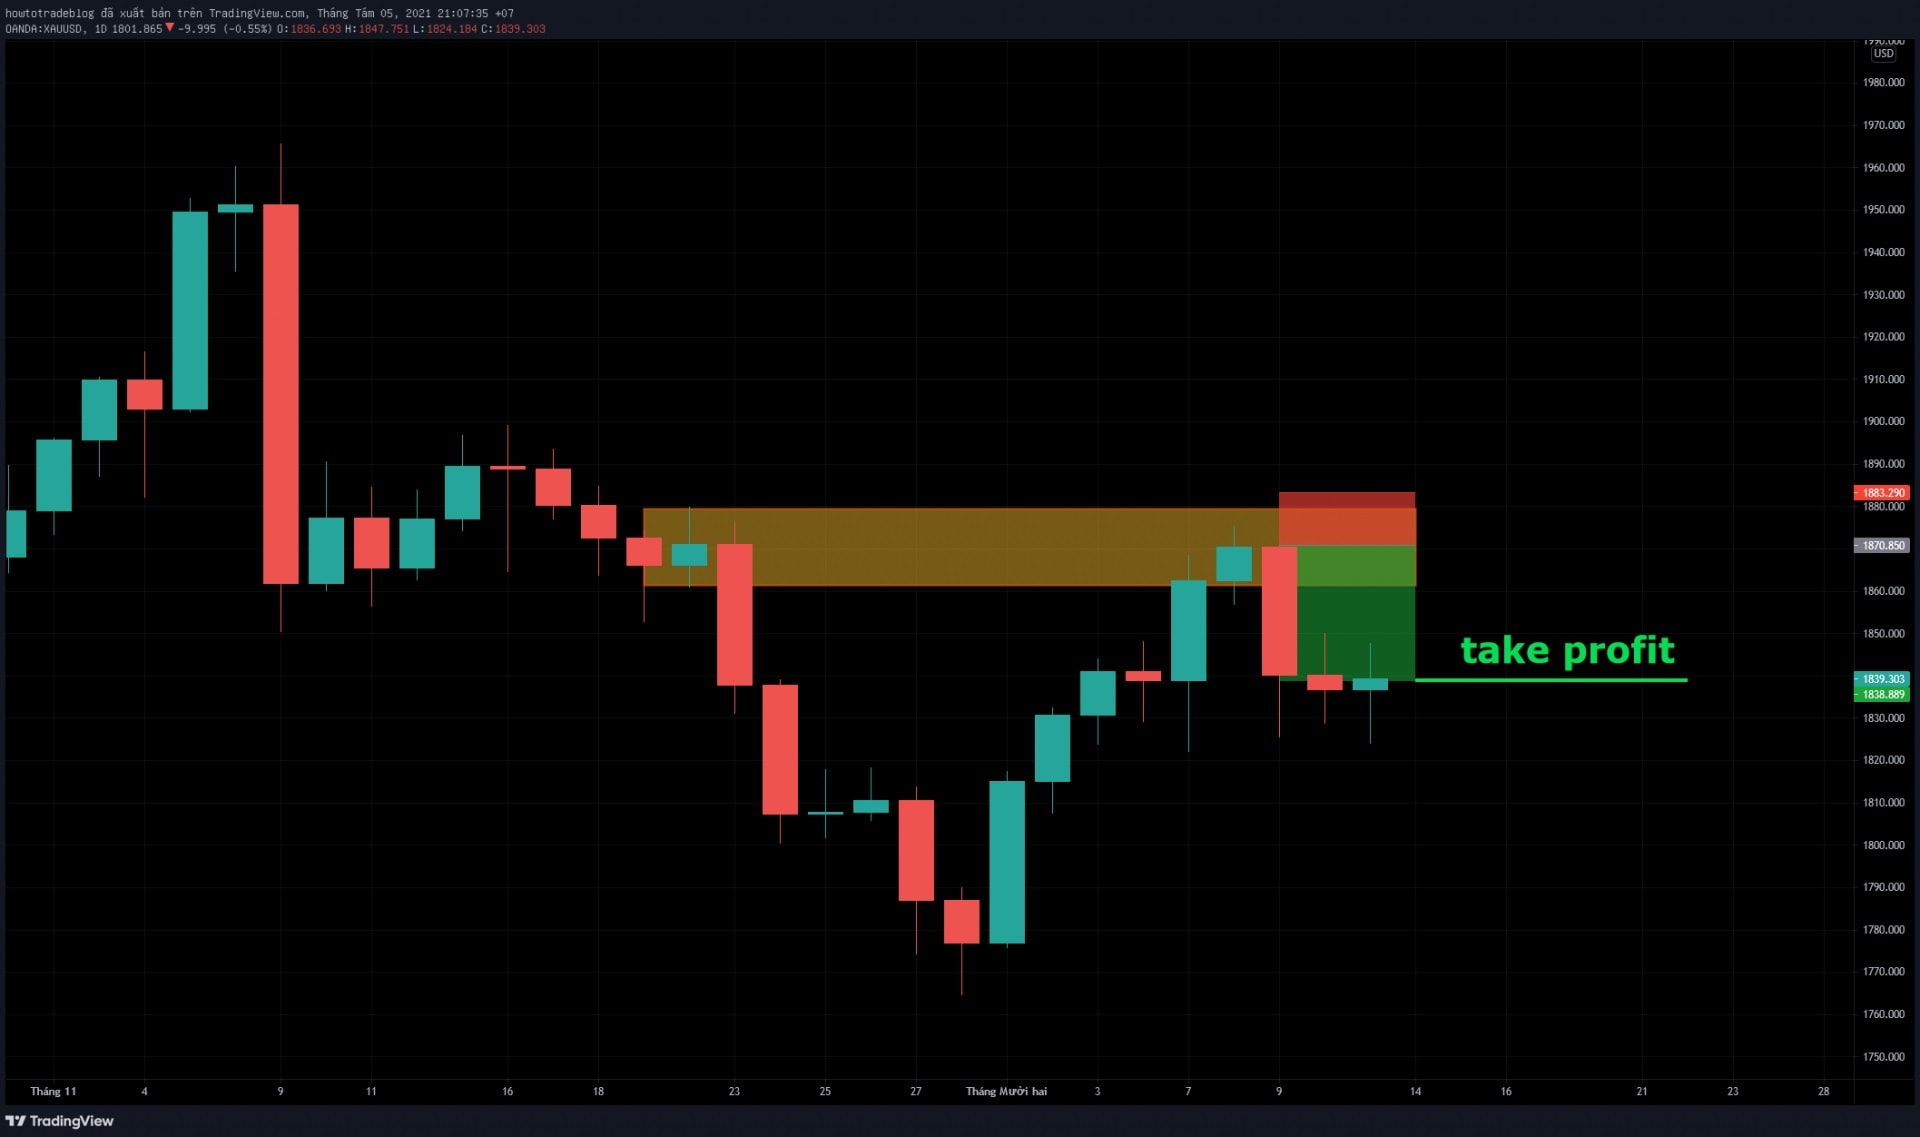
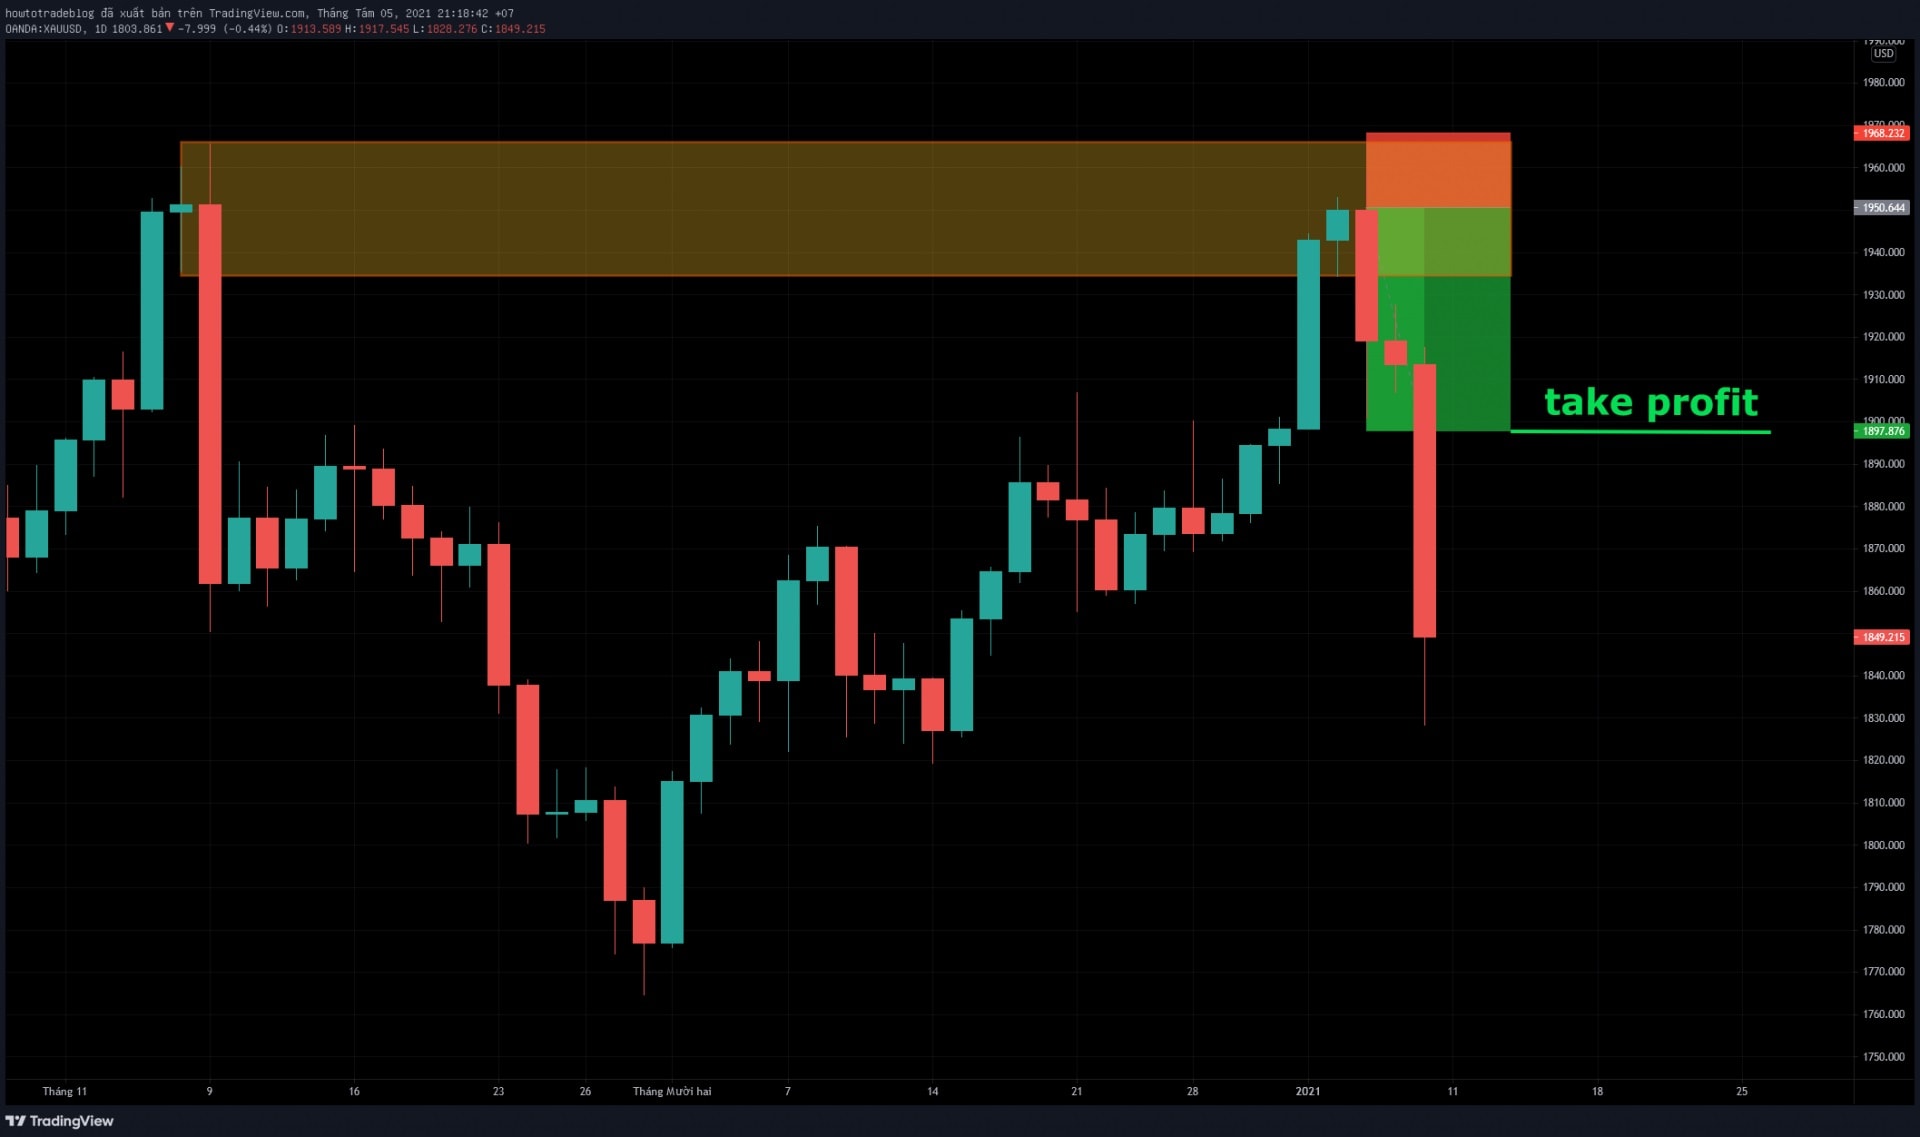
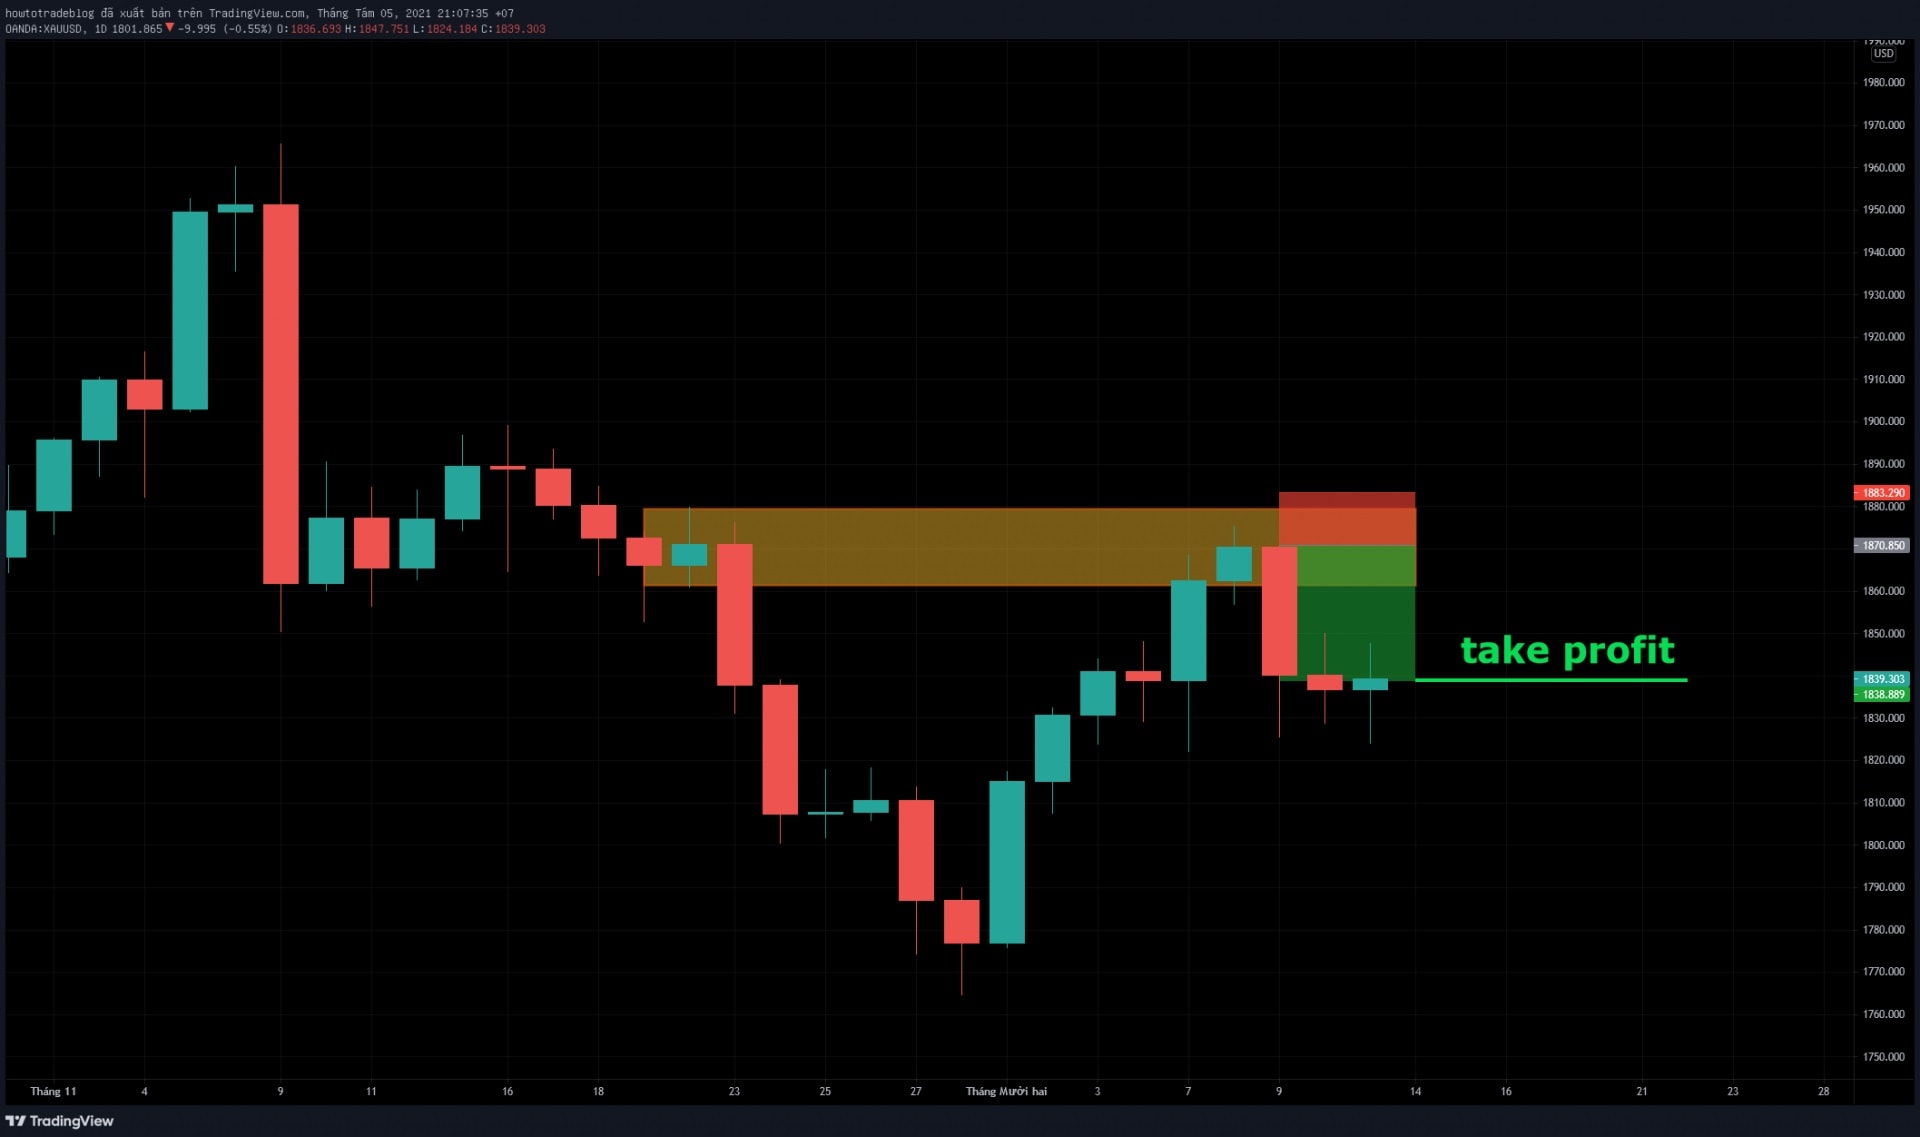
After identifying the Supply zone, the main job is to wait for SELL opportunities. When the price returns to retest the Supply zone, find an appropriate entry point and place a SELL order. For example, the yellow zone is the Supply zone of gold (XAU/USD). (1) When the price returns to this zone and creates a small body candlestick, this could be a signal that it will stop increasing. [caption id="attachment_16537" align="aligncenter" width="1280"]Trading with the Supply zone Trading with the Supply zone[/caption] (2) Place 1 SELL order (Risk/Reward = 1:2) + Set the stop loss a few pips above the Supply zone to avoid being swept by the market. + Set the take profit to overlap the below Demand zone. Result: The price drops sharply and touches TP. [caption id="attachment_16538" align="aligncenter" width="1920"]Trading result with the Supply zone Trading result with the Supply zone[/caption] I have another example about the gold price. (1) The price increases and enters the Supply zone. Then it begins to show a slow increase signal with a small green candlestick. [caption id="attachment_16539" align="aligncenter" width="1280"]Sell Gold at the Supply zone Sell Gold at the Supply zone[/caption] (2) Place 1 SELL order (Risk/Reward = 1:3) + Set the stop loss a few pips above the Supply zone. + Set the take profit to overlap the below Demand zone (as the picture shown). Result: The price falls sharply and hits TP. [caption id="attachment_16540" align="aligncenter" width="1920"]Trading result with the Sell order Trading result with the Sell order[/caption]
How to trade with the Demand zone

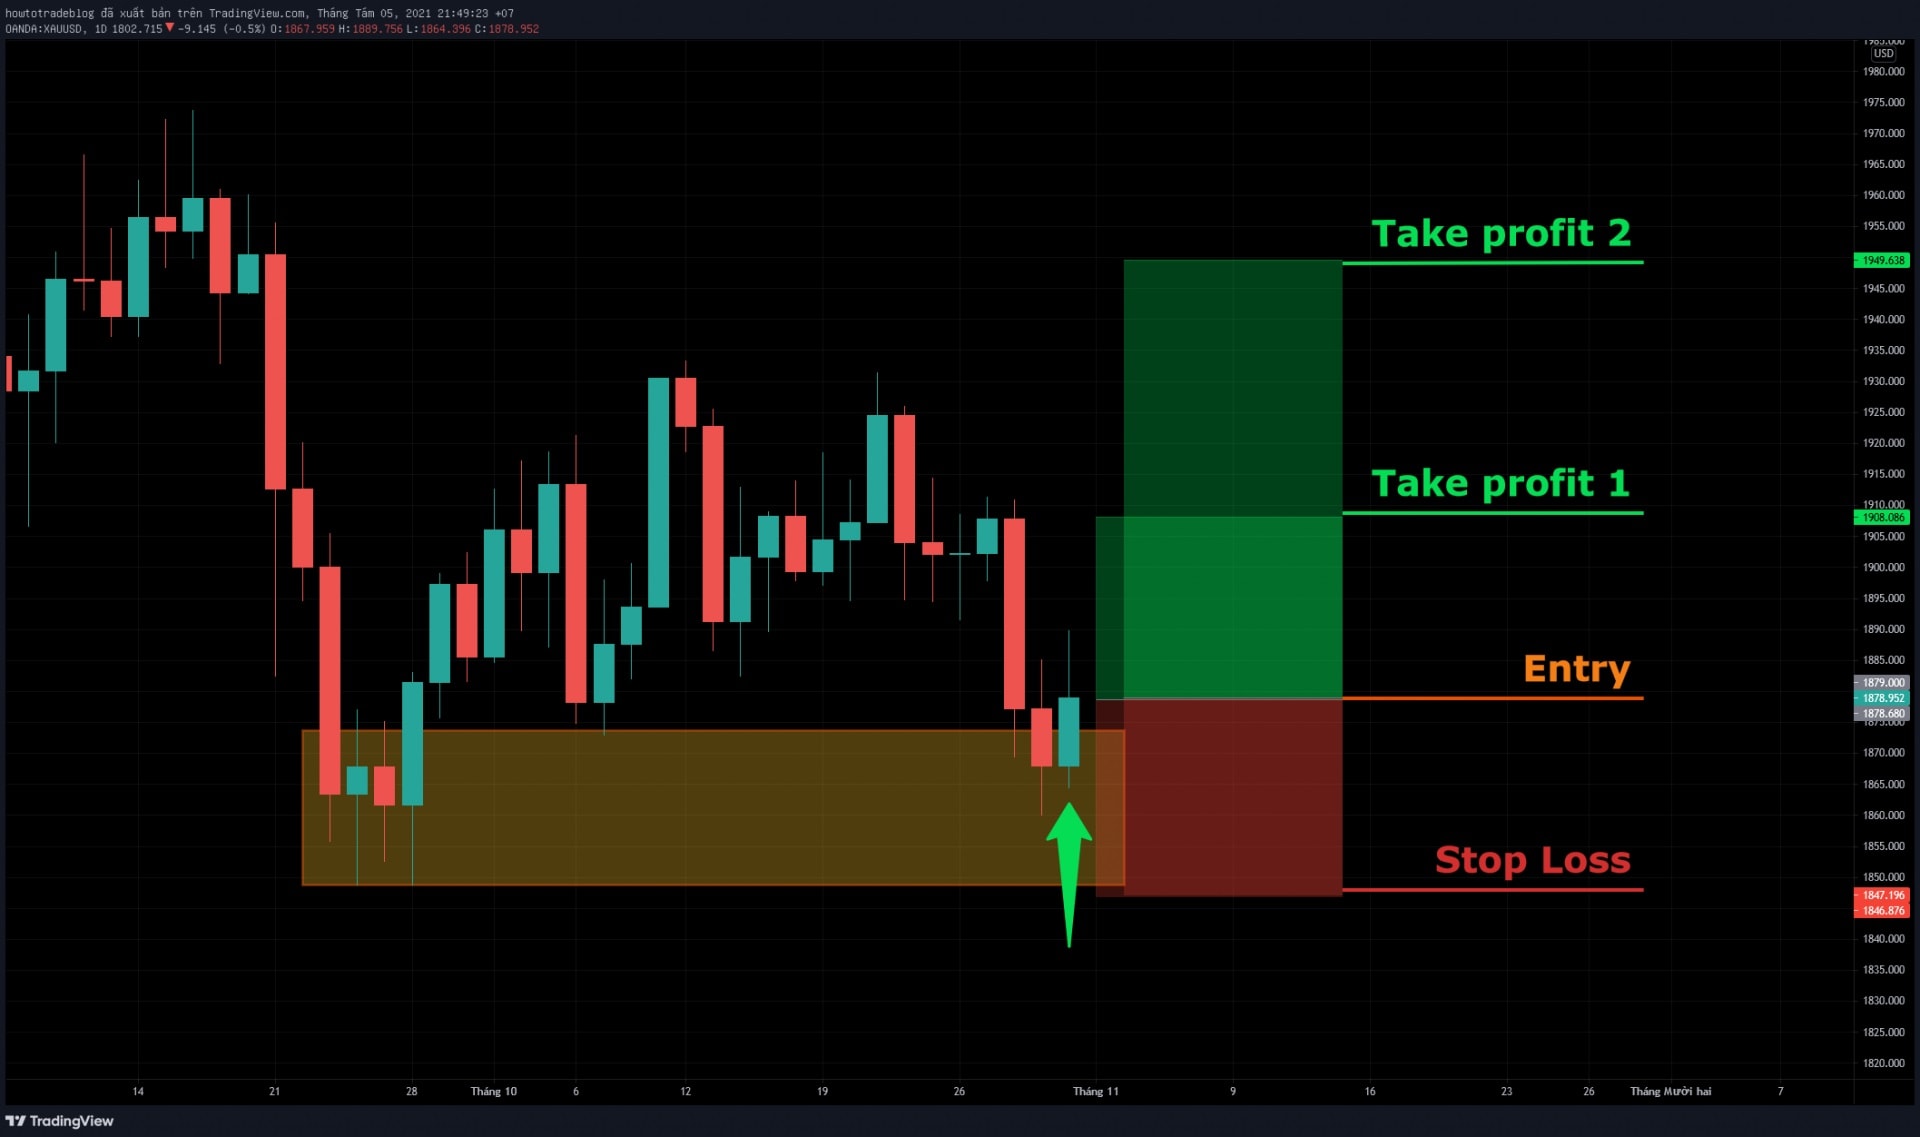
The first thing to do is to identify the Demand zone. The next is to wait for the BUY signal. When the price retests the Demand zone and creates a bullish reversal signal => Place a BUY order. We have an example of the Gold BUY order (XAU/USD). The price falls back to the Demand zone and creates a reversal signal. [caption id="attachment_16541" align="aligncenter" width="1920"]How to trade with the Demand zone How to trade with the Demand zone[/caption] Place the BUY order: + Set Stop Loss below the Demand zone. + Set Take Profit in 2 Supply zones. As a result, the price increases and hits both TP1 and TP2. [caption id="attachment_16542" align="aligncenter" width="1920"]Result of the BUY order Result of the BUY order[/caption] It is already quite long so I'll save the real trading experiences for the next article. We’ll also learn the reason why you should use a daily chart and when the Supply and Demand zones are no longer make sense.
Register an Exness account NowGet $1,000 Free for beginners

Wednesday, October 13, 2021

How To Use Risk/Reward Ratio Effectively In Forex Trading

When I begin to learn about Forex, many experienced traders told me that Risk/Reward (R/R) ratio is one of the best ways to manage money in trading. At first, I didn’t believe what they say and used other methods to get rich more quickly. Despite having a win rate from 60-70%, I kept losing money and burned a lot of accounts.

After one year, I decided to change my mind and tried to use the Risk/Reward ratio. And it turned out what they said was true. This method helped me a lot to keep my money safe and make profits gradually. Instead of getting rich-quick, I’m doing it slowly and safely now.

In this article, I will share all my experiences about how to manage money (capital) according to the R/R ratio. What is the reasonable rate of 1R? How to improve R/R ratio? Or why are its difficulty?

Register an Exness account NowGet $1,000 Free for beginners

What is the Risk/Reward ratio?

Risk/Reward Ratio (also known as R/R ratio) is simply understood as the ratio of the money you’re willing to lose in exchange of the profits you want to earn in 1 trade.

For example, I open a BUY EUR/USD order with 40 pips stop loss and 120 pips take profit . So in this case the ratio R/R = 1:3. Or in other words, in this trade, if I’m wrong, I will lose 1R. But if I’m right, I will win 3R.

What is the Risk/Reward ratio?

Usually, to determine how much money 1R is, people will base on the total money in your trading account (account balance).

For example, your account balance is $1,000. You choose 1R = 2% of the capital. So if you are wrong, you lose 1R = $20. Conversely, you will gain $60$ when winning.

Or you can change 1R = 5%, with R/R = 1:4 for 1 trade => If your prediction is wrong, you will lose $50. And when you win, you will earn $250.

In practice, professional traders often choose 1R = 2%. Why is 1R = 2%? You can check the 2% rule article to know the reason.

Some ways to use the R/R ratio in practice

Traders who use R/R ratio to manage money usually have a table summarizing their transactions (trading log). If they lose a trade, they will record -1R. On the contrary, if win, they will record +2R, +1.5R… depending on the amount earned.

Trading log with the Risk/Reward ratio

And in the end, what it all boils down to is making as much R profit as possible. Now I will share some ways to use the R/R ratio effectively.

Prioritize orders with a high R/R ratio potential

In a word, to start the trading day, I browse through certain currency pairs, analyze and predict their price trends. Then, I find the entry points, stop loss and take profit. From there, I will have an overview of the R/R ratio of these pairs. The ones with a low R/R ratio will be ignored. Those with high R/R ratios will be prioritized for monitoring and trading.

Prioritize orders with a high R/R ratio potential

Take for example the image above. The EUR/JPY order will be prioritized to trade because its ratio = 1:4 (best compared to the others).

Usually, long term traders will prefer this approach. What they need to do every day is quite simple. Take a little time, look at the overall market for each currency pair, pick a few pairs with a high R/R ratio and focus on them. When all the conditions have been met, they will enter the order.

Only trade with a certain R/R ratio

Simply put, you will choose a certain R/R ratio such as 1:2, 1:3 or 1:4 or even higher.

Trade with a certain R/R ratio

I give an example of a trader who loves the Risk/Reward ratio = 1:2. If the expected profit is not enough 2R, then he will pass. On the contrary, if any currency pair gives a chance to trade at a ratio of 1:2 or higher, he will consider opening a trade.

Often this approach will work for Day Traders, who spend most of their time looking for trading opportunities in the market.

What Risk/Reward ratio is reasonable?

Answer: The win rate will determine the R/R ratio.

For instance, your Forex trading method has a win rate = 50% (trade 100 orders, 50 wins – 50 losses). So you only need 1 ratio = 1:2 to make profits (50 x 2R – 50 x 1R = 50R).

On the other hand, if the win rate is only 30% (trade 100 orders, 30 win – 70 lose). So for the account to be profitable, the ratio must be 1:2.5 or more => (30 x 2.5R – 70 x 1R = 5R). 5R for 100 orders is too small.

What ratio is reasonable?

In reality, many traders make money with a win rate of about 30%. But every time they win, they make a lot of Rs in profit. After all, they’re still profitable.

Remember that our goal is to make as much R profit as possible. Therefore, calculate the winning rate carefully to be able to give a reasonable R/R ratio.

How to improve the R/R ratio?

Patience and patience

Optimizing Stop Loss is the best way to increase the R/R ratio. I will give you two specific scenarios.

Scenario A: Price breaks out of the resistance and goes up. If you enter a BUY order right now, your stop loss level will be 80 pips => If the price goes up 160 pips, the ratio is 1:2.

How to improve the R:R ratio?

Scenario B: You wait patiently for the price to retest the resistance zone and enter a BUY order. At this point, your SL is only 60 pips => If the price goes up 160 pips, then the ratio is now 1:2.6.

Do you understand what I mean? The more patiently you “bargain” with the market for a better position, the better the R/R ratio will be.

Long-term perspective change

Assuming you analyze the market in a small time frame (15 minutes or 1 hour), you will see a short take profit point.

Change to trade with long time frames

Try changing the timeframe on the chart you analyze (4 hours or days). You will see bigger waves, longer Uptrend or Downtrend cycles. From there, your take profit point will also be much longer. This will help improve your R/R ratio.

Evaluate the Risk/Reward ratio

The two key points that traders always find difficult when using this ratio are psychology and discipline. Let’s take a look at some of the pros and cons of this way of managing capital.

Account status

Similar to the 2% rule, the advantage of the R/R ratio is that your account status will never fall into a case of big loss. Your money will still be there, and opportunities will always come for those with money.

Account status when managing money with the Risk/Reward ratio

In this market, what you need to do is survive and adapt. If you can survive after a long time and still do not lose all money, you will earn profits naturally.

Profit taking psychology

All I write above is basically talking on paper. To use the Risk/Reward ratio effectively, you have to experience and go through hundreds of big and small battles in the market.

In the beginning, if you just simulate this way of managing capital and expect the same results, it’s not that easy. It’s because everyone’s mentality is different.

You may know it is normal for the price to go against the prediction and your order hits stop loss. But on the contrary, assuming the price goes in the right direction, the feeling of waiting for take profit is really terrible. It’s like you’re afraid a robber is staring at your pocket. At this point, you might make the wrong decisions.

Profit taking psychology example

For instance, the above is a beautiful BUY EUR/USD order with an expected R/R ratio of 1:2. The price has only increased half of the way, then the trader begins to feel afraid. He closes the order when the price has not reached the take profit level. From 1 trading order with the ratio = 1:2, it is now just 1:0.8

The psychology of waiting for TP is one of the barriers of capital management with the R/R ratio. When you are wrong, you lose 1R. But when you are right, psychology makes you not earn enough 1R. If you can’t solve this problem, your balance will lose gradually until it reaches 0.

Discipline is the most important part of Risk/Reward ratio

All traders who use the R/R ratio know its rules. “1R = 2% of the account and each trade is not allowed to lose more than 1R”. Or “Don’t trade when R/R ratio is lower than 1:2”. There are many other sayings. But not many people can obey the rules strictly.

Plenty of them get caught up in the market, forget what they learn and throw away the rules. And in the end, they leave the market with empty hands.

Remember that R/R ratio is good but it’s nothing without discipline.

Conclusion

Risk/Reward ratio is another great way to manage your capital to survive and make profits in the market. Personally, I also see a lot of traders choosing it as a guideline in their risk management strategies.

To actually master the R/R ratio is a long process. What you have to deal with are patience and discipline. It’s not as easy as you are reading my article.

Let’s experience it in a Demo account. I have already shared all things I learn and experience in this article. Goodbye and see you again in the next ones.

Register an Exness account NowGet $1,000 Free for beginners

The post How To Use Risk/Reward Ratio Effectively In Forex Trading appeared first on How To Trade Blog.


source https://howtotradeblog.com/risk-reward-ratio/

Monday, October 11, 2021

How To Manage Money Safely With The 2% Rule In Forex Trading

The majority of professional traders, who have come a long way in the field of trading, are using the 2% rule. In this article, I will share in detail how to use this rule to manage money in trading.

Register an Exness account NowGet $1,000 Free for beginners

What is the 2% rule in trading?

The 2% rule can be simply understood that you can only lose up to 2% of the total money (capital) in your account for 1 trade.

Example 1: Your capital is $1,000. So you can only lose up to $20 in 1 trade as shown in the photo below.

You open a SELL EUR/USD trade and the Stop Loss level is 20 pips. After applying the 2% rule, the trading volume for this SELL order will be 0.1 lots.

Example 1 of the 2% rule

Example 2: The money in your account is $3,000. The maximum loss will be $60. Let’s say you open a BUY GBP/USD trade with an SL of 40 pips => The trading volume for this BUY order will be 0.15 lots.

Example 2 of the 2% rule in trading

How to calculate lot size (trading volume)

The market has a lot of different currency pairs for you to trade, so the application of the 2% rule will also be different. To make it simple, I will give you a tool to calculate it called Lot size calculator.

It’s very simple to use. You just need to fill in some information such as account balance, risk, stop loss pips, and trading currency pair.

For example, my capital (account balance) is $30,000. I enter 2% risk, 60 pips stop loss and the trading currency pair is EUR/JPY => The trading volume is 1.1 lots.

How to calculate lot size

The question now is: How much is the Take Profit?

What will the take profit level be? This depends a lot on your trading strategy. I will give some specific cases for you to understand and be flexible when using the 2% rule.

Case 1: Do not set a specific TP level

It means you only set the Stop Loss (SL) level according to the 2% rule. When the price moves in the right direction, you will move the SL (Trailing Stop technique).

For example, I used the EMA21 trading strategy and the daily chart to enter orders.

When the price broke out and closed above the EMA21 => I opened a BUY order and set the Stop loss level below the Breakout candlestick (80 pips).

How to trade with EMA21 indicator

This order only ended when the price closed below the EMA21. There was no clear Take Profit level.

The 2% rule with EMA21 trading strategy

In this kind of trade, if I’m wrong, I will lose 2% of my capital. But in case I’m right, the profit will be huge. With this BUY EUR/USD order, I made a 6% profit. This is the way experienced traders use to catch a long wave in the market.

Case 2: Partial close

Simply put: Your maximum loss is 2%, and your profit-taking level depends on your psychology (Partial close technique).

For example, I use the Fibonacci indicator to identify take profit levels.

  • BUY EUR/USD at 1.18621
  • Stop Loss: 1.18121 (50 pips)
  • TP1: 1.19747
  • TP2: 1.20370
  • TP3: 1.22386
Use the Fibonacci indicator to identify take profit levels

My capital is $5,000 => 2% = $100. So my trading volume will be 0.2 lots. And when the price hits the TP1, I will close partially to gain some profits.

Case 3: Use Risk/Reward ratio

This is the Risk/Reward ratio (R:R) with 1R = 2% of the account balance. Usually, traders who use R:R only open orders when the expected profit is greater than 2% of the account, corresponding to the ratio R:R = 1:2 (1 risk for 2 profits) or higher.

For instance, I have a BUY order with EUR/USD. Stop Loss is 20 pips and Take Profit is 40 pips (corresponding to the ratio R:R = 1:2). My capital is $1,000 then the trading volume will be 0.1 lots. If my prediction is correct, I will have 40$ (2R) profit. Conversely, if wrong, I will lose 1R = 20$.

Risk/Reward ratio
Risk/Reward ratio

Above are some examples of how to manage money according to the 2% rule. You can vary depending on your Forex trading method and strategy. But remember that Only a maximum loss of 2% of the account balance is allowed.

Review the 2% rule

Why do most professional traders use this rule to trade? Why is the rate 2% of the account but not 3% or 5%?

I can’t exactly explain the above question. But when I use this rule, it really works. Now I will share my reviews.

Account status

In Forex trading, a Trader’s account status will fall into the following 5 cases.

(1) Big loss (Probably burning account)

(2) Small loss

(3) Break even

(4) Small win

(5) Big win

In trading, sometimes you may even experience a long losing streak. But when you use the 2% rule to manage your money, your account will only fall into 4 cases including small loss, breakeven, small win, or big win.

Account status in Forex trading

Just imagine when you are wrong, you only lose a small amount or break even. But when you’re right, either you win small or win big.

So, in 10 trades, you can:

– Lose 6 orders in a row (-12%)
– Draw 2 orders (0%)
– Small win 1 order (+4%)
– Big win 1 order (+10%)

Summary: You still have a profit of 2% of the total capital.

Why 2%?

Honestly, I don’t know exactly why the rate is 2% and not another number. I will try to use my experience to explain.

– 2% of the account balance is a small number. The psychological pressure and fear of losing money are not too heavy. This gives you more confidence in your decision-making process.

– 2% is a reasonable number for you to survive in the market. Lose 10 trades in a row? That’s okay because you’ll still be able to start over. Opportunities forever come to those who still have money in their pockets.

The 2% rule will help you survive in the market

– 2% creates a long-term mindset. Most people who come to the Forex, Coin, or stock market want to get rich quickly. And as a result, they burn a lot of accounts and tons of money.

But if you apply the 2% rule mindset, you will find the market is not as difficult as you think. Just be patient, you will make money in the long run.

Difficulty of the 2% rule

The biggest difficulty when I use the 2% rule to manage money is Discipline.

It’s very difficult to be strict with yourself. The market gives people the fear of being wrong and the fear of losing money. When faced with those, many traders won’t cut their losses. They forget the 2% rule and hope that the price will bounce back. And the result is nothing left in their accounts.

In short

May this post helps you in your trading path. With the 2% rule, I believe you will definitely survive in this market. As long as you survive, profits will come naturally in the long run.

Trust me!!!!

Register an Exness account NowGet $1,000 Free for beginners

The post How To Manage Money Safely With The 2% Rule In Forex Trading appeared first on How To Trade Blog.


source https://howtotradeblog.com/the-2-percent-rule-forex-trading/

Saturday, October 9, 2021

Real Trading With Trend And Supply Demand Zones (Chapter 4)

This is a whole chapter about real trading. I will talk more about money management and trading psychology. Moreover, I will also share my personal experiences when trading with the strategy: Trend + Supply Demand zones.

Of course, since it is real trading, we will have a more meticulous way of entering orders. Please read chapters 1, 2, 3 that I wrote earlier for better understanding.

Register an Exness account NowGet $1,000 Free for beginners

Money management plan

I use an MT4 account to trade in Exness with total money of $30,000. My money management method is Risk/Reward (R:R) with 1R = $600 (2% of total capital). So each trade I can only lose up to 600$.

To calculate trading volume, you can do it with Lot size calculator.

For example, I enter a GBP/JPY order with 120 pips stop loss => My trading volume will be 0.55 lots.

Money management with lot size calculator

BUY GBP/JPY order

I analyzed the market based on the daily chart. After identifying the Uptrend and the Demand zone, I started waiting for the price to retest and react at this Demand zone with a stop-decreasing candlestick. This was the signal for me to open a BUY order.

Identify the Uptrend and Demand zone of GBP/JPY

As soon as the signal candlestick closed, I entered a BUY trade:

  • Stop Loss (SL): 120 pips. SL level will be below the Demand zone.
  • Take Profit (TP): 240 pips. So, ratio R:R = 1:2.
  • Trading volume: 0.55 lots.
BUY GBP/JPY order
BUY GBP/JPY order

Result: Won 2R profit.

My BUY order won 2R
My BUY order won 2R

SELL XAU/USD order

In the daily chart, the gold price was in the downtrend and created a Supply zone. The market showed signs that the price was going to rebound and retest this Supply zone. My job was to wait for the reversal signal.

The gold price created a Supply zone in the downtrend

SELL Gold as soon as the price closed with 1 Doji candlestick.

  • SL: 250 pips right above the Supply zone
  • TP: 400 pips at the old trough.
  • Since the stop loss is quite far, I chose a safe trading volume with 0.24 lots (2% rule).
SELL Gold order
SELL Gold order

Result: The SELL Gold order won and earned more than 1.5R profit.

SELL Gold order won
SELL Gold order won

SELL USD/JPY order

It was still the same scenario with the USD/JPY. The price has been in the process of decreasing and created a supply zone. When it retested at this zone with a Bullish Pin Bar candlestick, I opened 1 SELL order.

  • SL: 40 pips. Set above the Supply zone.
  • TP: 100 pips. I expected the price to drop to the old trough. R:R = 1:2.5.
  • Trading volume: 1.6 lots.
SELL USD/JPY order
SELL USD/JPY order

Result: SELL USD/JPY order has not touched TP yet (at the time I wrote this article), but it was winning more than 2.5R profit.

SELL USD/JPY order still hasn't touched TP
SELL USD/JPY order still hasn’t touched TP

Another SELL XAU/USD order

This is one of the losing trades that I could hardly forget. The gold price was in a downtrend and it entered the Supply zone. After it created a reversal signal with a nice red candlestick, I placed a SELL order.

Another SELL XAU/USD order

Result: The order hit SL because the price suddenly flew like a rocket. The market is always like that. Sometimes everything goes smoothly as theory but the result isn’t what you expect.

SELL Gold order hit SL

Real trading experiences

Above are some of the real trading orders that I still keep the history. So, I share the timeline and the reason I place them. Now let’s talk about the advantages and disadvantages of this strategy.

Daily chart analysis

My experience shows that the Supply and Demand zones are more reliable than other chart types when using the daily chart. Signals such as reversal candlesticks, Doji candlesticks on the daily chart give greater safety.

In particular, when using the chart daily for analysis and trading, I don’t get caught up in unexpected price movements of the market. Although the number of trading orders is small, the win rate is quite high.

Supply and Demand zones are more reliable in the daily chart

Another advantage of using a daily chart is time saving. It does not take you too much time to analyze. Just identify the trend and Supply Demand zones on Gold or major currency pairs. The rest is waiting for the market to react there. In my free time, I will do other things like writing and translating this article to share with you.

Money management element

The trading strategy helps you know the entry point, where to set SL and TP, etc. Therefore, you can easily calculate the risk factor for each transaction.

However, in my opinion, money management is more important than the trading method. If you have a good way to control the flow of money, your mind will be calm even when you lose many orders. Almost all people know the strategy but only those who can control their emotions win in the market. That’s why right from the beginning I mentioned money management first. Hope you will understand what I want to convey.

Remember to risk only 2% of the total capital

Profit taking psychology

Stop Loss for each order is 2% of the account. If you do it well, there is nothing to worry about. But the problem now will be waiting for the price to move to the take profit zone. I call this “the profit taking psychology”.

If a person’s mind is weak and afraid of losing, he or she can close the order soon when the price has only gone half of its way. That’s still okay but it’s not worth the time you spend waiting for that order.

A long way to go

Sometimes I can only trade 1 order a week but that’s not a problem for me. I come to this market to learn how to survive and make long-term profits. Therefore, my priority is to keep the money safe.

If you follow this strategy, sometimes you will find it quite boring and feel a bit “greedy” when you see many other traders earning more than you. Everyone has their own trading style. If you choose to go slowly, safely and sustainably, this strategy is right for you.

A long way to go in trading

Summary

I would like to close the trading series based on Supply and Demand zones in this article. If you’ve read all four chapters, you can test this trading system on any platform like Tradingview, MT4/MT5. But don’t get cocky after winning in the demo account. It is very different when you trade with your real money.

Let’s practice and make it your own trading experience. Thank you and see you again in the next articles.

Register an Exness account NowGet $1,000 Free for beginners

The post Real Trading With Trend And Supply Demand Zones (Chapter 4) appeared first on How To Trade Blog.


source https://howtotradeblog.com/real-trading-trend-supply-demand-zones/