Wednesday, December 23, 2020

How to Use Parabolic Sar Indicator Effectively When Trading Forex

Many people mistakenly believe that financial trading and geometry fall into two different categories. In addition to the arithmetic connection, geometry is also used for technical analysis indicators. Parabolic Sar is a technical indicator built on such a basis and many traders loves to use it in Forex trading.

This article will introduce to you what the Parabolic Sar indicator is, its principles of operation and how to use the Parabolic indicator in Forex trading are also available.

Register an Exness account NowGet $1,000 Free for beginners

What is a Parabolic indicator?

Parabolic Sar is a technical indicator used to determine price direction as well as give a warning when price direction is changing. Parabolic Sar is called a “stop and reverse system”, developed by Welles Wilder. He is also the father of the Relative Strength Index (RSI). Traders use Parabolic to trade popularly because of its versatility.

What is a Parabolic indicator?

The operation principle and how Parabolic determines the trend

On the chart, the Parabolic Sar indicator appears as a strip of dots located above or below the price candlesticks. Parabolic Sar signals allow you to identify the trend of the market. Using this indicator in trend prediction is what many traders use.

Specifically:

+ When the Parabolic Sar dots are below the price, the market is in an uptrend.

The operation principle and how Parabolic determines the trend

+ On the contrary, when the Parabolic Sar dots are above the price, the market is in a downtrend.

The operation principle and how Parabolic determines the trend

How to effectively trade Forex using the Parabolic Sar indicator

As an effective trend prediction indicator, Parabolic Sar allows users to open very precise trend-following orders. Check out how I trade Forex with the Parabolic Sar below.

Open a BUY order with the Parabolic Sar indicator as follows:

+ Entry Point: When Parabolic changes position from above to below the price.

+ Stop-Loss: At the nearest support before Parabolic changes its position.

+ Take-Profit: You should take profits when the price touches resistance levels that have been formed in the past.

How to effectively trade Forex using the Parabolic Sar indicator

Open a SELL order with the Parabolic indicator as follows:

+ Entry Point: When Parabolic changes position from below to above the price.

+ Stop-Loss: At the nearest resistance before Parabolic changes its position.

+ Take-Profit: You should take profits when the price touches support levels that have been formed in the past.

How to effectively trade Forex using the Parabolic Sar indicator

Notes when using the Parabolic indicator in Forex trading

+ Combine Parabolic Sar with other trading signals to use it better. The indicator always has a certain lag compared to the price.

+ Do not use this indicator to enter trend reversal trades. This will be very risky for your account.

Get to know Parabolic today on a Demo account. This is a very good technical analysis tool in trading you need to master.

Register an Exness account NowGet $1,000 Free for beginners

The post How to Use Parabolic Sar Indicator Effectively When Trading Forex appeared first on How To Trade Blog.


source https://howtotradeblog.com/how-to-use-parabolic-sar-forex-trading/

Tuesday, December 22, 2020

What Is Bollinger Bands Indicator And How To Use It Effectively In Forex

Bollinger Bands is one of the leading technical analysis indicators in trading. With the signals that this indicator brings, you can predict price action in short and medium terms very accurately. So what is the Bollinger Bands indicator and How to use it reasonably and effectively in Forex trading? In today’s article, I will help you to clarify it all.

Register an Exness account NowGet $1,000 Free for beginners

What is a Bollinger Bands indicator?

Bollinger Bands is the name of an indicator taken after the name of a trader who invented this indicator. This is a technical analysis indicator that is heavily used in market analysis. When combined with other tools, the signals that Bollinger Bands offers investors are very accurate.

What is Bollinger Bands indicator?

Bollinger Bands indicator structure

Bollinger Bands consists of 3 main elements:

+ The topmost is the Upper Band – Green.

+ In the middle, it is the Middle Band. This is the SMA20 (average closing price of 20 candlesticks) – Orange.

+ The bottommost is the Lower Band – Red.

Bollinger Bands indicator structure

How to use Bollinger Bands in determining market trends

Traders use Bollinger Bands for many different purposes. However, in general, it carries the following two important signals.

Price signals to follow the trend (Uptrend or Downtrend)

This is a visual signal that Bollinger Bands offers to be able to identify the ongoing price trend. Specifically:

+ The price is in an uptrend

In an uptrend, prices usually create Japanese candlesticks in the upper band zone (the zone limited by the 2 upper and middle bands). When the price crosses the upper band, it tends to fall back into the Bollinger Bands. When the price touches the middle band (SMA20), it tends to rebound.

How to use Bollinger Bands in determining market trends

+ The price is in a downtrend

On the contrary, in a downtrend, the price creates Japanese candlesticks in the lower band zone (the zone limited by the 2 lower and middle bands). When the price falls out of the lower band, it tends to bounce back into the bands. When the price touches the middle band (SMA20), it tends to go down.

How to use Bollinger Bands in determining market trends

Signals when the market is moving sideways

This is the most effective signal that Bollinger Bands gives to traders. When the price goes sideways, it will fluctuate within the Bollinger Bands. Especially, when deviating from this Bollinger the price will adjust back inside.

The Bollinger Bands indicator signal when the market is sideways

How to effectively trade Forex using the Bollinger Bands indicator

For seasoned traders using Bollinger Bands, in many cases, this indicator alone is enough for them to open orders with extremely high win rates. Here are some popular trading strategies using Bollinger Bands.

Strategy 1. Trade according to the upper and lower bands of the Bollinger Bands indicator

This trading strategy is very simple and is especially effective when the market is sideways. I will guide you in detail on the entry points, stop-loss, and take-profit so that you can understand how to trade.

Conditions: The H1 Japanese candlestick chart and the sideways market. Bollinger Bands indicator (20,2).

Open a BUY order with the Bollinger Bands indicator as follows:

+ Entry Point: When the price crosses the Lower Band of the Bollinger Bands with a red bearish candle.

+ Stop-Loss: Place at the nearest Support before the price breaks out of the Lower Band

+ Take-Profit: When the price hits the Upper Band of the indicator.

Trade Forex according to the upper and lower bands of the Bollinger Bands indicator

Open a SELL order with the Bollinger Bands indicator as follows:

+ Entry Point: When the price crosses the Upper Band of the Bollinger Bands with a green bullish candle.

+ Stop-Loss: Place at the nearest Resistance before the price breaks out of the Upper Band

+ Take-Profit: When the price hits the Lower Band of the indicator.

Trade Forex according to the upper and lower bands of the Bollinger Bands indicator

Strategy 2. Trade with the Middle Band of the Bollinger Bands indicator

With this trading strategy, your trade will have a more accurate probability when the price follows the trend. Therefore, before opening an order, make sure the price is in a certain trend. See how to place orders below to understand.

Conditions: The H1 Japanese candlestick chart and a market with a trend (an uptrend or a downtrend). Bollinger Bands indicator (20,2).

When the price is in an uptrend, place a BUY order with the Bollinger Bands indicator as follows:

+ Entry Point: When the price hits the Middle Band and then rebounds. On the price chart, the signal will be a pair of red-green candles touching the middle Band.

+ Stop-Loss: At your nearest Support before the price hits the Middle Band and rebounds.

+ Take-Profit: When the price hits the nearest Resistance before the price enters an uptrend.

How to trade Forex with the Middle Band of the Bollinger Bands indicator

When the price is in a downtrend, place a SELL order with the Bollinger Bands indicator as follows:

+ Entry Point: When the price goes up, touches the Middle Band, and then declines again. On the price chart, the signal will be a pair of green-red candles touching the middle Band.

+ Stop-Loss: At your nearest Resistance before the price hits the Middle Band and declines.

+ Take-Profit: When the price hits the nearest Support before the price enters a downtrend.

How to trade Forex with the Middle Band of the Bollinger Bands indicator

To conclude

There are many other Forex trading methods and strategies that are based on the Bollinger Bands indicator. All will be introduced in the following articles. Proficient use of Bollinger Bands is a technique you need to master in trading. Get acquainted with the Bollinger Bands indicator on a Demo account today. Goodbye and wish you a successful transaction.

Register an Exness account NowGet $1,000 Free for beginners

The post What Is Bollinger Bands Indicator And How To Use It Effectively In Forex appeared first on How To Trade Blog.


source https://howtotradeblog.com/what-is-bollinger-bands-indicator-forex/

Monday, December 21, 2020

Review The T.L.S Trading Strategy That Brought A Profit Of $364 In IQ Option

In the last days of 2020, everyone works enthusiastically to have a happy New Year. They may have planned to explore the landscapes never before arrived. I like to travel too. And to do that, in addition to my main job income, Forex trading (left-hand job) gives me more income to be able to take on the vacation. In this article, I will review how to earn passive income from IQ Option with my preferred strategy – T.L.S.

Register an IQ Option account NowGet $10,000 Free for beginners

Video on earning a profit of $364 using the T.L.S trading strategy

The T.L.S strategy is suitable for all traders

The things that are cheap, simple to use with high efficiency will be welcomed by everyone. Apple’s product line is exceptional because it brings many benefits to users. Despite its quite high price, it is still loved and trusted by most people. Do you know why the price is high but buyers are still willing to pay? Because compared to the great benefits it brings, the price offered by the provider is still quite cheap.

The T.L.S strategy is suitable for all traders

Back to the topic, the T.L.S strategy (Trend, Level, Signal) is listed for sale for $499 in overseas courses. However, at Howtotradeblog.com, it is free to share. Everyone can learn and trade without paying any fees. The T.L.S trading strategy is completely simple. Even beginners can easily apply it. After all, whether it is effective or not depends on how you use it.

To me, T.L.S is an effective money-making formula in IQ Option. Currently, it helps me to earn more passive income, not too much, but enough to make me happy.

Should beginners learn T.L.S trading strategy?

Should beginners learn TLS trading strategy?

To be profitable in your Forex investment, you need to have an effective trading strategy. For beginners, you should find yourself a simple, easy-to-understand trading strategy. Do not choose too complicated things beyond your understanding just because it makes you “cooler” in the eyes of others.

I would like to suggest trading IQ Option with the T.L.S strategy for newbies. The things that constitute it are just the basic knowledge of the financial markets. They include:

– Trend which is a basic knowledge that you can learn from everywhere.

– Levels which are an advantageous price range if you are aware of them. Please refer to the article: What are resistance and support? The safest way to trade for more information.

– Signal which is a signal for you to open an order. The signals are mostly candlestick patterns or candlestick clusters with high accuracy. You can refer to it in the candlestick patterns section to know better.

Just combining these things, you will have a simple strategy to make money in the “long term”. Check it out and not necessarily T.L.S. As there are many good trading strategies out there, your job is to choose the one that is right for you.

Should experienced traders use T.L.S strategy?

Should experienced traders use TLS strategy?

I am sure that experienced investors have gone through many different trading systems. Eventually, they settle down for themselves with the best method of making money. If you have been in the financial market for a long time but still do not have a plan to make money in the long term, I think you should try T.L.S. Maybe it will suit you.

If you are a follower of reverse trading, you should also change your trading strategy. Following the trend is a safe and effective trading strategy summarized by the “seniors”. In the financial market, no one can go against the trend and succeed. You can’t fight the crowd. They’re like a train ready to crush your account.

I have also tried and burnt out many accounts with different trading strategies. Only when I chose T.L.S as the main strategy, things turned out better. Losses have started to decrease as my strategy offered less but higher-quality entry points. Gradually, I learned how to minimize my risk with it. That was when the first profit coins started coming to my account.

Currently, if you still make money steadily, there is no need to change to other methods. You should only change when things go wrong.

Pros and cons

Pros and cons
Pros and cons

Everything in the world has its good and bad sides, and so is a trading strategy. To make money in Forex investing, your job is to limit the bad and optimize the good of the trading method you are using. I will list the pros and cons of the T.L.S strategy for easy identification.

Pros:

– Easy to use.

– Offer entry points with a high probability of winning.

– Help traders avoid negative emotions.

– Effectively applied to major currency pairs.

– High accuracy rate when opening long-term orders.

Cons:

– Take a lot of patience to wait for good entry points.

Review opened orders in IQ Option using the T.L.S strategy from December 7 to December 11

Because you may have watched the video above, so I just describe a few orders so that you know how to choose the right entry points.

3rd order: In the AUD/USD currency pair, the market was in an uptrend. The signal candlestick was a Bullish Pin Bar touching the previous support. Opened a HIGHER order when the Bullish Pin Bar was confirmed with a 20-minute expiration time.

Review the trading order using the TLS strategy in IQ Option

4th order: In the EUR/USD currency pair, the market was in a downtrend. The signal candlestick was a green Marubozu closing at the previous resistance. Opened a LOWER order right after the candle closed at the resistance zone with an expiration time of 15 minutes.

Review the trading order using the TLS strategy in IQ Option

One thing you should know is that because the conditions for entry are very strict, so within a day, it is normal when there is no entry point for the EUR/USD, AUD/USD, JPY/USD pairs. If you choose T.L.S, get used to boredom. It will prevent you from falling into the temptations of the market, giving you certain security.

Once you are an expert on a single strategy, making money in IQ Option will become easier for you. Success will come to those who learn and study (I’m sure you understand that too). Therefore, let’s act instead of sitting there looking for a “holy grail” or frivolous things that exist only in imagination.

To conclude

If you have only one trading method and understand it little by little, then for sure, you will have a heavier pocket compared to other traders. You are like a real killer holding a gun with a silencer that gently ends the target (profit). You will make money when the opportunity comes up clearly in the market while there are still countless traders out there looking for profits. If you are still not profitable, right now, choose a weapon (strategy) to master before plunging into the battlefield. Wish you success.

Register an IQ Option account NowGet $10,000 Free for beginners

The post Review The T.L.S Trading Strategy That Brought A Profit Of $364 In IQ Option appeared first on How To Trade Blog.


source https://howtotradeblog.com/review-iq-option-tls-trading-strategy/

Friday, December 18, 2020

How To Make Money When Trading Gold In Olymp Trade

Hello, readers of howtotradeblog. It has been a long time since my last article – Mr.Joker – appeared on the blog. In today’s article, to mark my return, I will bring you a new effective strategy to make money in Olymp Trade. It is trading gold in Olymp Trade to bring profits for yourself. Let’s see how I did it and why I chose gold as an asset to trade in the past few days in Olymp Trade.

Register an Olymp Trade account NowGet $10,000 Free for beginners

Why should we trade gold in Olymp Trade at this moment?

The main reason why I choose gold to trade in Olymp Trade is: Gold is a commodity with large fluctuations in price in recent times. It’s especially when Covid 19 is devastating the global economy. Gold emerges as the safest haven for investors at this time. Trading gold during this period is reasonable because the large fluctuations in the gold price will easily help you make a greater profit when trading.

It’s just as simple as that! Now I will show you how I have earned over $400 when trading gold in Olymp Trade.

How to make money when trading gold in Olymp Trade

Here are my results in Olymp Trade on December 16. 5 Fixed Time transactions with a total capital of $700 brought me more than $400 in profit. This is proof for one thing: Making money in Olymp Trade is not difficult. It is only difficult when you do not have enough experience and knowledge.

Fixed Time Trading results with gold in Olymp Trade

Please do not assume that: With a picture and some winning orders, I want you to believe that what I’m saying is true. I don’t need you to be too concerned with those numbers. Because if you believe, you may even lose money faster and more in Olymp Trade. The purpose of this article is to give you practical knowledge and experience when trading in Olymp Trade. So, read on to understand what I mean.

EMA and price action

These are all I used to turn opportunities into profits in Olymp Trade. In a more specific way, EMA helps me identify the main trend. The EMA is the moving average with the least lag compared to the price path. Therefore, using EMA will make it very easy for you to know what state the price is in. Price action is the breakout of price and creating a new trend. When all eyes are on gold, the gold price will continuously “dance”. And that is when the opportunity to make money comes to you.

The EMA is a very good tool to help you identify price trends

Review Fixed Time orders when trading gold in Olymp Trade

In this section, I will explain each order so you can understand how to trade gold in Olymp Trade. Read it carefully because you will get a lot from this Fixed Time trading strategy.

1st order: Gold broke out of the price of $1854. This was a strong resistance formed earlier. At the same time, the EMA was pointing up, indicating a strong uptrend. Opened an UP order with an expiration time of 15 minutes. I won.

Review Fixed Time orders when trading gold in Olymp Trade

2nd order: The gold price continued to break the $1858 resistance with a Bullish Marubozu candlestick. It signaled that prices would continue to increase. Opened an UP order. I won.

The gold price continued to break the $1858 resistance with a Bullish Marubozu candlestick

3rd order: It was still a breakout from the support with a Bearish Marubozu candlestick. Along with that was the EMA 30 which was heading down. Opened a DOWN order. I won.

A breakout from the support with a Bearish Marubozu candlestick

4th order: There is no trading strategy that brings absolute victory. And in fact, it is! On the 4th order, it was still in the same condition but I had to pay $100 back to the market.

A losing Fixed Time orders when trading gold in Olymp Trade

5th order: The purpose of this order was mainly to recover the loss from the 4th order. The way I opened this order was different from the previous orders. A Pullback candlestick appeared in a downtrend (EMA was pointing down). Opened a DOWN order.  I won.

A Pullback candlestick appeared in a downtrend when the EMA was pointing down

Summary

That’s exactly how I did to make a profit in Olymp Trade. There is no need for any deposit and withdrawal videos because this article is not to make you believe in it. This is just merely for sharing and exchanging.

I look forward to hearing from you. It can be a comment or sharing your trading story in Olymp Trade. You can share anything because this is a blog to help us trade better every day. Thank you for reading the article.

Register an Olymp Trade account NowGet $10,000 Free for beginners

The post How To Make Money When Trading Gold In Olymp Trade appeared first on How To Trade Blog.


source https://howtotradeblog.com/how-to-make-money-trading-gold-olymp-trade/

Thursday, December 17, 2020

What Is CCI Indicator And How To Use It Efficiently In Forex Trading

Trend trading is always a safe solution. To be able to grasp the current trend, you need a reliable indicator to identify it. CCI is an indicator designed to help you with this in Forex trading. Today, I’m going to show you how to use this effective trend indicator.

Register an Exness account NowGet $1,000 Free for beginners

What is the CCI indicator?

The Commodity Channel Index (CCI) is an indicator used in the world of financial market analysts. On the price chart, CCI is an oscillating line between the fixed levels of +100, and -100 which are the overbought and oversold zones of the market. This is a very good trend indicator so that traders can identify price trends.

What is the CCI indicator?

How to use CCI in Forex Forex trading

Often, traders use CCI to determine price trends. There are 2 signals that CCI offers traders about a trend that is trend continuation and trend reversal.

CCI indicator’s trend continuation signal

This is the most notable signal of CCI. Specifically, the uptrend of the price is renewed whenever the CCI falls below -100. And then when it rises above -100, the trend will continue. It shows that the trend is getting stronger.

The trend continuation signal by CCI

The same thing happens when the market is bearish. Every time the price hits +100 and then falls again, the price continues a new downtrend.

The trend continuation signal by CCI

CCI divergence signal and price trend reversal

CCI divergence is the phenomenon in which the indicator goes against the price. This is a warning signal that the price will reverse the future trend. Specifically:

+ The price is trending up (the next peak is higher than the previous one) but CCI is falling. This phenomenon is called bearish divergence. It signals a price trend reversal from bullish to bearish.

CCI divergence signal and price trend reversal

+ On the contrary, the price is trending down (the next trough is lower than the previous one) but CCI is increasing. This phenomenon is called bullish divergence. It signals a price trend reversal from bearish to bullish.

CCI divergence signal and price trend reversal

How to trade Forex simply and effectively with the CCI indicator

CCI is a momentum indicator that shows whether a price trend is strong or weak. Watch and take a closer look at CCI so you can keep an eye on what’s going on. This can help you find very accurate trending trades with CCI.

Notes: These are test transactions to get used to the CCI. You should not apply it to real accounts. Register a Free demo account by clicking the button below to test and keep your capital safe.

Register an Exness account NowGet $1,000 Free for beginners

Forex trend continuation trading with CCI

This way of trading is quite simple and easy to do. You just need to wait for a clear trend from the market and then use CCI to enter a trade.

Open a BUY order in an uptrend with CCI as follows:

+ Entry Point: After CCI hits the oversold zone (-100) and then rebounds, the price will then create green reversal candles, indicating the continuation of the uptrend.

+ Stop-Loss: At the nearest support before the CCI hits -100.

+ Take-Profit: when the price touches old resistance levels that have been formed in the past.

Forex trend continuation trading with the CCI indicator

Open a SELL order in an uptrend with CCI as follows:

+ Entry Point: After CCI hits the overbought zone (+100) and then falls back, the price will then create red reversal candles, indicating the continuation of the downtrend.

+ Stop-Loss: At the nearest resistance before the CCI hits +100.

+ Take-Profit: when the price touches old support levels that have been formed in the past.

Forex trend continuation trading with the CCI indicator

Trade Forex with the CCI divergence

The advantage of this Forex trading strategy is that it is safer for your capital. CCI divergence is a very reliable price reversal signal. However, you will need to be patient to be able to place orders with this trading strategy.

Open a BUY order after the CCI bullish divergence appears as follows:

+ Entry Point: when CCI crosses the -100 level and goes up after diverging.

+ Stop-Loss: at the 2nd price bottom as CCI forms a bullish divergence.

+ Take-Profit: when the price touches old resistance levels that have been formed in the past.

How to trade Forex with the CCI divergence

Open a SELL order after the CCI bearish divergence appears as follows:

+ Entry Point: when CCI crosses the +100 level and goes down after diverging.

+ Stop-Loss: at the 2nd price top as CCI forms a bearish divergence.

+ Take-Profit: when the price touches old support levels that have been formed in the past.

How to trade Forex with the CCI divergence

In conclusion

The CCI indicator is used the most when the market is in a long trend. The signals which this indicator gives you will help you understand what will happen next. Get acquainted with CCI today to perfect your trend trading skills in Forex.

Register an Exness account NowGet $1,000 Free for beginners

The post What Is CCI Indicator And How To Use It Efficiently In Forex Trading appeared first on How To Trade Blog.


source https://howtotradeblog.com/what-is-cci-indicator-forex/

Tuesday, December 15, 2020

What Is SMA Indicator? How To Trade Forex With SMA

One of the popular market analysis techniques in Forex is the use of SMA indicator. Using the SMA is the simplest, most effective way to identify market trends. In today’s article, I will guide you on how to use the SMA in Forex trading with the highest efficiency.

Register an Exness account NowGet $1,000 Free for beginners

What is the SMA indicator?

SMA means a simple moving average. SMA indicator is considered by trend traders as an indispensable support tool. SMA acts relying on past price movements to forecast future trend movements. Although the calculation of the SMA is very simple (price averages), the effect is great when used.

What is the SMA indicator?

How does the SMA indicator work?

SMA is the simplest moving average. It is the average of closing prices over specified trading sessions.

For example, SMA (50) means the moving average of the 50 candles on the closing price of the previous 50 candlesticks.

The SMA belongs to the group of MA including SMA, EMA, and WMA. The remaining moving averages will be introduced to you in the following articles.

Each experienced trader uses the SMA for different purposes.

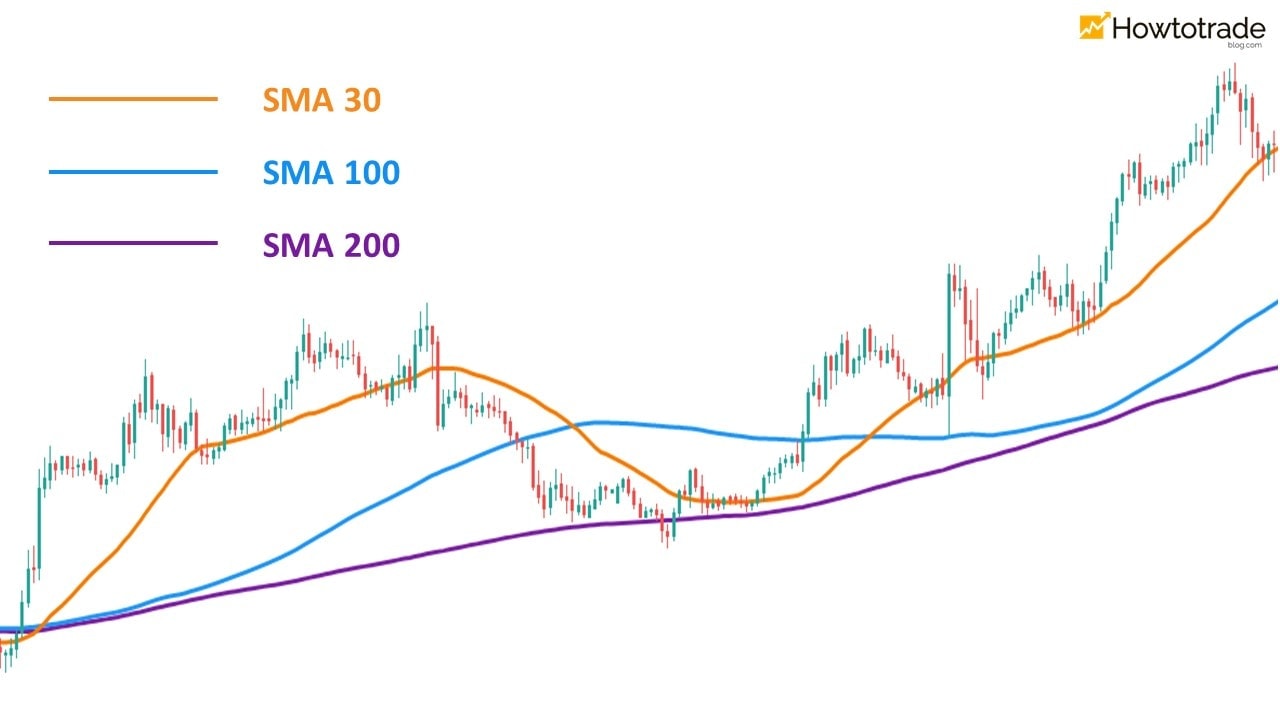
– SMAs used for long-term observation: SMA (100), SMA (200).

– For mid-term observation: SMA (30), SMA (50).

– SMAs for short-term use: SMA (10), SMA (14), SMA (20).

In the example below, you can see that in the short and medium term, prices have reversed from bullish to bearish. The price crosses the SMA 30 (orange), the SMA 100 (blue), and goes down. However, as using the SMA 200 with a long-term perspective, when the price touches the SMA 200 (purple), it rebounds and continues the uptrend.

Popular SMAs often used in Forex

In Forex, SMAs create dynamic levels that move with the price. This means that when the price touches these SMAs, it will likely bounce back or slow down. Depending on the SMA, these levels may be difficult or easy to break.

How to use SMA to determine price trends in Forex

The SMA helps investors find out both current and future price trends. The slope of the SMA reflects how fast or slow the price movement is.

Specifically:

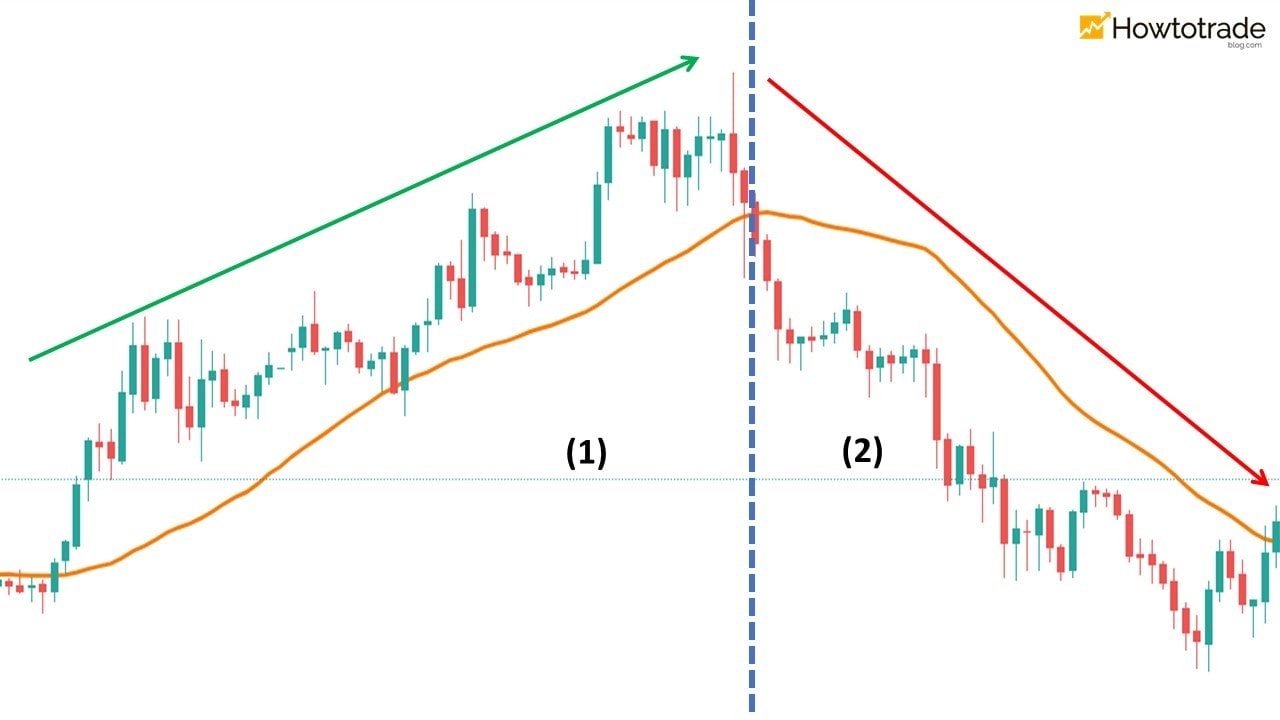
(1) When the SMA is pointing up and the price creates a Japanese candlestick that stays above the SMA, the market is in an uptrend. The steeper the SMA is, the stronger the uptrend is.

(2) When the SMA is pointing down and the price creates a Japanese candlestick that stays below the SMA, the market is in a downtrend. The more sloping the SMA is, the stronger the downtrend is.

The SMA helps investors find out both current and future price trends in Forex

Especially: When the price crosses the SMA strongly, this is most likely a trend reversal signal.

How to trade Forex effectively with the SMA indicator

SMA is best used in predicting market trends. In this section, I will guide you to place orders with the SMA indicator. These are test transactions to get used to the SMA. You should not apply it to real accounts.

When opening an order, in order to optimize your profits, you need to clearly identify entry points, take-profit, and stop-loss. Doing this will make your account more secure.

Strategy 1. Trade Forex using a single SMA

This trading strategy is very simple. You just need the SMA 30 to open orders. The entry signal is when the price definitely cuts the SMA and develops a new trend.

Conditions: The H1 Japanese candlestick chart. The SMA 30 indicator.

Open a BUY order with the SMA 30 indicator as follows:

+ Entry Point: When the price crosses the SMA 30 from below with a bullish candle with a long body.

+ Stop-Loss: At the nearest Support before the price crosses the SMA 30.

+ Take-Profit: when the price touches old resistance levels that have been formed in the past.

Trade Forex using a single SMA

Open a SELL order with the SMA 30 indicator as follows:

+ Entry Point: When the price crosses the SMA 30 from above with a red bearish candle with a long body.

+ Stop-Loss: At the nearest Resistance before the price crosses the SMA 30.

+ Take-Profit: when the price touches old support levels that have been formed in the past.

Trade Forex using a single SMA

Strategy 2. Trade Forex using two combined SMAs

This is a popular trading strategy adopted by a large number of traders. The two SMAs used to open orders are SMA 30 and SMA 10.

Conditions: The H1 Japanese candlestick chart. The SMA 30 and SMA 10 indicators.

Open a BUY order with two SMAs as follows:

+ Entry Point: When SMA 10 cuts SMA 30 from above and widens.

+ Stop-Loss: At the nearest Support before the two SMAs intersect.

+ Take-Profit: when the price touches old resistance levels that have been formed in the past.

Trade Forex using two combined SMAs

Open a SELL order with two SMAs as follows:

+ Entry Point: When SMA 10 cuts SMA 30 from below and widens.

+ Stop-Loss: At the nearest Resistance before the two SMAs intersect.

+ Take-Profit: when the price touches old support levels that have been formed in the past.

Trade Forex using two combined SMAs

The technique of using SMA in trading is one of the basic skills that you need to master. In the following articles, I will guide you to build effective Forex trading strategies based on SMA indicator. Goodbye and see you again.

Register an Exness account NowGet $1,000 Free for beginners

The post What Is SMA Indicator? How To Trade Forex With SMA appeared first on How To Trade Blog.


source https://howtotradeblog.com/what-is-sma-indicator-forex/