Monday, February 15, 2021

Three Inside Up Candlestick Pattern And How To Trade Forex Most Effectively

This article introduces you to the Three Inside Up bullish reversal candlestick pattern in Forex. This is a strong bullish signal used by many traders in trading.

Register an Exness account NowGet $1,000 Free for beginners

What is a Three Inside Up candlestick pattern?

Three Inside Up is a reversal candlestick pattern that usually appears at the end of a downtrend. It warns that the downtrend may be over and the uptrend is starting to resume. Every time the pattern comes out, the market has a high chance of going up in price in the future.
What is a Three Inside Up candlestick pattern?

Structure of this candlestick pattern

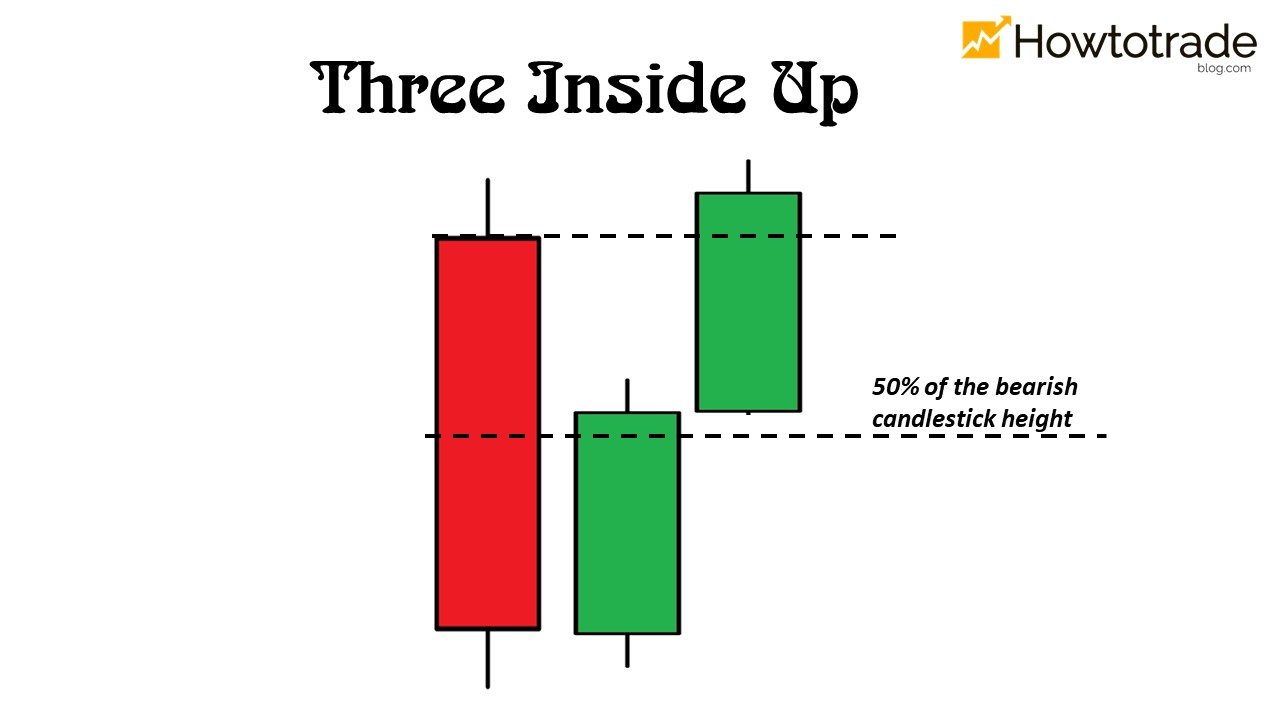
A standard Three Inside Up candlestick pattern consists of the following characteristics:

– First candlestick: Is a long-body bearish candlestick that is usually at the end of the downtrend.

– Second candlestick: Is a bullish candlestick with a long body equal to 50% of the previous bearish candlestick.

– Third candlestick: Is still a long-body bullish candlestick, which closes above the opening price of the first bearish candlestick.

Meaning and where to appear

When combining 3 candles in the Three Inside Up pattern, you will receive a Bullish Pin Bar pattern. This is a common bullish signal. However, with a longer candle time period (including 3 candles), this pattern gives a more accurate and reliable signal.

Meaning of the pattern

This is a strong reversal candlestick pattern that usually forms at the end of a downtrend. As with other reversal candlestick patterns, it still shows a continuation of the downtrend of the first candle. However, the uptrend will return and dominate the market in the following candles. Once the pattern is confirmed, the bear market will be over and the bulls will overwhelm it.

The position of the Three Inside Up candlestick pattern on the price chart

Several popular variants of Three Inside Up pattern in Forex

The Three Inside Up candlestick pattern has different variations from the standard pattern. In terms of accuracy, they all give reliable bullish signals. Although they are variations, they still bear common characteristics of the standard pattern

Several popular variants of the Three Inside Up pattern

How to trade Forex effectively with the Three Inside Up pattern

Here, I will show you how to open a Forex order effectively with the signal of the Three Inside Up candlestick pattern. Remember that this is a bullish signal in the market. So when it appears, focus on opening a BUY order as follows:

+ Entry Point: As soon as the price completes the pattern.

+ Stop-Loss: At the lowest price level before rebounding.

+ Take-Profit: when the price touches old resistance levels that have been formed in the past.

How to trade Forex with the Three Inside Up pattern

Please note that this is only a test transaction to verify and get familiar with the Three Inside Up candlestick pattern. You should only apply it on a Demo account. In the following articles, I will show advanced Forex trading strategy using this candlestick pattern. Stay tuned!

Register an Exness account NowGet $1,000 Free for beginners

The post Three Inside Up Candlestick Pattern And How To Trade Forex Most Effectively appeared first on How To Trade Blog.


source https://howtotradeblog.com/three-inside-up-candlestick-pattern-forex/

Wednesday, February 10, 2021

How To Trade Forex With The Bearish Engulfing Candlestick Pattern

In the Engulfing candlestick pattern pair, the opposite of the Bullish Engulfing candlestick pattern is Bearish Engulfing. In this article, I will introduce to you this strong reversal signal. Along with that is how to trade Forex with the Bearish Engulfing candlestick pattern in the most effective way.

Register an Exness account NowGet $1,000 Free for beginners

What is a Bearish Engulfing candlestick pattern?

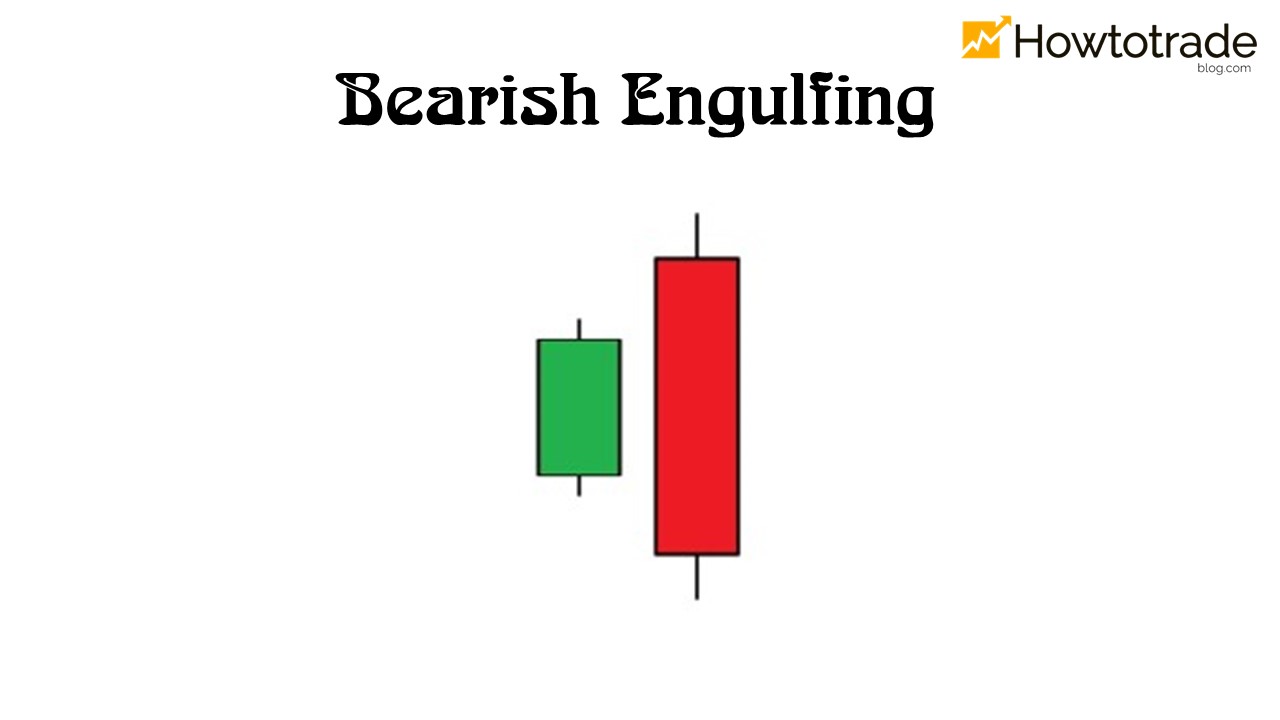
Bearish Engulfing candlestick pattern is a warning signal that the market will strongly reverse from bullish to bearish. This pattern consists of 2 candles with the first green bullish candle and the second strong red bearish candle covering the previous one. The second strong bearish candle is called the engulfing candle.

In Forex, every time this pattern appears, traders will consider opening SELL orders. This is on the basis that prices are likely to reverse down.

What is a Bearish Engulfing candlestick pattern

Meaning

Combine two candles of Bearish Engulfing (A) => The price decisively reverses from bullish to bearish (B) => Shooting Star candlestick or Bearish Pin Bar (C). This is a familiar bearish signal.

Meaning of the Bearish Engulfing pattern

Although the direction of the price is similar to the Shooting Star (Bearish Pin Bar) candlestick, this pattern has higher accuracy because it is a combination of two candlesticks (which takes a longer time).

On the price chart, this pattern may appear at the end of uptrends. It is a reliable signal that the price could reverse from bullish to bearish. Sometimes, it also appears during downtrends, warning the continuation of the downtrend.

Positions on the price chart

Some variant candlestick patterns

With this pattern, the second candle is very important. So in some cases, you can see its variants appear as shown below. A bearish candlestick completely eliminates the bullish momentum of the previous candles.

Some variant candlestick patterns

How to trade Forex effectively with the Bearish Engulfing candlestick pattern

Below, I will guide you to open basic Forex orders with this pattern. For a safe transaction and maximum profit, you need to define the exact entry point, stop-loss, and take-profit.

*Notes: This is a signal that the price will reverse to bearish. Therefore, you can only open SELL (Short) orders when this candlestick pattern appears.

Strategy 1. Fish the top of the market

This trading strategy is quite risky because it is a SELL transaction at the top of the market. However, if the price goes according to the scenario, the profit will be maximized. Place a SELL order when the price is in an uptrend and hits the top to create a Bearish Engulfing pattern as follows:

+ Entry Point: As soon as the price completes the pattern.

+ Stop-Loss: At the highest point that the price touches and then turns down.

+ Take-Profit: When the price touches old support levels that have been formed in the past.

Fish the top of the market

Strategy 2. Trade following the downtrend

This trading strategy is very safe because the price is already in a trend. The basis is that when the Bearish Engulfing pattern is created, the downside momentum will be strengthened. You just need to wait patiently for the pattern to appear to open orders. How to open a SELL order is as follows:

+ Entry Point: As soon as the price completes the pattern.

+ Stop-Loss: At the nearest resistance before the pattern forms.

+ Take-Profit: When the price touches old support levels that have been formed in the past.

Trade following the downtrend with the Bearish Engulfing in Forex

Get to know Bearish Engulfing today because this is an extremely reliable price signal in Forex. Understanding and applying flexibly this candlestick pattern will help you a lot in trading. I wish you successful transactions.

Register an Exness account NowGet $1,000 Free for beginners

The post How To Trade Forex With The Bearish Engulfing Candlestick Pattern appeared first on How To Trade Blog.


source https://howtotradeblog.com/how-to-trade-forex-with-the-bearish-engulfing-candlestick-pattern/

Monday, February 8, 2021

Bullish Harami Candlestick: Characteristics And How To Trade In Forex

In technical analysis, Bullish Harami is known as a preferred signal, having high accuracy in catching the big uptrend in Forex. So, what is A Bullish Harami candlestick pattern? What does it mean and how to use it in Forex? Today, I will help you clarify everything about this special candlestick pattern.

Register an Exness account NowGet $1,000 Free for beginners

What is a Bullish Harami candlestick pattern?

Bullish Harami candlestick pattern (looked like a pregnant woman) is a Japanese candlestick pattern that includes two candles as follows: The first candle is a strong red bearish candlestick. The second one is a green bullish candlestick that lies within the first one.

In the West, it is called the Bullish Inside Bar candlestick pattern. In Japanese, the shape of this pattern resembles that of a pregnant woman. It is a very accurate signal, confirming a bearish to bullish reversal. This is a very good entry signal for you to enter profitable transactions safely.

What is a Bullish Harami candlestick pattern?

Considering comprehensively, the pattern appearing in large time frames (H4, D, etc.) will be equivalent to a Triangle pattern in small time frames (M15, M30, etc.). This is a common form of market accumulation before a reversal or a continuation in an uptrend occurs.

Meaning of the Bullish Harami in Forex

Why is the Bullish Harami candlestick pattern a signal for an uptrend in Forex? Observing in more detail, we can see that when combining this candlestick pattern, we will get the Pin Bar (or Hammer) candlestick pattern. This is a very common bullish signal often encountered on price charts.

Meaning of the Bullish Harami candlestick pattern in Forex

This pattern often appears at the end of downtrends. It warns traders that the price might bounce back after this candlestick pattern. In some cases, it can appear in uptrends. This reinforces the uptrend of the price.

Meaning in Forex
Meaning in Forex

The variant patterns

Apart from the standard Bullish Harami candlestick pattern, Forex traders are also interested in variations of this special candlestick pattern. These variations are the candlestick patterns with the second candlestick being special Candlesticks such as Shooting Star or Pin Bar.

Variant Bullish Inside Bar candlestick patterns

How to trade Forex effectively with the Bullish Inside Bar

As a strong and reliable bullish signal, Bullish Harami is most often used as a signal to confirm the entry point by professional traders. It is because the price is likely to rise sharply after it comes out. Therefore, you can only open BUY (Long) orders with it. Here are 2 basic strategies to trade Forex that you can refer to.

Strategy 1. Fish the bottom of the market

The basis for opening an order in Forex is when Bullish Harami appears in a downtrend. Focus on opening BUY orders because it is likely that the price will increase. For the strategy to be more effective, you can combine this signal with other indicators.

Open a BUY order as follows:

+ Entry Point: As soon as the price completes the pattern.

+ Stop-Loss: At the lower shadow of the first bearish candlestick in the pattern

+ Take-Profit: when the price touches old resistance levels that have been formed in the past.

Strategy 1: Fish the bottom of the market

Strategy 2. Open an order following the trend

This trading strategy is safer because you can only place orders when the uptrend has formed. In Forex, Bullish Harami appears to confirm that the price will continue to rise.

Open a BUY order as follows:

+ Entry Point: As soon as the price completes the pattern.

+ Stop-Loss: At the lower shadow of the first bearish candlestick in the pattern

+ Take-Profit: when the price touches old resistance levels that have been formed in the past.

Strategy 2. Open an order following the trend

In addition to the two basic trading strategies above, in the strategic articles, you will come across the Harami pattern incorporating multiple time frames. Or they can use it in conjunction with other trading signals. This is a candlestick pattern that has many uses in Forex.

Summary

In Forex, candlestick and price signals are very important to every trader. And Bullish Harami is no exception. This is a very good confirmation signal of a trend reversal. Get acquainted and test it on a Demo account today. Goodbye and see you again.

Register an Exness account NowGet $1,000 Free for beginners

The post Bullish Harami Candlestick: Characteristics And How To Trade In Forex appeared first on How To Trade Blog.


source https://howtotradeblog.com/how-to-trade-bullish-harami-pattern-forex/

Sunday, February 7, 2021

Review Pullback Candlestick Trading Strategy On The Real Account

In the previous post, I have shown you how to trade in Olymp Trade with the Pullback candlestick. This is a candlestick that carries many effective trading signals that can help you open precise Fixed Time orders. In today’s article, I would like to share the practical effectiveness of Pullback trading strategy on a Real account in Olymp Trade. Stay tuned to find out if this is the trading strategy you are looking for to win in Olymp Trade.

Register an Olymp Trade account NowGet $10,000 Free for beginners

Review a trading strategy in Olymp Trade with the Pullback candlestick on January 26, 2021

This article was written right after I had spent a day trading in Olymp Trade using the Pullback candlestick as trading signals. If you do not know what a Pullback candlestick is and how to trade with it, you can review my previous post on this candlestick here:

+ What is a Pullback candlestick? Trade effectively with the Pullback candlestick in Olymp Trade.

In this article, I will not go back to what is in the previous post. I will only review this trading strategy through orders opened on January 26, 2021. Along with that, there are a few notes to make this trading strategy more effective. Let’s analyze transactions in Olymp Trade on a Real account with this strategy.

Orders opened on January 26 with the Pullback strategy in Olymp Trade

I opened a total of 5 Fixed Time orders with different currency pairs. The result was 4 wins and 1 loss. I used the Classic capital management method with an investment of $20 for each order. The total profit was $44 (with an average payout of 80%). Let’s put the profits aside and start getting into each specific transaction. Because I know that this is exactly what you have been waiting for. 

Details on Fixed Time orders opened on January 02, 2020

1st order: At the EUR/USD pair, the price was in an uptrend and broke out of the resistance to go up. Right after that, a Pullback candlestick appeared with a long tail pointing down to the resistance just crossed. Opened an UP order for the next candlestick. I won.

1st order with the Pullback candlestick in Olymp Trade

2nd order: At the EUR/AUD pair, after a decline from the morning session, the price showed signs of bottoming up and going up gradually. As soon as the price surpassed the resistance and went up, it retested this zone to create a Pullback candlestick. Opened an UP order. I won.

2nd order with the Pullback strategy in Olymp Trade

3rd order: Actually, this is not an order opened with a Pullback candlestick. The signal candlestick here was a retest Pin Bar candlestick. Regarding this case, I will clarify in the notes. Fortunately, the result was still a win with a profit of $16.

3rd order with the Pullback strategy in Olymp Trade

4th order: It was still with the NZD/CAD pair from the 3rd order. For this order, the standard Pullback candlestick appeared. There were enough conditions to open an order betting on the next green candlestick.

4th order with the NZD/CAD pair

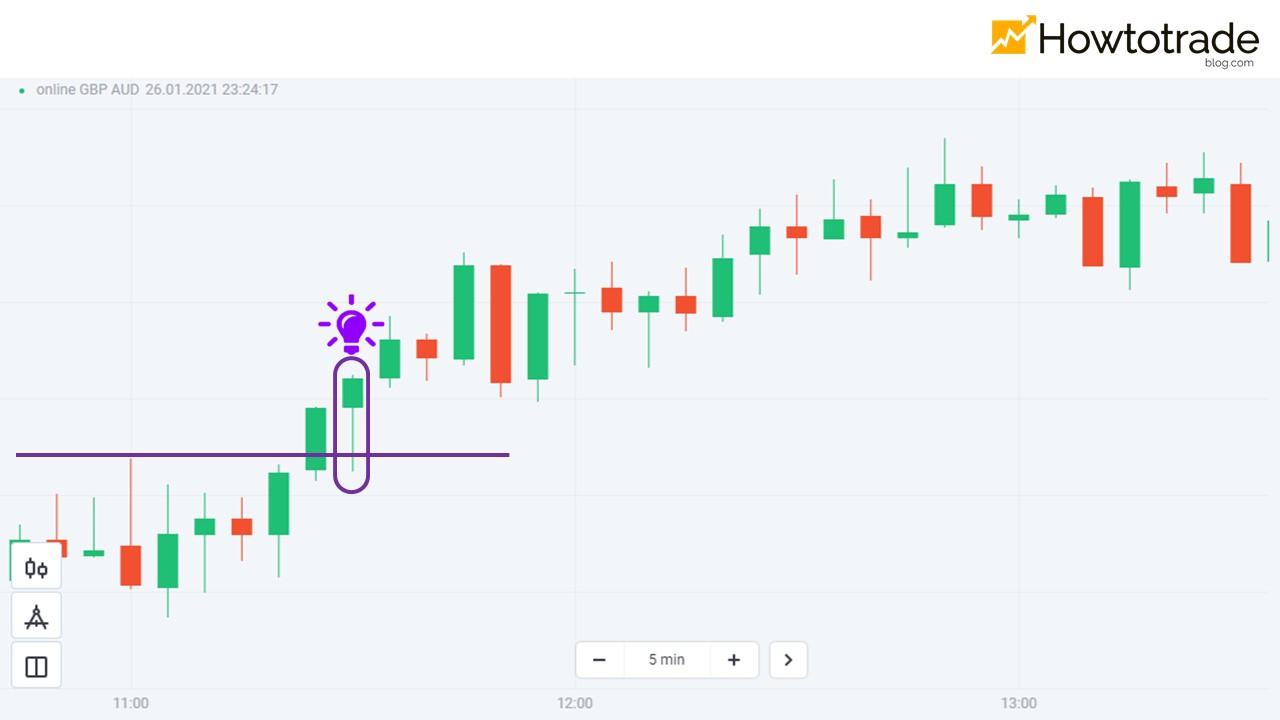
5th order: This was a losing order. The GBP/AUD pair moved with quite a large margin. I was quite hesitant in this case because the previous bullish candle did not really break out of the resistance and go up. Therefore, I lost in the last seconds when the price did not really surpass the resistance. I will elaborate on this in the notes.

5th order with the GBP/AUD pair

At the end of the 5th order, I stopped trading and started writing this article. In addition to trading in Olymp Trade, I also have my main job. Therefore, in a day, I couldn’t spend too much time on it.

Some notes of the Pullback candlestick trading strategy

As you can also see, the signal that a Pullback candlestick can bring is very good. If you open orders correctly following this strategy, your odds of winning will be 80%. Of course, this statistic may have many shortcomings because I only counted it on 1 day. However, it is still a good sign that you can test for a large enough time to ensure if this win rate is stable or not.

Here are a few notes on this Fixed Time trading strategy in Olymp Trade using Pullback candlesticks. Please keep in mind carefully if you want to trade with this candlestick.

Note 1: A Pullback candlestick and a Retest candlestick can be different. This is exactly what I want you to note. For practical trading, you may often confuse these two types of candles. Remember, a Pullback candlestick is a candle that contains an entire adjustment and continues the trend of the price right after the breakout. The example below is a Retest candlestick, not a Pullback one.

This is a Retest candlestick, but not a Pullback one
This is a Retest candlestick but not a Pullback one

Note 2: Ideally, a Pullback candlestick is created with the tail just touching the wick of the previous candle which has created the level. You can see it as shown below. This shows that, after breaking out of the level, right when the price recovers, it is pushed back by a strong force to continue the trend. Also, a Pullback candlestick without a wick will be much better.

Pullback candlestick trading strategy note

In one word

Have you ever tested this trading strategy in Olymp Trade with the Pullback candlestick? If not, start today with a Demo account and then a Real account. With my trading experience, this is an effective strategy to trade Fixed Time. If you have ever traded with this candlestick, what is your result? Let me know in the comment section. 

Register an Olymp Trade account NowGet $10,000 Free for beginners

The post Review Pullback Candlestick Trading Strategy On The Real Account appeared first on How To Trade Blog.


source https://howtotradeblog.com/review-pullback-candlestick-trading-strategy/

Friday, February 5, 2021

How To Trade Forex Effectively With Bearish Harami Candlestick Pattern

Today, I will introduce to you how to use the Bearish Harami candlestick pattern in Forex trading. This is a good signal for orders following the downtrend. This article will provide all the best knowledge about this special candlestick pattern.

Register an Exness account NowGet $1,000 Free for beginners

What is a Bearish Harami candlestick pattern?

Harami is the common name for a type of candlestick pattern shaped like a pregnant woman. Bullish Harami is a candlestick pattern signaling the reversal of prices from falling to rising. In contrast, the Bearish Harami candlestick pattern is a signal for a reversal from up to down.

These two candlestick patterns are very good, highly accurate signal pairs. Traders always give an eye on them when they appear on the price chart.

What is a Bearish Harami candlestick pattern?

Structure and meaning

A standard Bearish Harami pattern consists of 2 candles.

+ The first candlestick is a strong green bullish one.

+ The second candlestick is a red (bearish) candle lying within the first one.

Combining the 2 candles of this pattern, you will get a Bearish Pin Bar (aka Shooting Star). These are popular candlesticks signaling bearish trends. This explains why Bearish Harami is a reliable bullish to bearish reversal signal.

Structure and meaning

On the Japanese candlestick price chart: This candlestick pattern usually appears at the end of uptrends and predicts a future price decline. Sometimes, the Bearish Harami pattern also appears in a downtrend and warns of the continuation of the market trend.

Positions of the Bearish Harami pattern

Different variant patterns

Compared to the standard pattern, the Bearish Harami variant has a slightly different structure. The second candlestick is a Spinning Top or Pin Bar. This variant pattern is also a very noticeable signal of experienced traders when it appears.

Different variant Bearish Harami patterns

How to trade Forex effectively with the Bearish Harami

There are many ways to use the pattern for Forex trading with a high win rate. Here, I will show you 2 trading strategies with this reversal candlestick pattern as a confirmation signal.

Important notes: Bearish Harami is a bearish signal in the future so you can only open SELL (short) orders.

Strategy 1. Place SELL orders at the top with Bearish Harami

This trading strategy is very simple but quite risky. As long as the price creates a Bearish Harami pattern, open a SELL order right after that.

+ Entry Point: As soon as the price completes the Bearish Harami candle.

+ Stop-Loss: At the shadow of the first candlestick in the pattern

+ Take-Profit: When the price touches old support levels that have been formed in the past.

Place SELL orders at the top

Strategy 2. Open an order following the downtrend

This trading strategy is considered to be safer. However, you need 2 factors as follows: a downtrend market and Bearish Harami appearance. Place a SELL order right after that because it is likely that the price will continue to decline sharply.

+ Entry Point: As soon as the price completes the Bearish Harami candle.

+ Stop-Loss: At the shadow of the first candlestick in the Bearish Harami candlestick pattern

+ Take-Profit: When the price touches old support levels that have been formed in the past.

Open orders following the downtrend

In conclusion

The above are just test transactions to get you familiar with the Bearish Harami. Perform these transactions right on your Demo account to verify the effectiveness. Finally, I would like to wish you all success in trading.

Register an Exness account NowGet $1,000 Free for beginners

The post How To Trade Forex Effectively With Bearish Harami Candlestick Pattern appeared first on How To Trade Blog.


source https://howtotradeblog.com/bearish-harami-candlestick-pattern-forex/

Wednesday, February 3, 2021

How To Withdraw Funds From Exness Broker To Skrill

After depositing Exness broker with Skrill and making a profitable investment, all you need to do is withdraw your money to enjoy the joy that all traders love. Happiness will come to you very quickly because after only 3 minutes the money will be transferred to your account. This article will guide you how to withdraw money from your Exness account to Skrill wallet in the most specific way.

Register an Exness account NowGet $1,000 Free for beginners

Video clip instructions on how to withdraw money from Exness broker to Skrill

How to withdraw funds from Exness account to Skrill step-by-step

Step 1: Select a withdrawal method using Skrill wallet

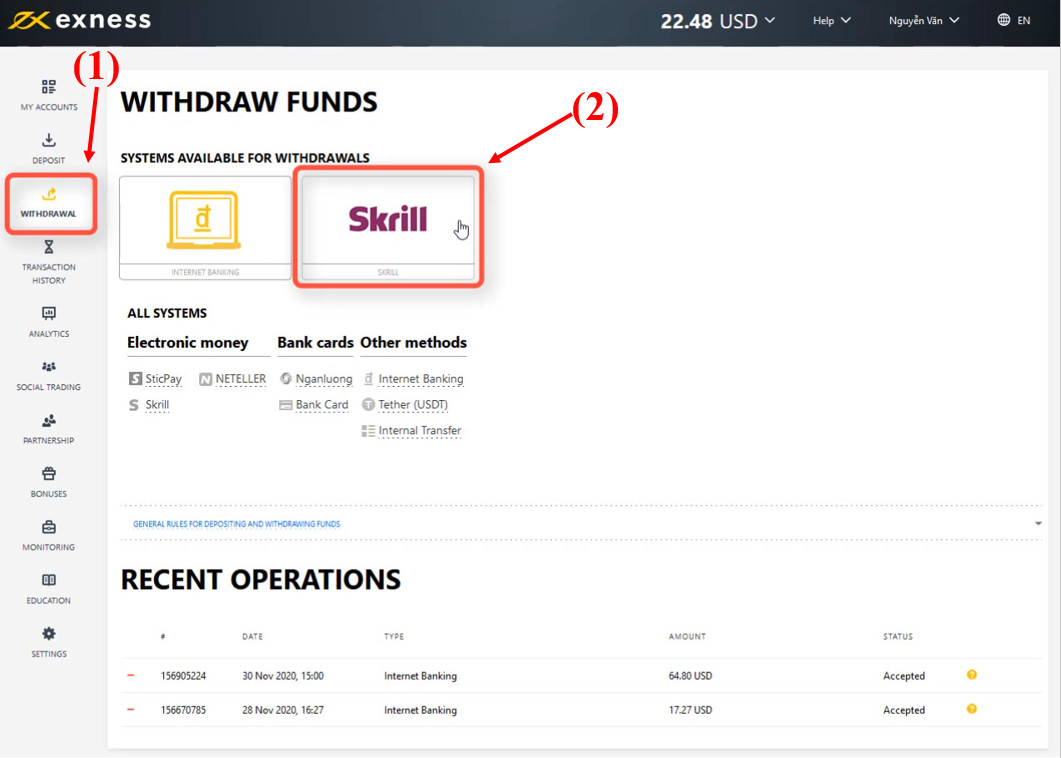
First, log into your Exness account. Then select “Withdrawal” on the left hand side of the screen. Choose Skrill when you used this method to recharge before.

Choose Skrill as your withdrawal method

Step 2: Enter the address of Skrill wallet and the amount you want to withdraw

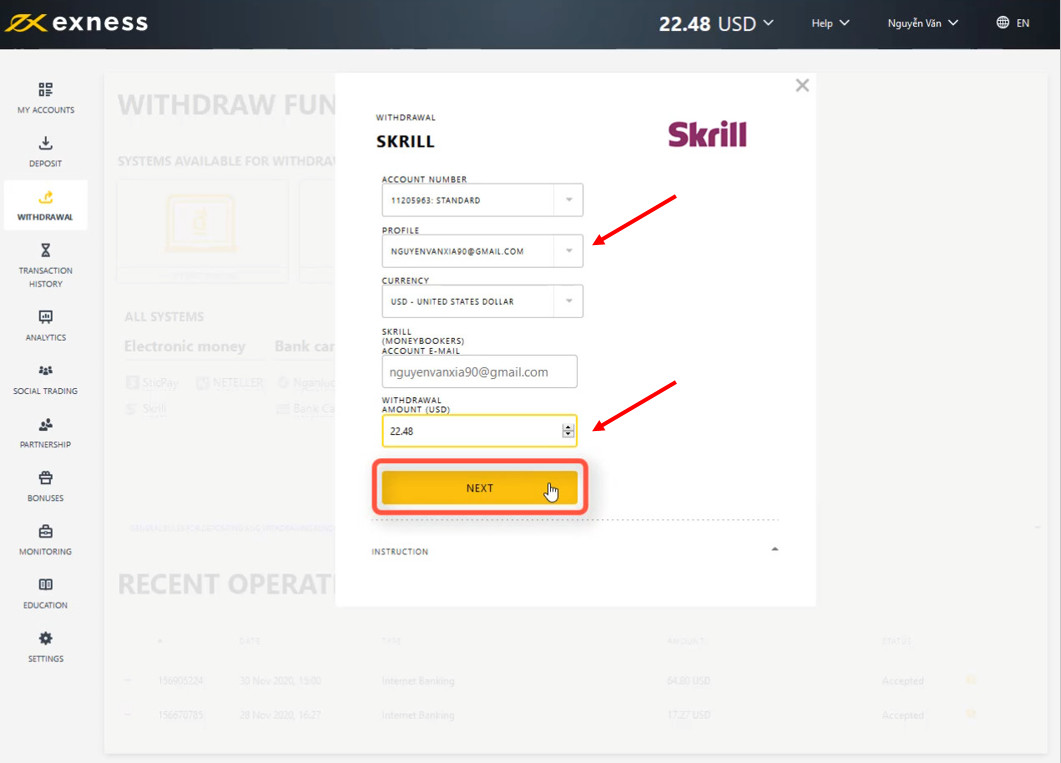
In the “Profile” section, enter your Skrill wallet address and the amount you want to withdraw at “Withdrawal Amount”.

Enter the address of Skrill wallet and the amount you want to withdraw

Step 3: Enter the confirmation code

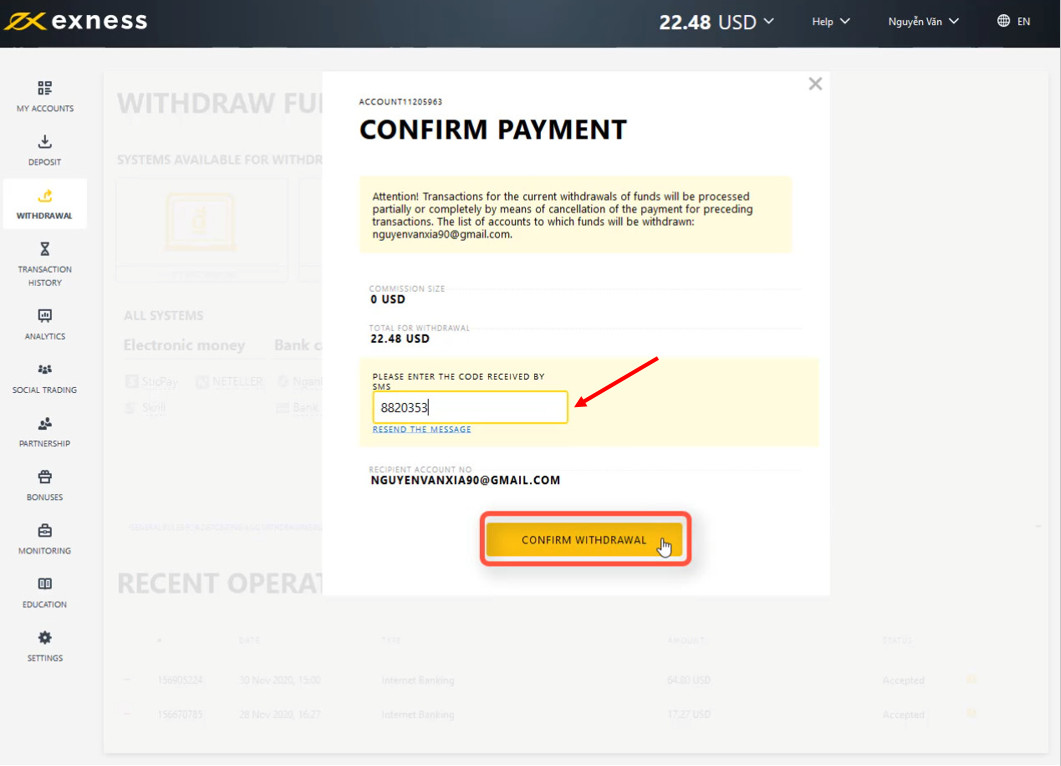
To ensure that the person making the withdrawal is the account holder, Exness will provide a confirmation code via the phone number of the account registered. After filling the code, click “Confirm Withdrawal”.

Enter the confirmation code from your SMS

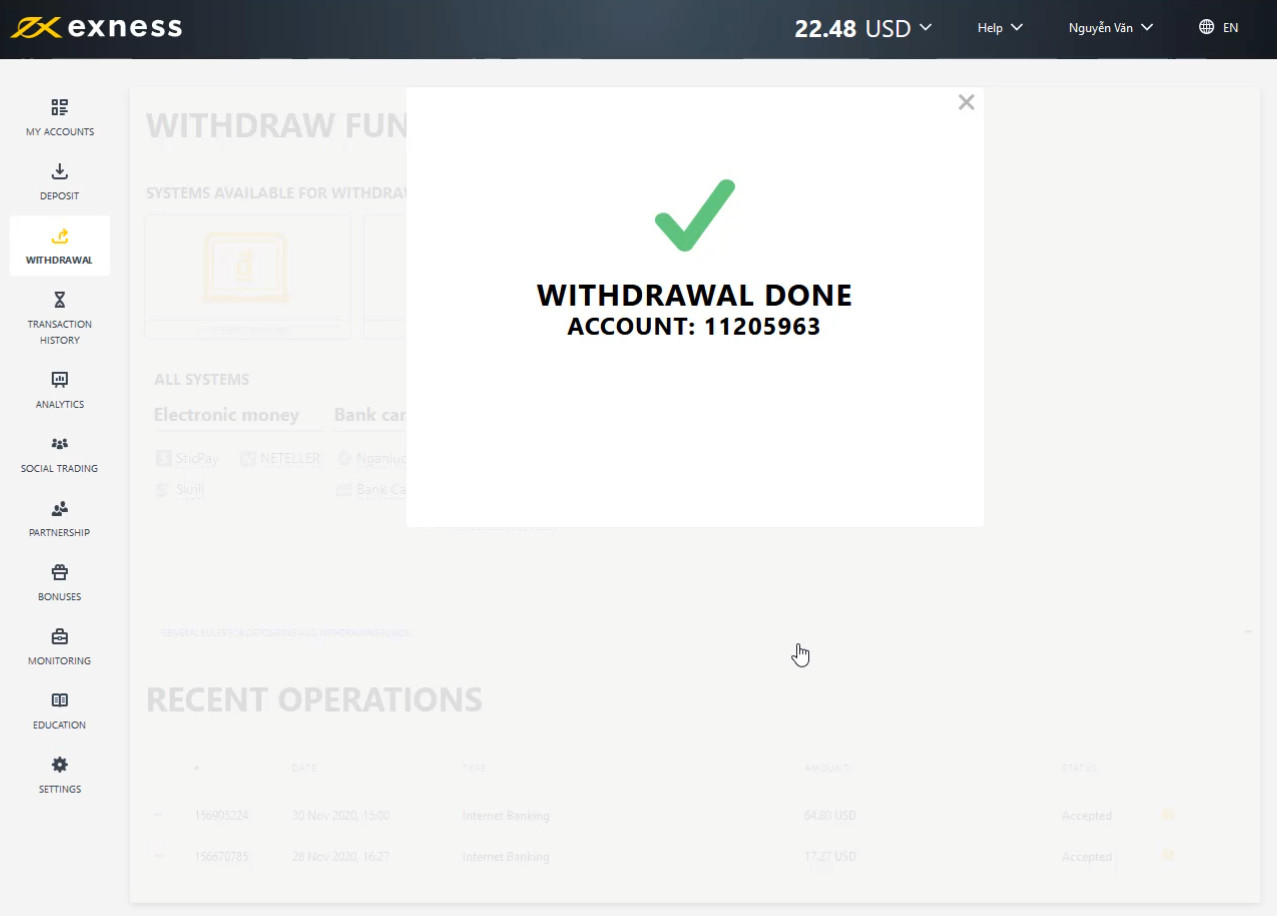
So you have completed the withdrawal process from Exness broker.

Complete the withdrawal from Exness broker to Skrill

Within a few minutes the balance in the account will be debited and the Skrill wallet will receive the funds. After 24 hours, if you still don’t receive the money, please contact with Exness support to resolve the problem.

Register an Exness account NowGet $1,000 Free for beginners

The post How To Withdraw Funds From Exness Broker To Skrill appeared first on How To Trade Blog.


source https://howtotradeblog.com/how-to-withdraw-exness-skrill/
Tuesday, February 2, 2021

How To Deposit Money To Exness With Skrill Account

If you top up your Exness account using Internet Banking , convenience is what you will get the most. However, it has the limitation of being applicable to only one country. But when you deposit Exness with the Skrill e-wallet , you can use it anywhere in the world at “light” speed. And this article will guide you to do that in the most detail.

Register an Exness account NowGet $1,000 Free for beginners

Video clip instructions for depositing Exness via Skrill

How to deposit your Exness account with the Skrill e-wallet

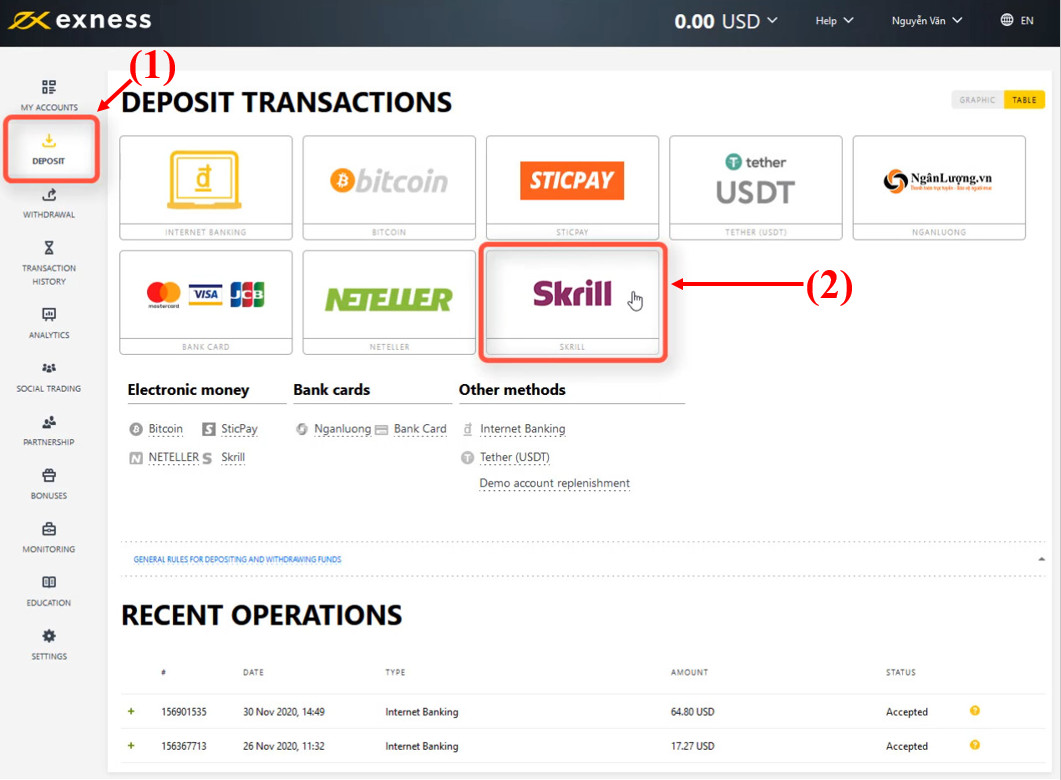
Step 1: Click Deposit and choose Skrill

After logging into your Exness account, at the main screen, select “Deposit” right in the left corner of the screen. Choose to top up using Skrill.

Select the deposit method to Exness

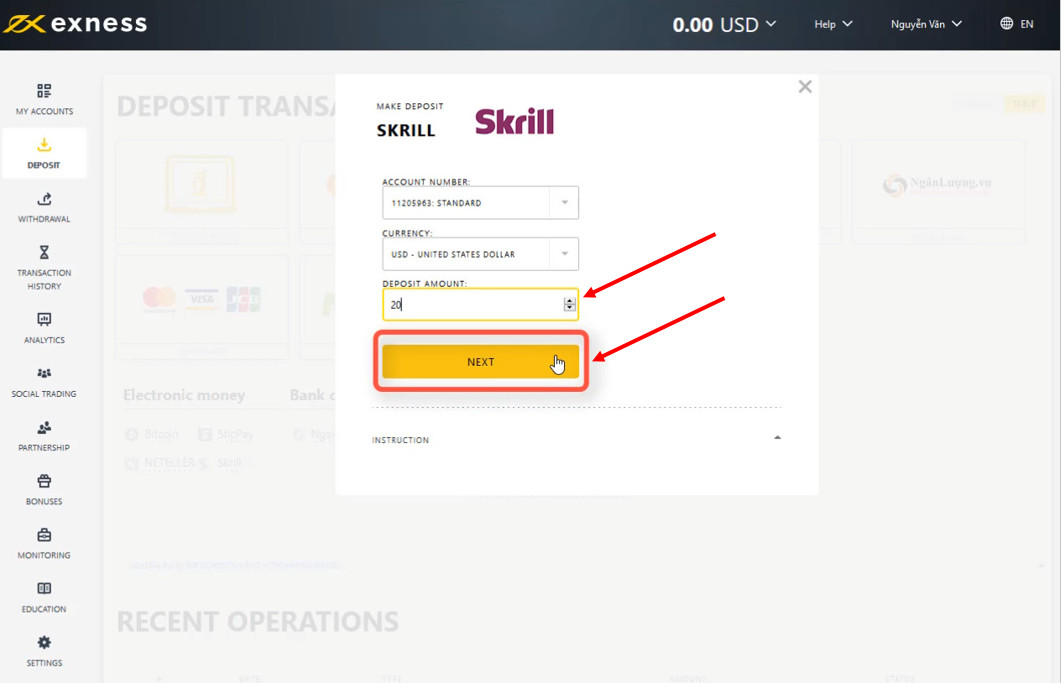
Step 2: Enter the amount you want to deposit in the “Deposit Amount”

Exness minimum deposit is only $1. Fill in the amount of money you want then click Next.

Enter the amount to deposit into Exness

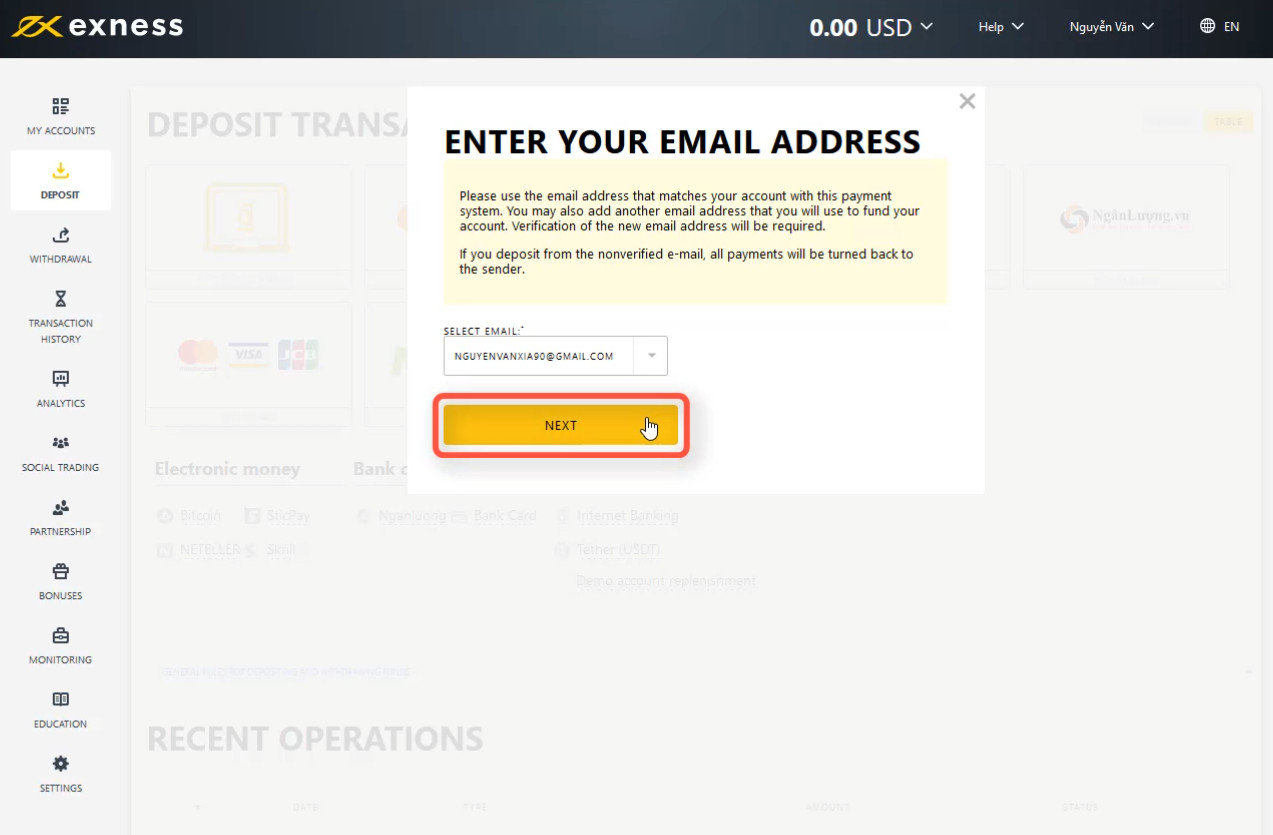
Step 3: Select the email you use associated with Skrill wallet

Exness system will automatically link with Skrill wallet if the email you use to set up your Exness and Skrill accounts is the same. If not, please enter the email used to register your Skrill account and perform the required verification steps.

Select the email you use associated with Skrill

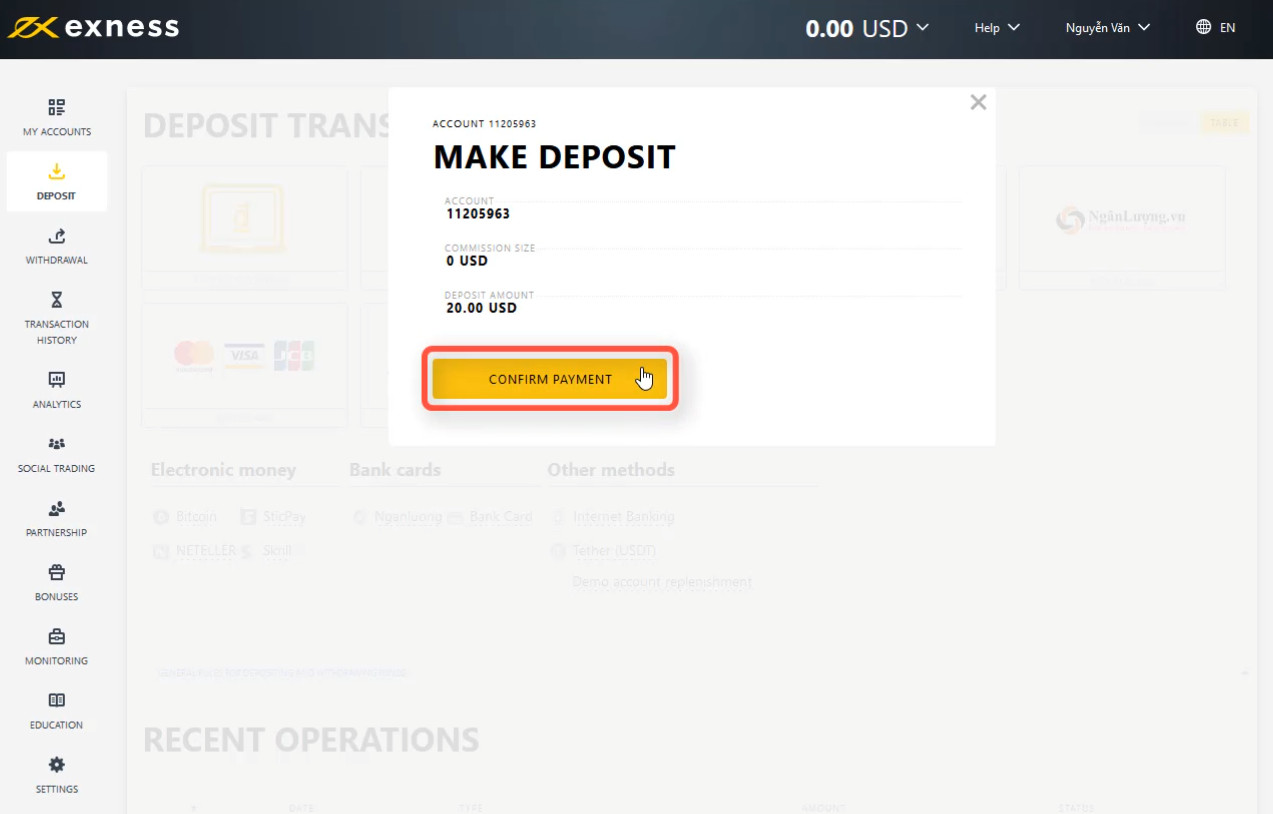
Step 4: Check the deposit amount

If correct, select “Confirm Payment”.

Check the deposit amount

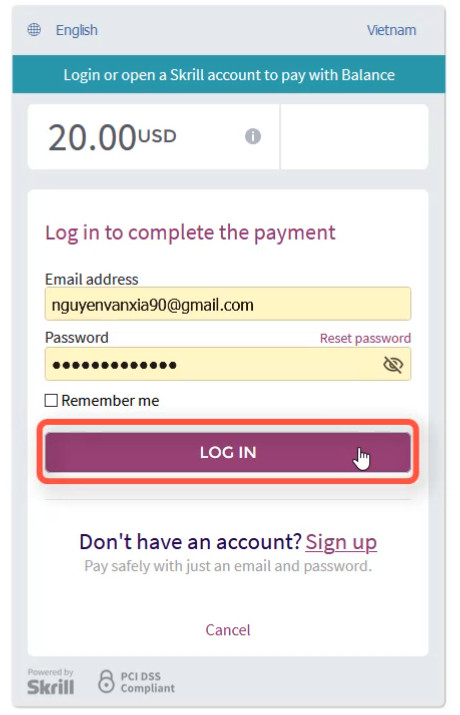
Step 5: Login to your Skrill account

Login to your Skrill account 
Login to your Skrill account

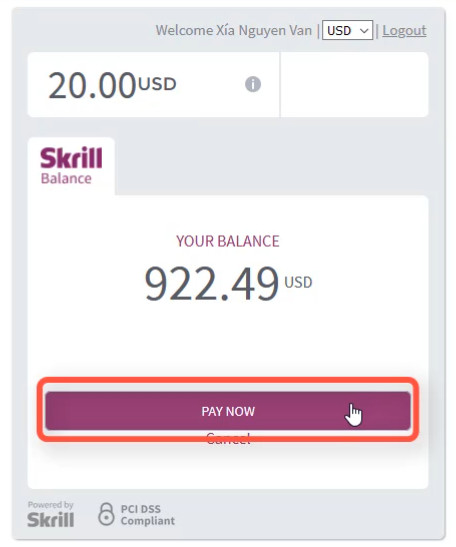
Step 6: Click “Pay Now” to confirm payment

Click "Pay Now" to confirm payment
Click “Pay Now” to confirm payment

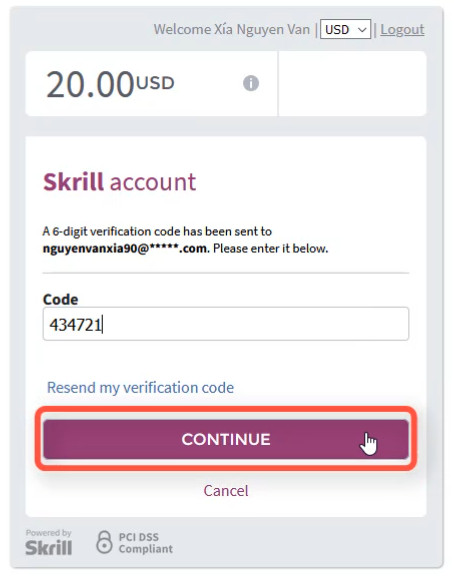
Step 7: Enter the confirmation code

Then click Continue. In case you checked the email but still didn’t receive the code, click Resend my verification code. And recheck the mail.

Enter the confirmation code

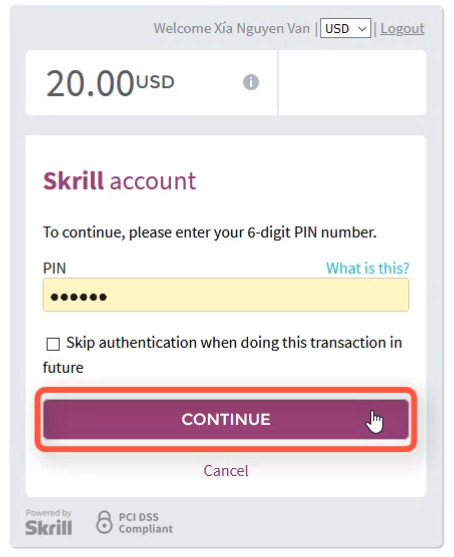
Step 8: Enter your Skrill PIN

Enter your Skrill PIN

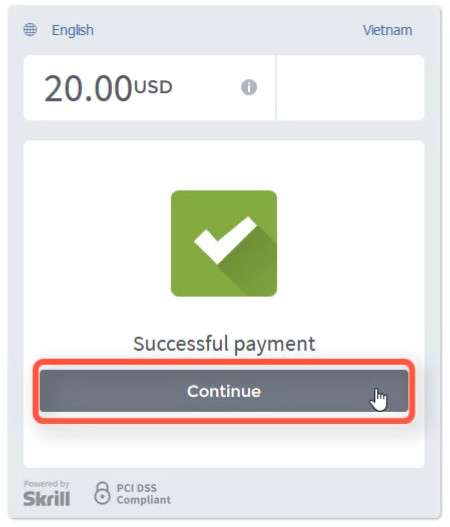
After entering your PIN number, click Continue. If everything is correct, you are finished recharging your Exness account using the Skrill wallet .

Complete your deposit using Skrill wallet

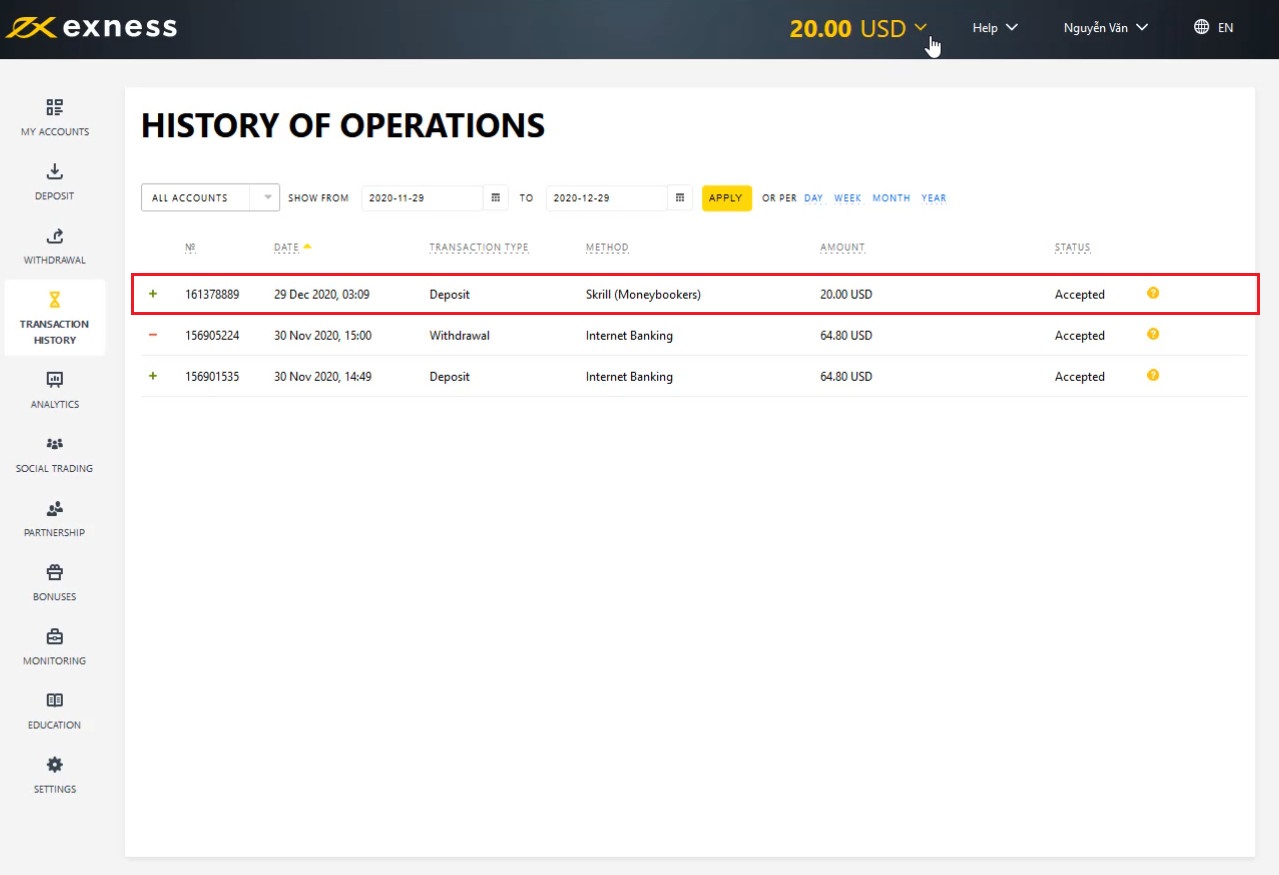
Usually the money will be credited into your account immediately after completing the above 8 steps.

Check your transaction history

Register an Exness account NowGet $1,000 Free for beginners

The post How To Deposit Money To Exness With Skrill Account appeared first on How To Trade Blog.


source https://howtotradeblog.com/deposit-money-exness-skrill/