In the previous post, I have shown you how to effectively trade Fixed Time using signals of the RSI divergence. In today’s article, I will bring you one last piece of the puzzle to make this strategy the most effective. It is the 50 median line of the RSI indicator and how to use it in Olymp Trade.
Register an Olymp Trade account NowGet $10,000 Free for beginners
50 line – the precise trend confirmation signal of RSI
For the majority of traders, when using RSI, they are only interested in the 30 (oversold) and 70 (overbought) lines only. Few people know that the median 50 of the RSI is of great significance in determining the price trend of the market. Take a look at the image below so you can see this.
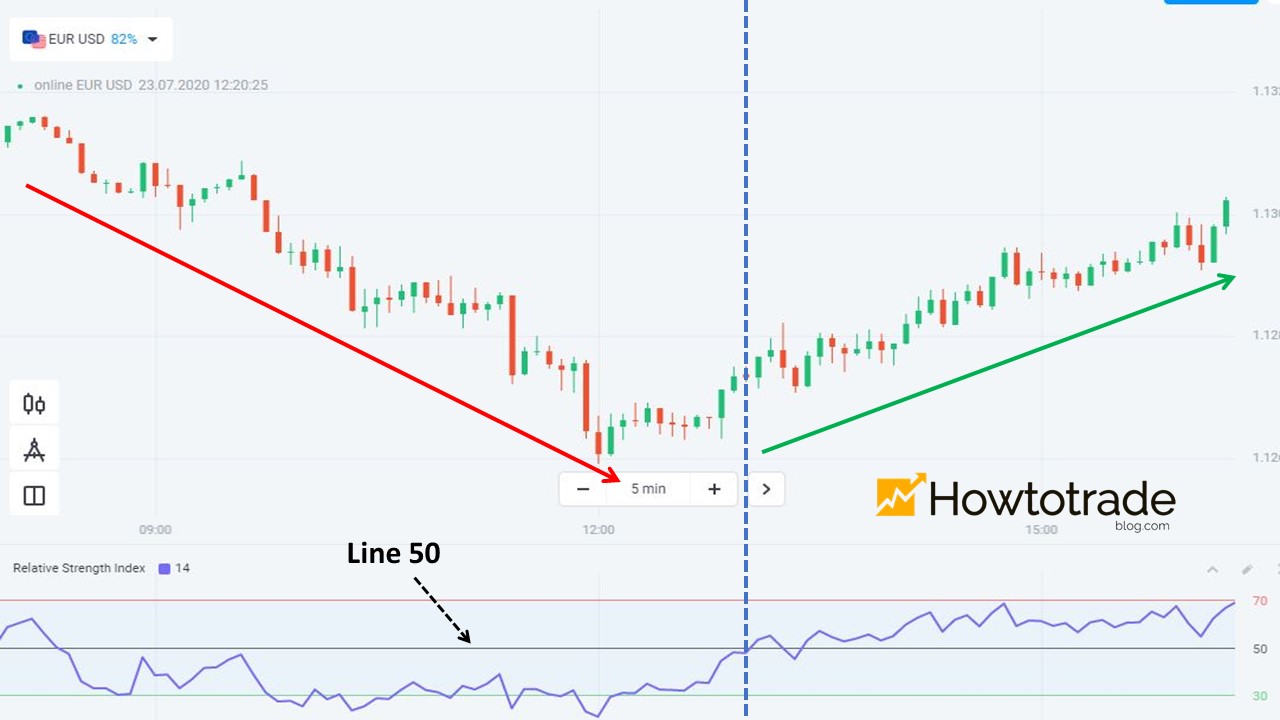
As you can see: When the price is in a downtrend, the RSI fluctuates around 30-50 lines. Conversely, when the price increases, the RSI is within the 50-70 lines. That is to say, the 50 line is the RSI dividing line, warning which trend the market is in. This is shown clearly when the RSI crosses the 50 line, the price has a trend reversal.
And this is the perfect piece for you to get the most accurate transactions with RSI.
How to use RSI indicator trading strategies in Olymp Trade
If you are not sure how to trade Olymp Trade using the divergence of RSI indicator, you can review it here:
+ Trade In Olymp Trade Effectively With The RSI Divergence.
Combined with the 50 line signal, we will have a complete trading strategy as follows.
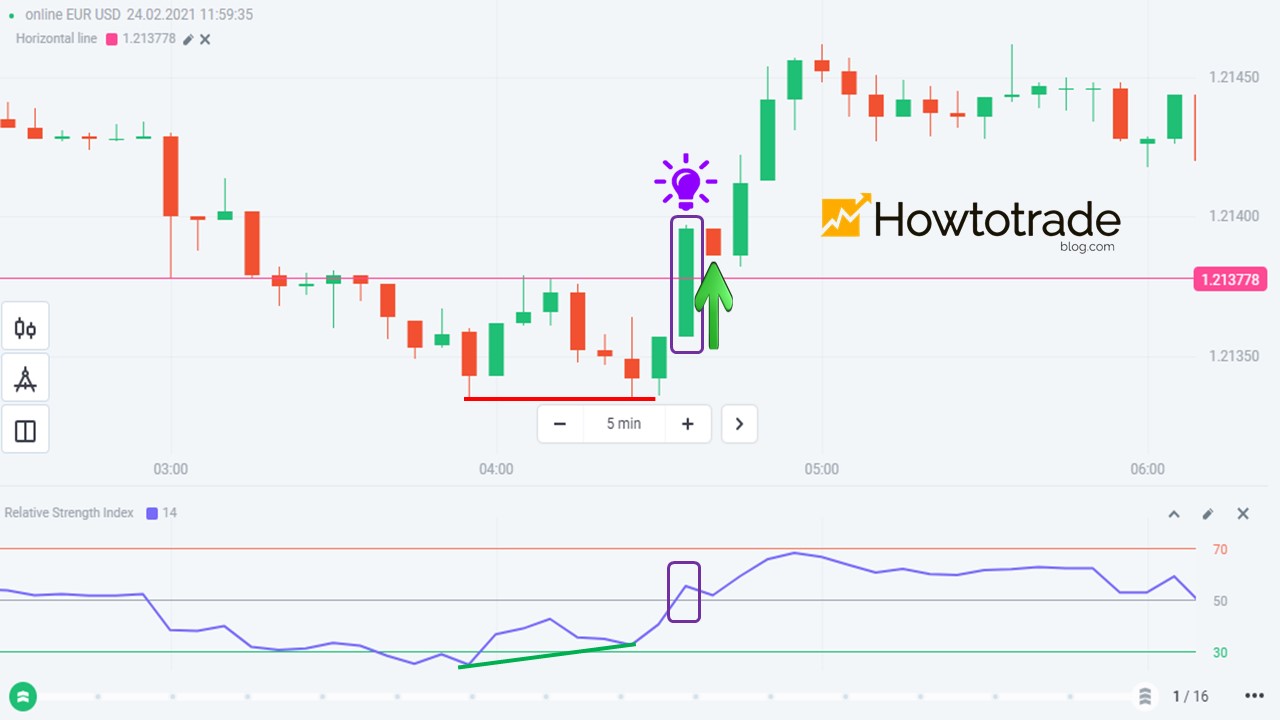
Open an UP order when the following signals appear in turn
- The RSI bullish divergence appears.
- Prices break out of the resistance and go up.
- The RSI indicator crosses the 50 line from below.
Open a DOWN order when the following signals appear in turn
- The RSI bearish divergence appears.
- Prices fall out of the support and go down.
- The RSI indicator crosses the 50 line from above.
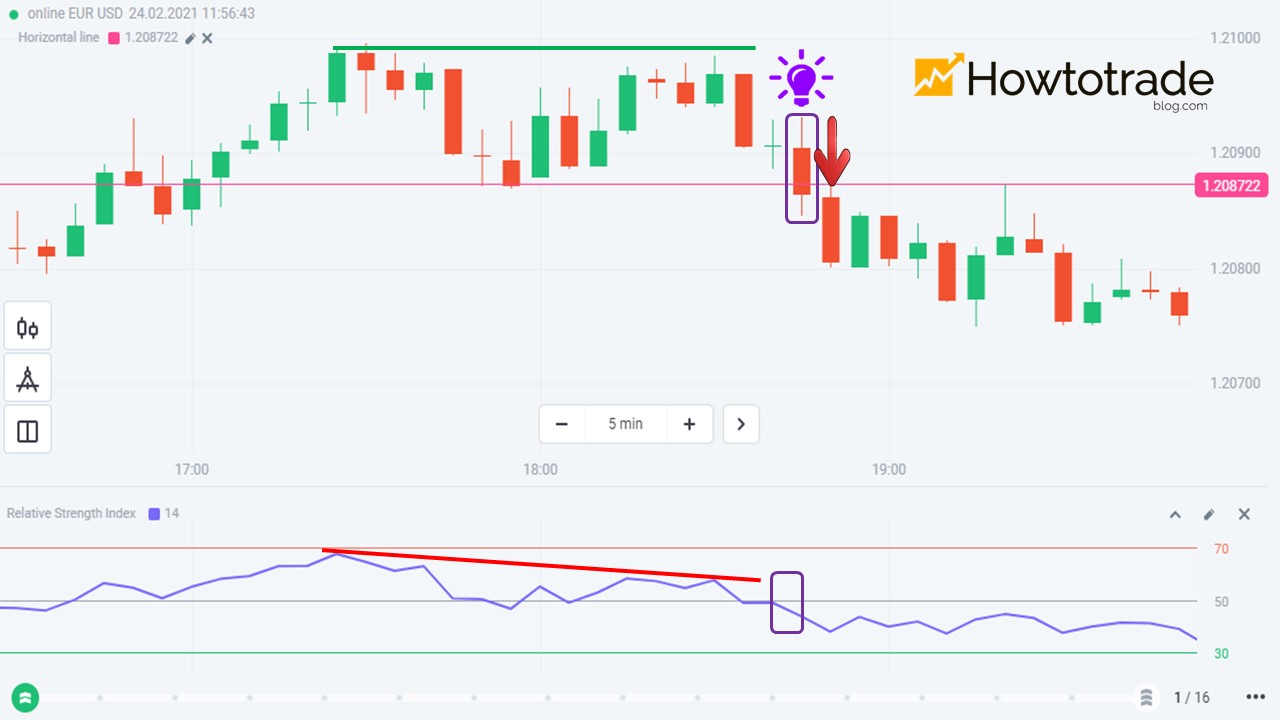
*Notes: Open an order as soon as the confirmation candle completes.
Some typical examples
In this section, I will talk about 2 examples that demonstrate why the 50 line is so special in this trading strategy. Let’s see the examples one by one.
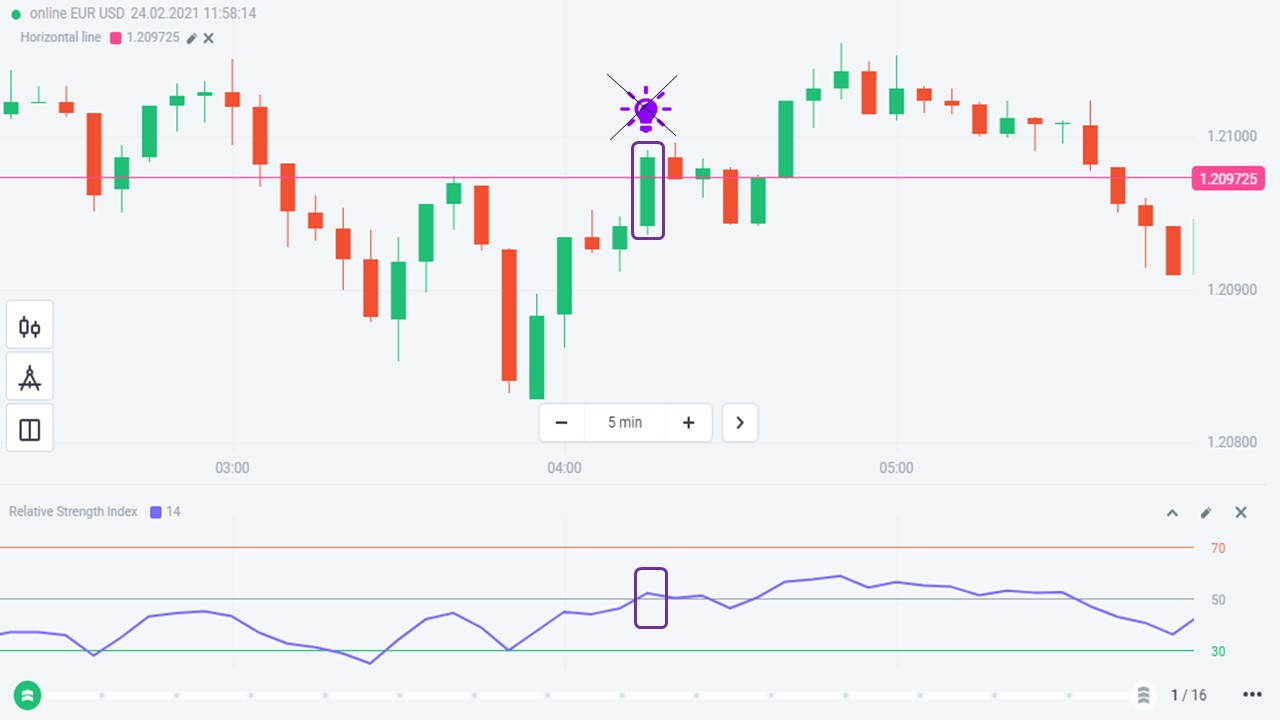
Example 1: The price has broken out of the resistance but RSI has not completely crossed the 50 line. This is an incorrect signal for you to open an UP order.
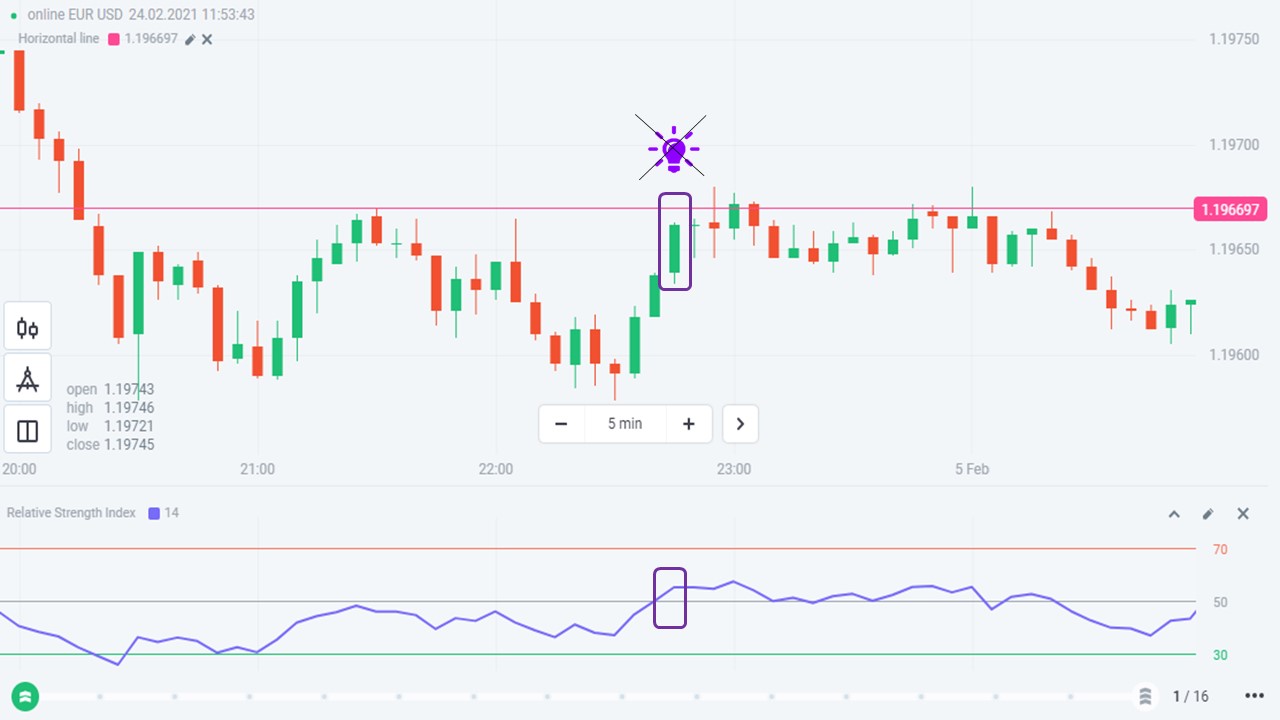
Example 2: RSI has crossed the 50 line but the price has not yet surpassed the resistance. This is also an incorrect signal for you to open orders.
In the two examples above, it can be seen that the 50 line helps to early identify an incorrect signal to avoid placing wrong orders. Very effective, isn’t it?
Summary
In Olymp Trade, the RSI indicator is one of the best tools that you can apply in trading. The signals it gives always have certain meanings to help you recognize something. The important thing is to know how to combine them, giving an objective signal about the market. From there, your judgment will be more confident than ever. The article should end here. Goodbye and see you again.
Register an Olymp Trade account NowGet $10,000 Free for beginners
The post How To Use The RSI Indicator Trading Strategies In Olymp Trade appeared first on How To Trade Blog.
source https://howtotradeblog.com/rsi-indicator-trading-strategies-olymp-trade/
No comments:
Post a Comment