In trading and analysis, the Japanese candlestick is the most commonly used. Japanese candles are structured and feature a lot of market information. In which, the wick or shadow of the candlestick is dissected a lot when traders analyze the action and direction of price movement.
In today’s article, I will show you how to trade Fixed Time in Olymp Trade with this candlestick shadow. This is a simple and easy trading strategy with a high win rate. Let’s see what we can do with the shadow of Japanese candles in Olymp Trade.
Register an Olymp Trade account NowGet $10,000 Free for beginners
Candlestick shadow and its meaning in technical analysis
On the Japanese candlestick price chart, candles are divided into 2 types: with shadows and without shadows. In which, the candlestick with shadows at 2 ends is considered a type of candle in which the price has a complicated and difficult direction to grasp. Also, a candle with a long shadow represents a strong price rejection in the direction that the shadow hits. Capturing these details will help you to be able to analyze the price action more accurately and objectively.
Usually, a candle with a shadow makes sense (offers good trading signals) when it falls into the following two cases:
- When the price hits resistance/support zones if the price goes sideways.
- When the price breaks a level, creates a trend, and retests this level. In Forex, this is considered the act of filling the price gap of the market.
In both of the above scenarios, there is a strong price rejection in zones controlled by the sides of the market. And this is the basis for you to apply when trading Fixed Time in Olymp Trade.
Trade Fixed Time simply and effectively with the candlestick shadow in Olymp Trade
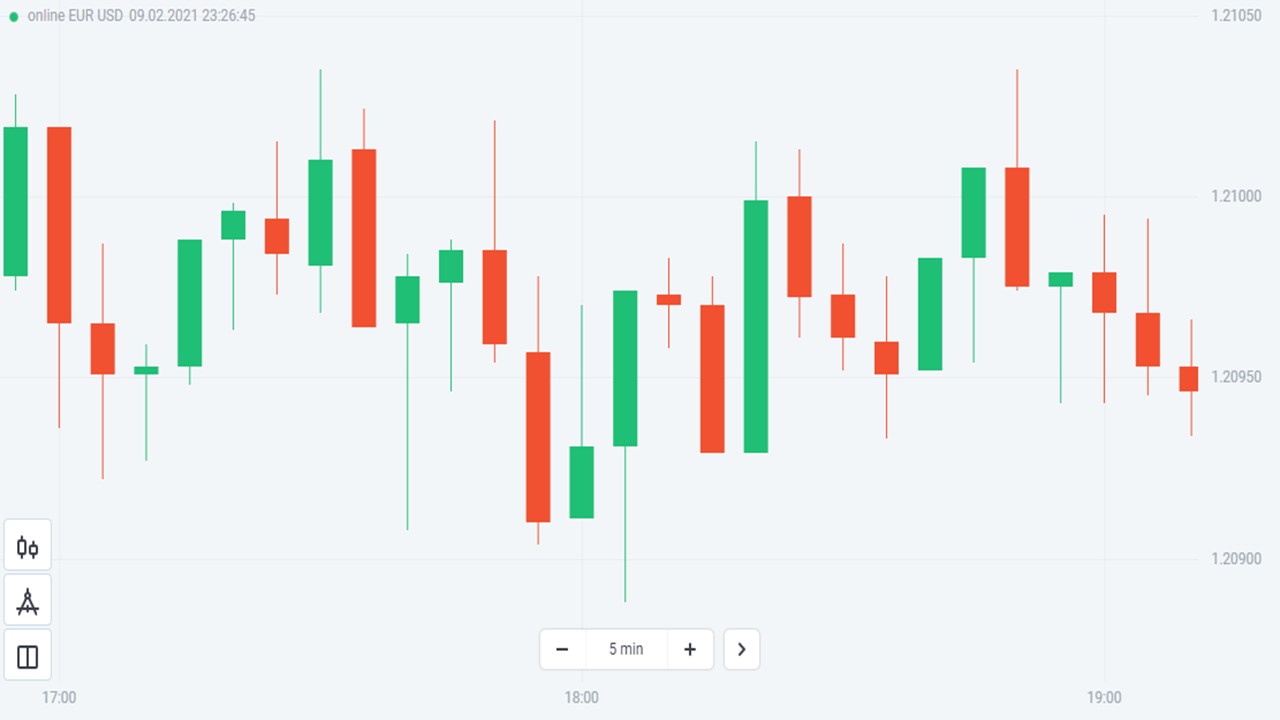
The first is the basic setup. A 5-minute Japanese candlestick chart. Open orders evenly with the amount of 1% capital. In the notes, I will explain why it should be 1%. The expiration time should be equal to the candle time period of the current candle which the price is forming.
Do you understand how to trade? That is, we will wait when the price touches meaningful price zones (in both cases) and open an order. With the above time-mark setting, when the candlestick shadow retraces, the price will go right with the opened order.
I will categorize the trading method above into two strategies.
Strategy 1: Trade when the price is sideways
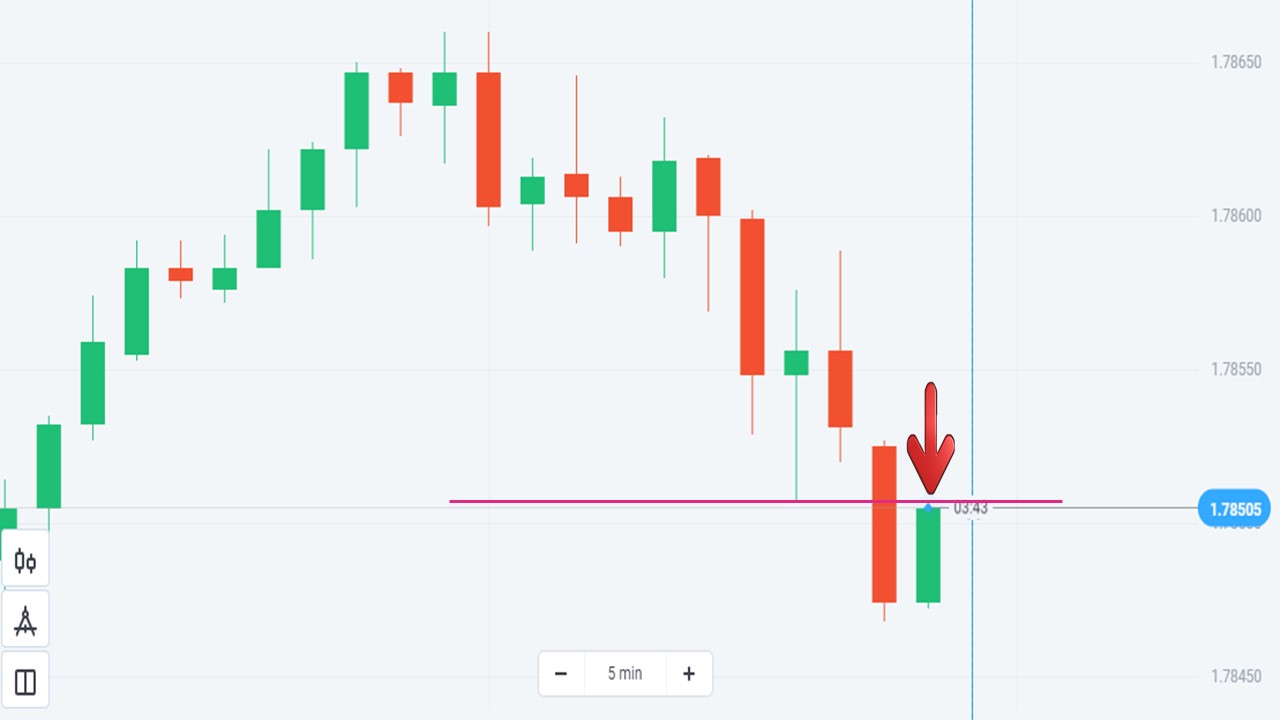
When the price is going sideways, draw 1 resistance and 1 support according to the shadows of the past candles. These are zones where there is a very strong price reversal (because of that, shadows will appear). Then, focus on the current candlestick which the price is creating.
+ If the price rises sharply and hits the resistance level, open a DOWN order.
+ On the contrary, when the price falls and hits the support level, open an UP order.
Remember that you have set the basic settings I mentioned above before opening orders.
After opening the order, the price will react to these resistance/support zones. And in many cases, the price will be pushed back to create the shadow of this candle.
Strategy 2: Trade when the price breaks out of levels and creates trends
This trading strategy is used a lot by Forex traders. For them, in this situation, when the price returns to match the candlestick shadow, it is a phenomenon of sweeping through stop-loss after a price breakout. Therefore, traders will wait for the price to return to fill the candle before opening an order. And when you trade Fixed Time, the trading strategy is the same.
After the price breaks out of a level, there are signs of a new trend. Focus on the candle after the breakout.
+ Open an UP order when the price returns to touch the previous upward candlestick shadow that is closest to the breakout point.
+ Open a DOWN order when the price rebounds to touch the previous downward candlestick shadow that is closest to the breakout point.
Of course, make sure you have set the basic settings that I mentioned above.
You think this trading strategy is too risky, don’t you?
Do you think so? At first, I also thought that this trading strategy was too dangerous and hardly offered a good win rate. However, when I tested it on the Demo account, the results showed very positively. I will point out a few factors that make this trading strategy safer and more effective than you think.
+ On the Japanese candlestick chart, there are more candles with shadows than those without shadows.
+ In a trading session, there are many opportunities for you to open orders with this trading strategy. Just invest with the original capital management plan, it will be very difficult for you to burn out the account.
+ For the strategy using the breakout and trend creation, the win rate is very high because this is a common price retest behavior.
In addition, this trading strategy has some advantages compared to other strategies such as easy to understand and implement. You don’t have to spend too much time opening orders. And if there are candles with good shadows within a day, you will soon reach your intraday trading target.
Results of opened orders
Now, let’s take a look at the results of the orders I opened as mentioned above.
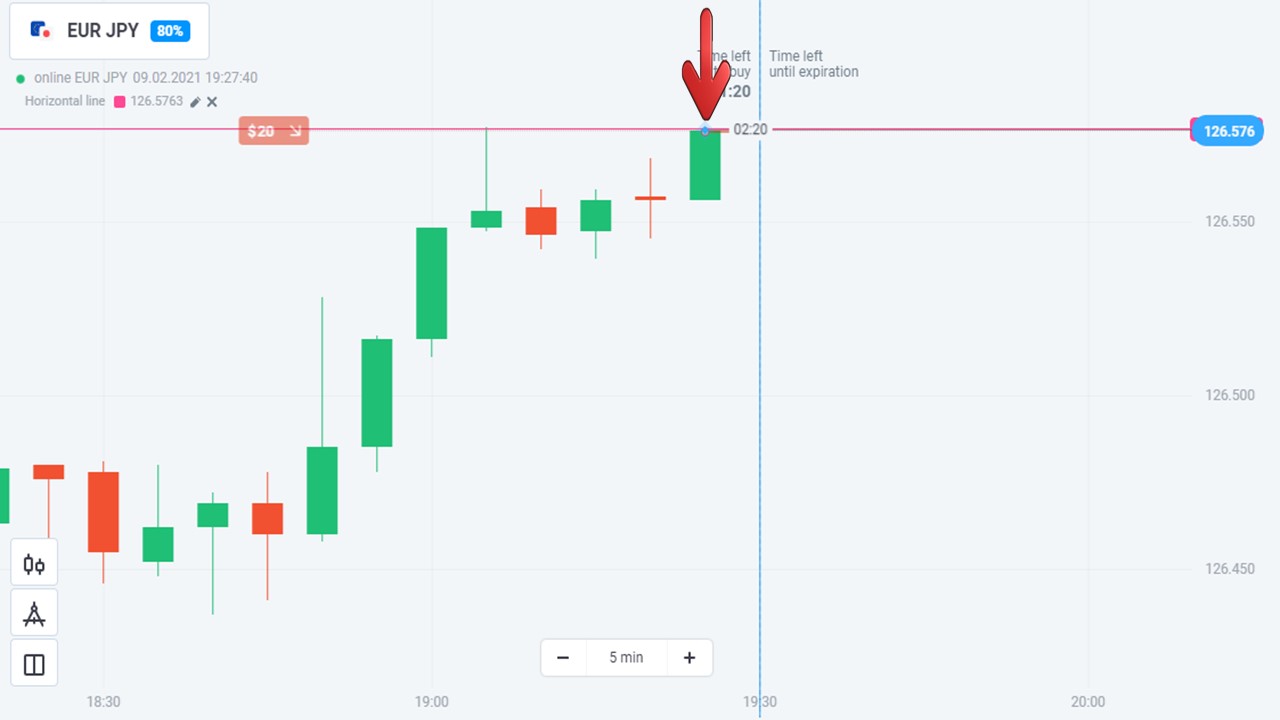
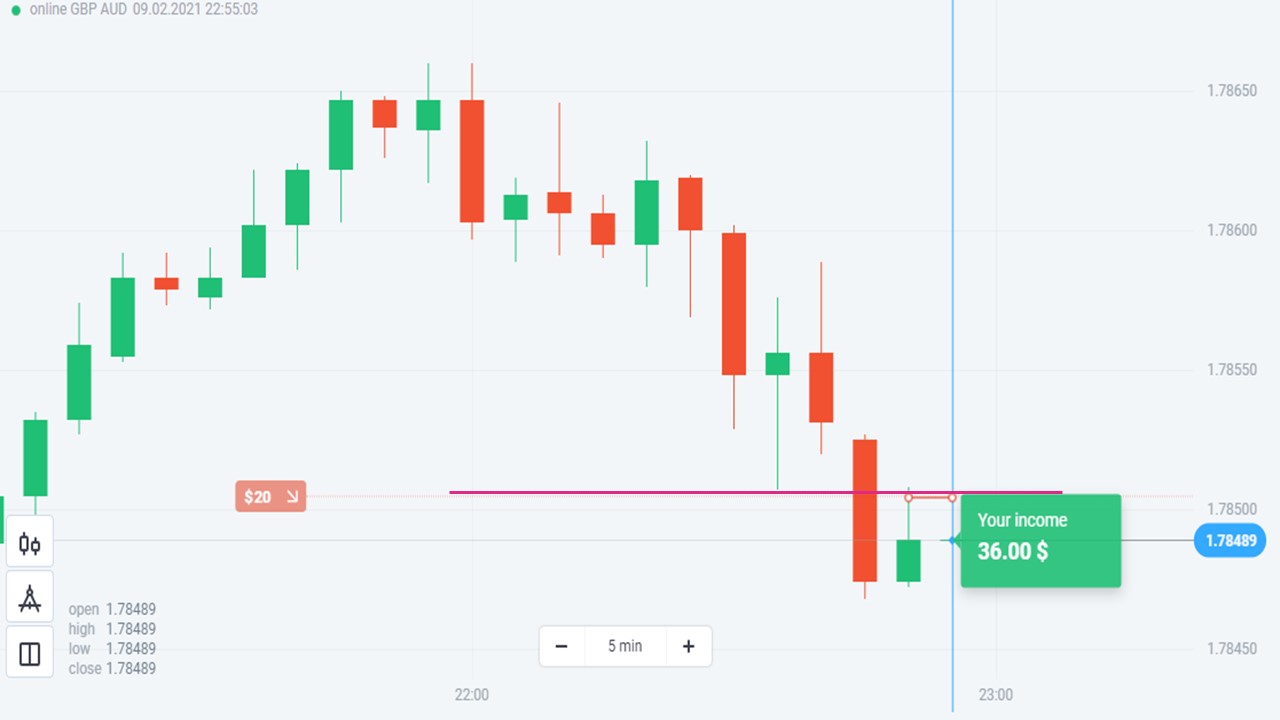
1st order: The price hit the support and then turned up.
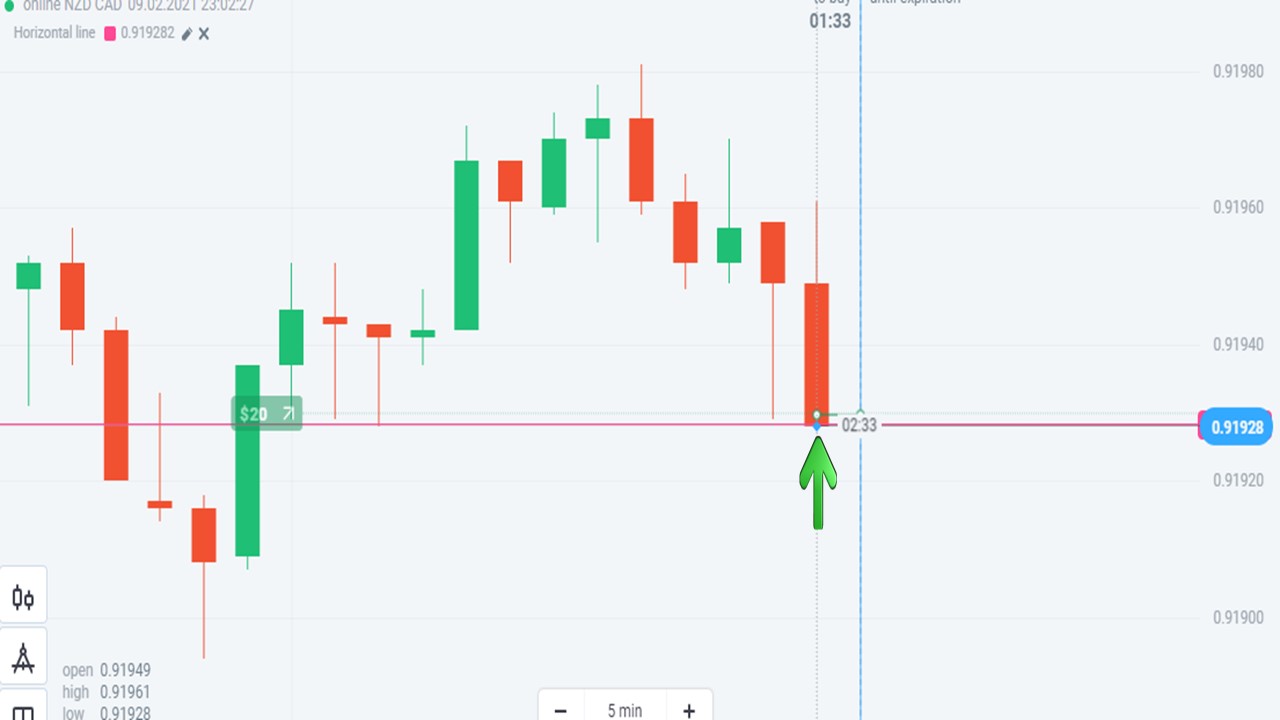
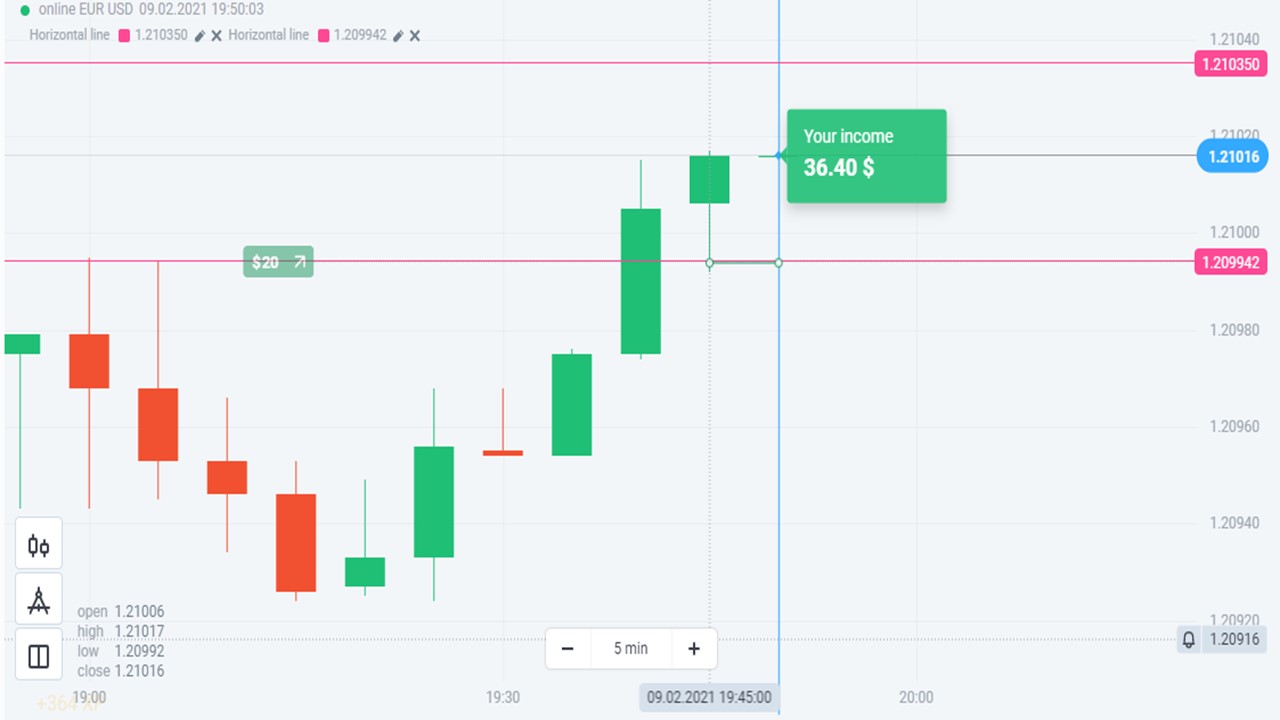
2nd transaction: This was an absolute winning order when the price touched the candlestick shadow and immediately turned around.
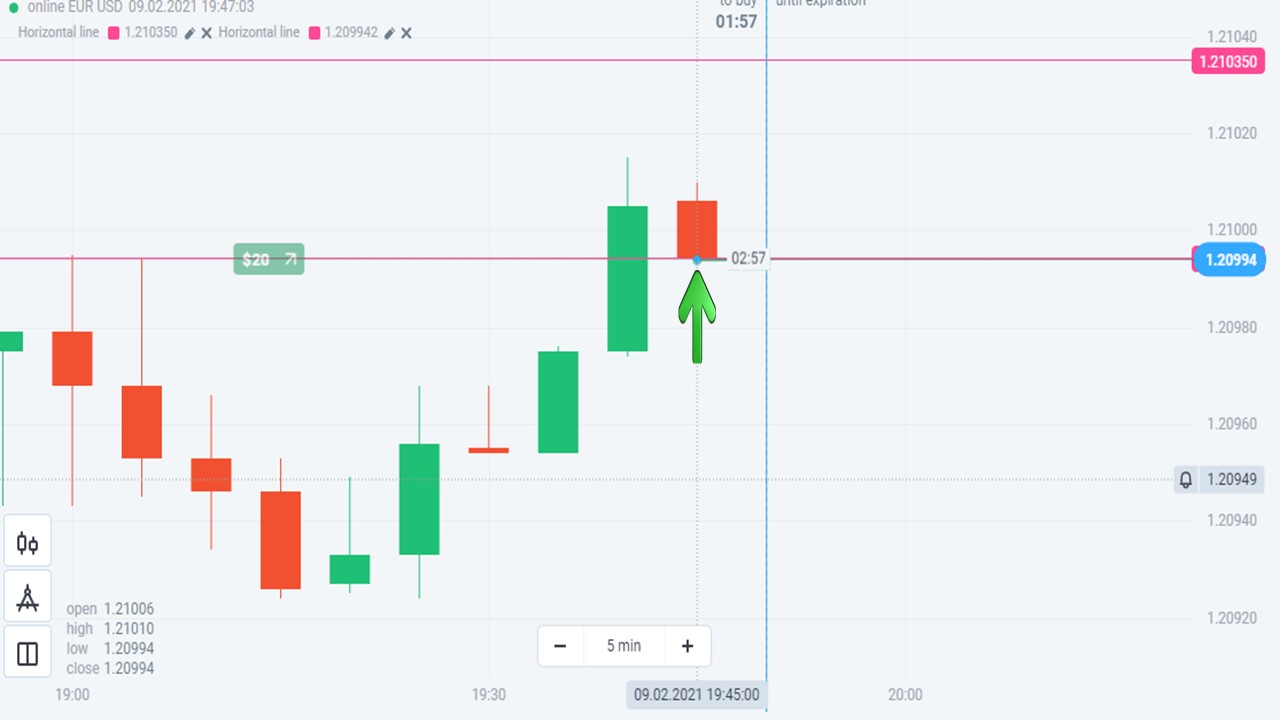
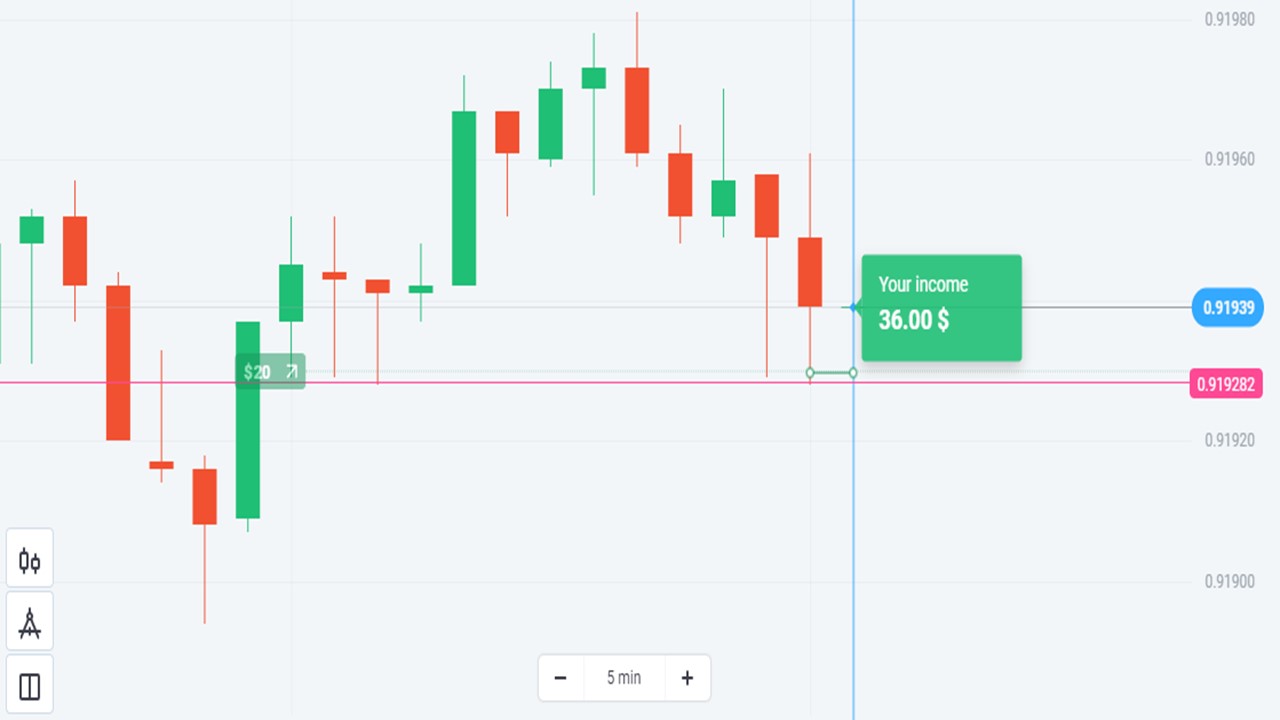
3rd one: The results were very satisfactory.
Summary
I will have an article about testing this trading strategy in Olymp Trade on a Real account. Let’s follow it up. For now, turn on the Olymp Trade Demo account and experience this strategy directly. Leave any questions if you need answers. Goodbye and see you again.
Register an Olymp Trade account NowGet $10,000 Free for beginners
The post Trade In Olymp Trade Simply And Effectively With 5-minute Candlestick Shadow appeared first on How To Trade Blog.
source https://howtotradeblog.com/trade-in-olymp-trade-5-minute-candlestick-shadow/
No comments:
Post a Comment